Содержание
- Ошибка 1032 сообщения в журнале приложений в Windows Server 2012
- Симптомы
- Причина
- Обходной путь
- Дополнительные сведения
- Вертим логи как хотим ― анализ журналов в системах Windows
- Журналы и командная строка
- Работаем с журналами посредством запросов SQL
- Windows system32 logfiles sum svc log
- Asked by:
- Question
- All replies
Ошибка 1032 сообщения в журнале приложений в Windows Server 2012
В этой статье описывается решение проблемы, возникающей при попытке запустить экземпляры SQL Server или службы аналитики SQL Server на компьютере под управлением Windows Server 2012.
Исходная версия продукта: Службы аналитики SQL Server, SQL Server
Исходный номер статьи базы знаний: 2811566
Симптомы
Рассмотрим следующий сценарий.
- Microsoft SQL Server или SQL Server Analysis Services устанавливаются на компьютер под управлением Windows Server 2012.
- Учетная запись по умолчанию используется в качестве учетной записи службы для этих приложений во время установки.
- Установка прошла успешно.
- После установки службы для этих программ запускаются успешно.
В этом сценарии в журнале приложений могут появиться сообщения об ошибках, аналогичные приведенным ниже.
Для экземпляров SQL Server (SQLServr.exe)
sqlservr (3472) при попытке открыть файл «C:Windowssystem32LogFilesSumApi.log» для доступа только для чтения возникла системная ошибка 5 (0x00000005): «отказано в доступе. «. Операция открытия файла завершится ошибкой с ошибкой-1032 (0xfffffbf8).
Ошибка sqlservr (3472) ошибка-1032 (0xfffffbf8) при открытии файла журнала C:Windowssystem32LogFilesSumApi.log.
Для экземпляров служб SQL Server Analysis Services (Msmdsrv.exe)
msmdsrv (4680) попытка открыть файл «C:Windowssystem32LogFilesSumApi.chk» для доступа к чтению и записи не удалась из-за системной ошибки 5 (0x00000005): «отказано в доступе. «. Операция открытия файла завершится ошибкой с ошибкой-1032 (0xfffffbf8).
msmdsrv (4680) ошибка-1032 (0xfffffbf8) при открытии файла журнала C:Windowssystem32LogFilesSumApi.log.
Причина
Эта проблема возникает из-за недостаточных разрешений для стартовых учетных записей службы SQL Server и для служб аналитики SQL Server, когда службы обращаются к следующей папке для ведения журнала в рамках функции метрики использования программного обеспечения:
Обходной путь
Чтобы обойти эту проблему, добавьте разрешения на чтение и запись вручную для учетных записей служб, которые используются SQL Server (sqlservr.exe) и службы аналитики SQL Server (msmdsrv.exe), чтобы получить доступ к WindowsSystem32LogFilesSum папке.
Дополнительные сведения
Функция метрики использования программного обеспечения использует службу ведения журнала доступа пользователей в Windows Server 2012. Дополнительные сведения : Обзор ведения журнала доступа пользователей.
Вертим логи как хотим ― анализ журналов в системах Windows

Пора поговорить про удобную работу с логами, тем более что в Windows есть масса неочевидных инструментов для этого. Например, Log Parser, который порой просто незаменим.
В статье не будет про серьезные вещи вроде Splunk и ELK (Elasticsearch + Logstash + Kibana). Сфокусируемся на простом и бесплатном.
Журналы и командная строка
До появления PowerShell можно было использовать такие утилиты cmd как find и findstr. Они вполне подходят для простой автоматизации. Например, когда мне понадобилось отлавливать ошибки в обмене 1С 7.7 я использовал в скриптах обмена простую команду:
Она позволяла получить в файле fail.txt все ошибки обмена. Но если было нужно что-то большее, вроде получения информации о предшествующей ошибке, то приходилось создавать монструозные скрипты с циклами for или использовать сторонние утилиты. По счастью, с появлением PowerShell эти проблемы ушли в прошлое.
Основным инструментом для работы с текстовыми журналами является командлет Get-Content, предназначенный для отображения содержимого текстового файла. Например, для вывода журнала сервиса WSUS в консоль можно использовать команду:
Для вывода последних строк журнала существует параметр Tail, который в паре с параметром Wait позволит смотреть за журналом в режиме онлайн. Посмотрим, как идет обновление системы командой:
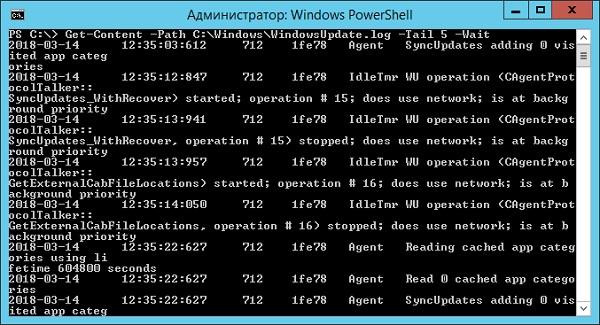
Смотрим за ходом обновления Windows.
Если же нам нужно отловить в журналах определенные события, то поможет командлет Select-String, который позволяет отобразить только строки, подходящие под маску поиска. Посмотрим на последние блокировки Windows Firewall:
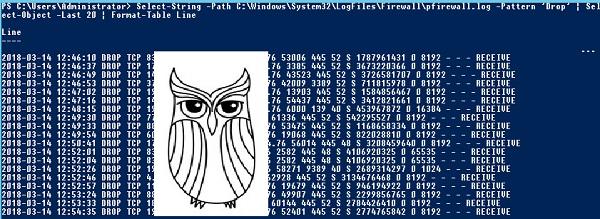
Смотрим, кто пытается пролезть на наш дедик.
При необходимости посмотреть в журнале строки перед и после нужной, можно использовать параметр Context. Например, для вывода трех строк после и трех строк перед ошибкой можно использовать команду:
Оба полезных командлета можно объединить. Например, для вывода строк с 45 по 75 из netlogon.log поможет команда:
Журналы системы ведутся в формате .evtx, и для работы с ними существуют отдельные командлеты. Для работы с классическими журналами («Приложение», «Система», и т.д.) используется Get-Eventlog. Этот командлет удобен, но не позволяет работать с остальными журналами приложений и служб. Для работы с любыми журналами, включая классические, существует более универсальный вариант ― Get-WinEvent. Остановимся на нем подробнее.
Для получения списка доступных системных журналов можно выполнить следующую команду:
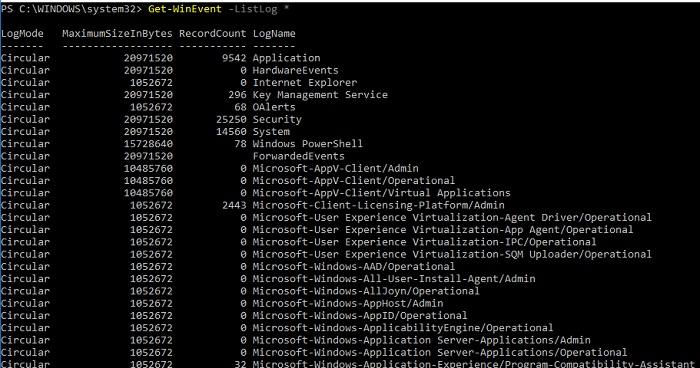
Вывод доступных журналов и информации о них.
Для просмотра какого-то конкретного журнала нужно лишь добавить его имя. Для примера получим последние 20 записей из журнала System командой:
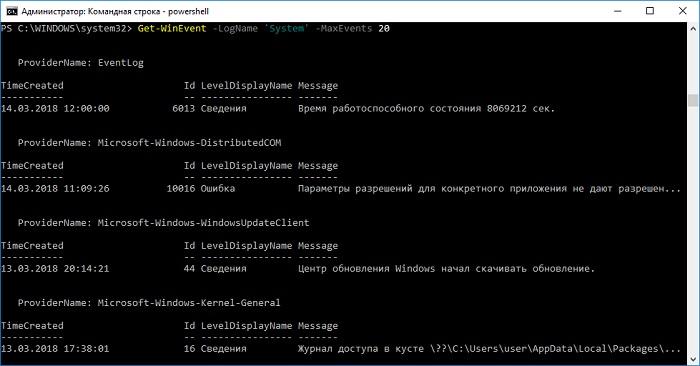
Последние записи в журнале System.
Для получения определенных событий удобнее всего использовать хэш-таблицы. Подробнее о работе с хэш-таблицами в PowerShell можно прочитать в материале Technet about_Hash_Tables.
Для примера получим все события из журнала System с кодом события 1 и 6013.
В случае если надо получить события определенного типа ― предупреждения или ошибки, ― нужно использовать фильтр по важности (Level). Возможны следующие значения:
- 0 ― всегда записывать;
- 1 ― критический;
- 2 ― ошибка;
- 3 ― предупреждение;
- 4 ― информация;
- 5 ― подробный (Verbose).
Собрать хэш-таблицу с несколькими значениями важности одной командой так просто не получится. Если мы хотим получить ошибки и предупреждения из системного журнала, можно воспользоваться дополнительной фильтрацией при помощи Where-Object:
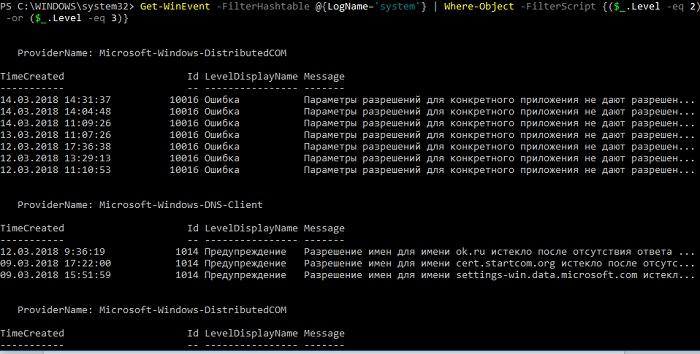
Ошибки и предупреждения журнала System.
Аналогичным образом можно собирать таблицу, фильтруя непосредственно по тексту события и по времени.
Подробнее почитать про работу обоих командлетов для работы с системными журналами можно в документации PowerShell:
PowerShell ― механизм удобный и гибкий, но требует знания синтаксиса и для сложных условий и обработки большого количества файлов потребует написания полноценных скриптов. Но есть вариант обойтись всего-лишь SQL-запросами при помощи замечательного Log Parser.
Работаем с журналами посредством запросов SQL
Утилита Log Parser появилась на свет в начале «нулевых» и с тех пор успела обзавестись официальной графической оболочкой. Тем не менее актуальности своей она не потеряла и до сих пор остается для меня одним из самых любимых инструментов для анализа логов. Загрузить утилиту можно в Центре Загрузок Microsoft, графический интерфейс к ней ― в галерее Technet. О графическом интерфейсе чуть позже, начнем с самой утилиты.
О возможностях Log Parser уже рассказывалось в материале «LogParser — привычный взгляд на непривычные вещи», поэтому я начну с конкретных примеров.
Для начала разберемся с текстовыми файлами ― например, получим список подключений по RDP, заблокированных нашим фаерволом. Для получения такой информации вполне подойдет следующий SQL-запрос:
Посмотрим на результат:

Смотрим журнал Windows Firewall.
Разумеется, с полученной таблицей можно делать все что угодно ― сортировать, группировать. Насколько хватит фантазии и знания SQL.
Log Parser также прекрасно работает с множеством других источников. Например, посмотрим откуда пользователи подключались к нашему серверу по RDP.
Работать будем с журналом TerminalServices-LocalSessionManagerOperational.
Не со всеми журналами Log Parser работает просто так ― к некоторым он не может получить доступ. В нашем случае просто скопируем журнал из %SystemRoot%System32WinevtLogsMicrosoft-Windows-TerminalServices-LocalSessionManager%4Operational.evtx в %temp%test.evtx.
Данные будем получать таким запросом:

Смотрим, кто и когда подключался к нашему серверу терминалов.
Особенно удобно использовать Log Parser для работы с большим количеством файлов журналов ― например, в IIS или Exchange. Благодаря возможностям SQL можно получать самую разную аналитическую информацию, вплоть до статистики версий IOS и Android, которые подключаются к вашему серверу.
В качестве примера посмотрим статистику количества писем по дням таким запросом:
Если в системе установлены Office Web Components, загрузить которые можно в Центре загрузки Microsoft, то на выходе можно получить красивую диаграмму.
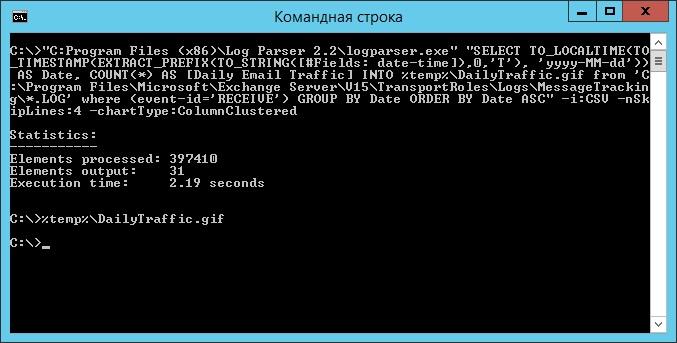
Выполняем запрос и открываем получившуюся картинку…

Любуемся результатом.
Следует отметить, что после установки Log Parser в системе регистрируется COM-компонент MSUtil.LogQuery. Он позволяет делать запросы к движку утилиты не только через вызов LogParser.exe, но и при помощи любого другого привычного языка. В качестве примера приведу простой скрипт PowerShell, который выведет 20 наиболее объемных файлов на диске С.
Ознакомиться с документацией о работе компонента можно в материале Log Parser COM API Overview на портале SystemManager.ru.
Благодаря этой возможности для облегчения работы существует несколько утилит, представляющих из себя графическую оболочку для Log Parser. Платные рассматривать не буду, а вот бесплатную Log Parser Studio покажу.

Интерфейс Log Parser Studio.
Основной особенностью здесь является библиотека, которая позволяет держать все запросы в одном месте, без россыпи по папкам. Также сходу представлено множество готовых примеров, которые помогут разобраться с запросами.
Вторая особенность ― возможность экспорта запроса в скрипт PowerShell.
В качестве примера посмотрим, как будет работать выборка ящиков, отправляющих больше всего писем:
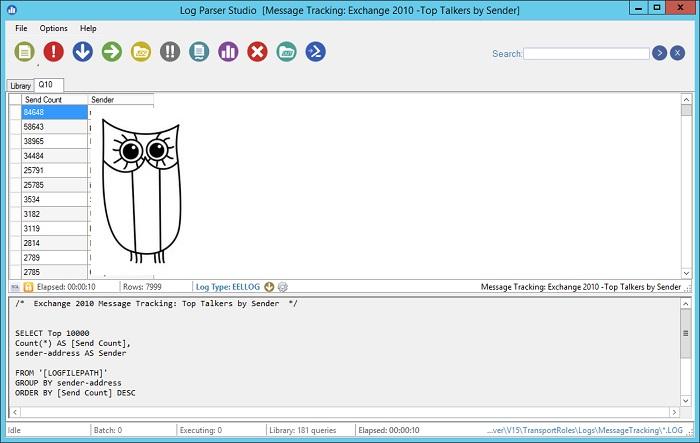
Выборка наиболее активных ящиков.
При этом можно выбрать куда больше типов журналов. Например, в «чистом» Log Parser существуют ограничения по типам входных данных, и отдельного типа для Exchange нет ― нужно самостоятельно вводить описания полей и пропуск заголовков. В Log Parser Studio нужные форматы уже готовы к использованию.
Помимо Log Parser, с логами можно работать и при помощи возможностей MS Excel, которые упоминались в материале «Excel вместо PowerShell». Но максимального удобства можно достичь, подготавливая первичный материал при помощи Log Parser с последующей обработкой его через Power Query в Excel.
Приходилось ли вам использовать какие-либо инструменты для перелопачивания логов? Поделитесь в комментариях.
Windows system32 logfiles sum svc log
This forum has migrated to Microsoft Q&A. Visit Microsoft Q&A to post new questions.
Asked by:
![]()
Question
![]()
![]()
I now install new Domain controller for existing domain (with two DC on WS2008R2).
I use hardware Dell M620 with H710 RAID controller and two HDD SAS 10kRPM. Systém log is OK, but in application log is many warnings about ESENT:
Log Name: Application
Date: 24. 5. 2013 12:48:55
Task Category: General
svchost (2536) A request to write to the file «C:Windowssystem32LogFilesSumSvc.log» at offset 4112384 (0x00000000003ec000) for 4096 (0x00001000) bytes has not completed for 36 second(s). This problem is likely due to faulty hardware. Please contact your hardware vendor for further assistance diagnosing the problem.
Log Name: Application
Date: 24. 5. 2013 12:48:58
Task Category: Performance
svchost (2536) A request to write to the file «C:Windowssystem32LogFilesSumSvc.log» at offset 4112384 (0x00000000003ec000) for 4096 (0x00001000) bytes succeeded, but took an abnormally long time (41 seconds) to be serviced by the OS. This problem is likely due to faulty hardware. Please contact your hardware vendor for further assistance diagnosing the problem.
Log Name: Application
Date: 24. 5. 2013 12:55:42
Task Category: Performance
svchost (2536) A request to write to the file «C:Windowssystem32LogFilesSumSvc.log» at offset 4141056 (0x00000000003f3000) for 4096 (0x00001000) bytes succeeded, but took an abnormally long time (24 seconds) to be serviced by the OS. In addition, 0 other I/O requests to this file have also taken an abnormally long time to be serviced since the last message regarding this problem was posted 403 seconds ago. This problem is likely due to faulty hardware. Please contact your hardware vendor for further assistance diagnosing the problem.
Log Name: Application
Date: 24. 5. 2013 13:15:15
Task Category: Database Page Cache
lsass (640) The database engine attempted a clean write operation on page 8911 of database C:WindowsNTDSntds.dit. This action was performed in an attempt to correct a previous problem reading from the page.
This is realy hardware problem ? Server is tested with WS2012 (without DC) and working without any problém (all firmwares and drivers is up to date).
![]()
![]()
I cannot find information about the file C:Windowssystem32LogFilesSumSvc.log. As it is a log file, try to rename it to svc.old and see if the errors related to the file still exists after reboot.
If the last error still exists, you can have a try with steps provided in this article to :
How to complete a semantic database analysis for the Active Directory database by using Ntdsutil.exe
TechNet Subscriber Support in forum |If you have any feedback on our support, please contact tnmff@microsoft.com.
![]()
![]()
I try your fir step — rename log file svc.log and ESENT warning with this: svchost (2536) A request to write to the file «C:Windowssystem32LogFilesSumSvc.log» now not found in application log.
But this warrnings is found:
Log Name: Directory Service
Source: NTDS ISAM
Date: 27. 5. 2013 16:36:34
Event ID: 507
Task Category: Performance
Level: Warning
Keywords: Classic
User: N/A
Computer: xxxxxxxxxxxxxx
Description:
NTDS (700) NTDSA: A request to read from the file «C:WindowsNTDSntds.dit» at offset 52797440 (0x000000000325a000) for 8192 (0x00002000) bytes succeeded, but took an abnormally long time (32 seconds) to be serviced by the OS. This problem is likely due to faulty hardware. Please contact your hardware vendor for further assistance diagnosing the problem.
Log Name: Directory Service
Source: NTDS ISAM
Date: 27. 5. 2013 16:36:34
Event ID: 509
Task Category: Performance
Level: Warning
Keywords: Classic
User: N/A
Computer: xxxxxxxxxxxxxxx
Description:
NTDS (700) NTDSA: A request to read from the file «C:WindowsNTDSntds.dit» at offset 69984256 (0x00000000042be000) for 8192 (0x00002000) bytes succeeded, but took an abnormally long time (23 seconds) to be serviced by the OS. In addition, 0 other I/O requests to this file have also taken an abnormally long time to be serviced since the last message regarding this problem was posted 0 seconds ago. This problem is likely due to faulty hardware. Please contact your hardware vendor for further assistance diagnosing the problem.
Log Name: Directory Service
Source: NTDS ISAM
Date: 27. 5. 2013 16:36:34
Event ID: 508
Task Category: Performance
Level: Warning
Keywords: Classic
User: N/A
Computer: xxxxxxxxxxxxxxxxxx
Description:
NTDS (700) NTDSA: A request to write to the file «C:WindowsNTDSedb.log» at offset 8294400 (0x00000000007e9000) for 4096 (0x00001000) bytes succeeded, but took an abnormally long time (32 seconds) to be serviced by the OS. This problem is likely due to faulty hardware. Please contact your hardware vendor for further assistance diagnosing the problem.
Log Name: Application
Source: ESENT
Date: 27. 5. 2013 16:50:02
Event ID: 531
Task Category: Database Page Cache
Level: Warning
Keywords: Classic
User: N/A
Computer: xxxxxxxxxxxxxxxxxxxxx
Description:
lsass (700) The database engine attempted a clean write operation on page 8542 of database C:WindowsNTDSntds.dit. This action was performed in an attempt to correct a previous problem reading from the page.
I try now sematic database analysis and send result about few minutes.
- Remove From My Forums
-
Question
-
I am having some issue with azure diagnostics, every time that windows try to write into svc.log my machine crash.
This happened every time that I start SQL Management Studio. I am getting this error
svchost (1932) A request to write to the file «C:Windowssystem32LogFilesSumSvc.log» at offset 1597440 (0x0000000000186000) for 4096 (0x00001000) bytes succeeded, but took an abnormally long time (20 seconds) to be serviced by the OS. In addition,
0 other I/O requests to this file have also taken an abnormally long time to be serviced since the last message regarding this problem was posted 63 seconds ago. This problem is likely due to faulty hardware. Please contact your hardware vendor for further
assistance diagnosing the problem.svchost (1932) A request to write to the file «C:Windowssystem32LogFilesSumSvc.log» at offset 1589248 (0x0000000000184000) for 4096 (0x00001000) bytes succeeded, but took an abnormally long time (15 seconds) to be serviced by the OS. This
problem is likely due to faulty hardware. Please contact your hardware vendor for further assistance diagnosing the problem.-
Edited by
Thursday, June 1, 2017 10:32 PM
-
Edited by
Hi
I’ve had an on going problem which doesn’t seem to have a complete answer anywhere, recently we have had a new print server that’s windows server 2012 r2 on a hyper-v server.
Now before this server was installed there were no problems, however now every so often this server as well as all other servers which are on the hyper v will lock up, are still running but rdping in or any form of work
from them isn’t possible).
The print server if someone is printing stuff at the time will stop and wont do anything till it calms down (which is normally 5-10 minutes). For obvious reasons this has to be resolved as it stops the dc, the file server
and the print server from working and can’t be very bad at peak hours. Now when the server finally calms down and am able to see the event logs i get these error messages
svchost (2652) A request to write to the file «C:Windowssystem32LogFilesSumSvc.log» at offset 5144576 (0x00000000004e8000) for 4096 (0x00001000) bytes has not completed for 36 second(s). This problem is likely due to faulty hardware. Please
contact your hardware vendor for further assistance diagnosing the problem.
svchost (2652) A request to write to the file «C:Windowssystem32LogFilesSumSvc.log» at offset 5144576 (0x00000000004e8000) for 4096 (0x00001000) bytes succeeded, but took an abnormally long time (723 seconds) to be serviced by the OS. This
problem is likely due to faulty hardware. Please contact your hardware vendor for further assistance diagnosing the problem.
Now i’ve used process monitor and explorer to see what this svc controls and it looks like its svchost.exe network restricted process that has in it’s container the items below
distributed link tracking client
hyper-v data excahnge service
hyper-v guest shutdown service
hyper-v volume shadow copy requestor
remote desktop services usermode port redirector
smart card device enumeration service
user access logging service
Now is the print server getting too much information at one point or something along those lines i don’t know, any help would be appreciated as this is driving me up the wall. Also to note we have this hyper-v and one other on another server and that one
does experience this problem.
0
Svchost.exe is creating the log file as svc.log in the path «c:windowssystem32logfilessum». How to read them and see the content inside the log files. I tried with notepad, notepad++ (used different encoding) and Microsoft service trace viewer, nothing helped.
I am seeing junk characters only. What is the file format of this log file and which tool I can use to open and read them.
- svchost
Improve this question
asked Oct 19, 2022 at 15:35
![]()
Vijay VasudevanVijay Vasudevan
11 bronze badge
Add a comment
|
Sorted by:
Reset to default
Your Answer
Sign up or log in
Sign up using Google
Sign up using Facebook
Sign up using Email and Password
Post as a guest
Name
Required, but never shown
By clicking “Post Your Answer”, you agree to our terms of service, privacy policy and cookie policy
Browse other questions tagged
- svchost
or ask your own question.
Browse other questions tagged
- svchost
or ask your own question.
Обновлено 18.08.2016

Как решается ошибка 490, ошибка 455, ошибка 489 в Windows Server 2012 R2-01
Всем привет сегодня расскажу как решается ошибка 490, ошибка 455, ошибка 489 в Windows Server 2012 R2. По сути каждая их этих ошибок сводится к одному решению. Давайте более детально рассмотрим текст ошибок.
Код события 455: sqlservr (5216) Ошибка -1032 (0xfffffbf8) при открытии файла журнала C:Windowssystem32LogFilesSumApi.log
Код события 489: sqlservr (5216) Не удалось открыть файл «C:Windowssystem32LogFilesSumApi.log» только для чтения, системная ошибка 5 (0x00000005): «Отказано в доступе. «. Операция открытия файла не будет выполнена, ошибка: -1032 (0xfffffbf8).
Код события 490: sqlservr (5216) Не удалось открыть файл «C:Windowssystem32LogFilesSumApi.chk» для чтения и записи, системная ошибка 5 (0x00000005): «Отказано в доступе. «. Операция открытия файла не будет выполнена, ошибка: -1032 (0xfffffbf8).
Вот скриншоты данных ошибок.
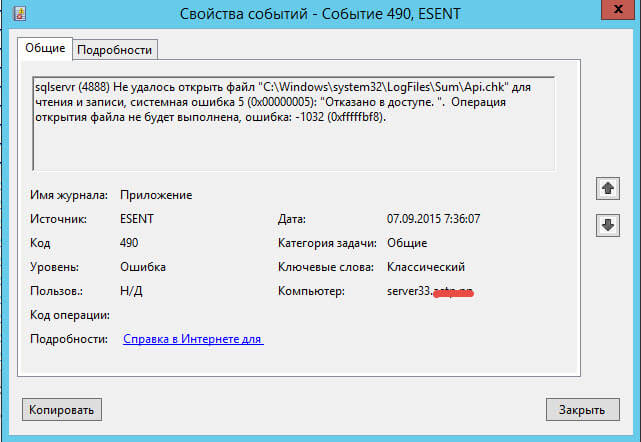
Как решается ошибка 490, ошибка 455, ошибка 489 в Windows Server 2012 R2-02
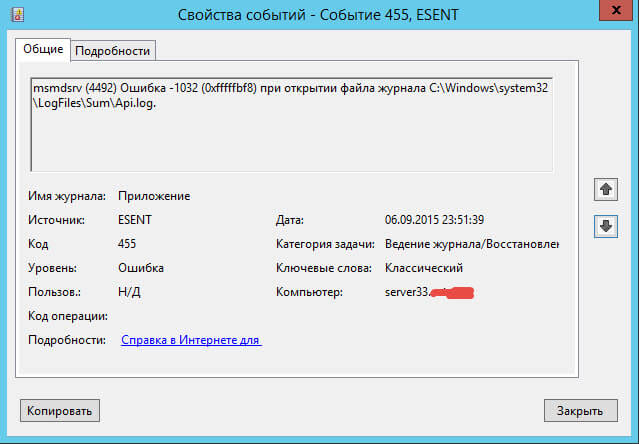
Как решается ошибка 490, ошибка 455, ошибка 489 в Windows Server 2012 R2-03
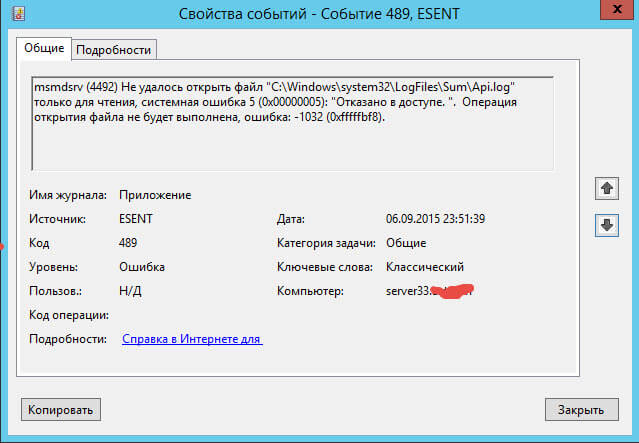
Как решается ошибка 490, ошибка 455, ошибка 489 в Windows Server 2012 R2-04
Видим что в каждом из случаев MS SQL 2012 не может попасть в папку C:Windowssystem32LogFilesSum. Тут два решения отключить UAC для той учетной записи от имени которой запускается Microsoft SQL 2012 и более правильный дать права доступа на данную папку для учетной записи от имени которой запускается сиквел.
Вот так вот просто решается ошибка 490, ошибка 455, ошибка 489 в Windows Server 2012 R2.
Материал сайта pyatilistnik.org
Авг 18, 2016 23:01
Hi there,
Users have complained to me that at about 3:00 every day, our file server slows down and applications hang. I finally found an indicator of this after looking at all scheduled tasks, backup plans, etc.
The Application logs in Event Viewer show every day for the last month at about 3:05pm warning (with one outlier at 5:45am):
Source: Esent
EventID: 508
svchost (5184) A request to write to the file «C:Windowssystem32LogFilesSumSvc.log» at offset 2904064 (0x00000000002c5000) for 4096 (0x00001000) bytes succeeded, but took an abnormally long time (39 seconds) to be serviced by the OS. This problem is likely due to faulty hardware. Please contact your hardware vendor for further assistance diagnosing the problem.
I don’t know if this is exactly it, but it seems like it’s cause for concern. To rule out faulty hardware, I’m going to run a chkdsk after folks head out this evening. Just thinking out loud; my file server partition and the Windows Server 2012 partitions are on the same physical disk (yuck) but I do have a RAID1 setup going, so a bad disk won’t be the end of the world.
I’ve seen some other posts about this being caused by a dead battery on a RAID controller. so I’ll check that out too. I have half a terabyte free on this partition, so it’s not an issue of a full disk.
Any other known culprits of this issue?
Ah, and always the same…
(it has enough free memory/disk space, high performance of CPU)
Yes, but you know what you do not talk of? DISK PERFORMANE.
bytes succeeded, but took an abnormally long time (36 seconds)
An operation on the dis did not take milliseconds, as it should, but 36 SECONDS. You basically got a 40 ton truck and complain it is not as fast as a formula 1 car. Let me guess — super slow and large SATA Hard Disk where everyone using databases either uses dozens of discs or has LOOONG moved to SSD which sort of have 100 times the IO capacity of a high end disc.
There are 4 reasons for this, possibly:
- Defective hardware. Happens, nothing WE can do here. Check on 2nd machine.
- Defect drivers. See first topic.
- AWFUL hardware selection that is totally unsuitable because it does totally NOT provide the IO bandwidth required for the application.
And finally:
- Incompetent database developer that never bothered to learn proper db programming and thus has no idea what an index is, resulting in every query using WAAAAAAYY more IO bandwidth than it should overloading a IO subsystem that otherwise MAY be good enough. Seen that way too often. https://use-the-index-luke.com/ — and yes, «Incompetent» is the friendly way, what would you call a taxi driver that blows up the car when he starts it because he never learned driving


That sort of nails it down. The fact that things happen at the same time and last ONLY half an hour indicates that it is not one of the first 2 items — those happen more random, i.e. not always at the same time.
Start assessing thhe hardware capacity and checking which queries are slow. Then possibly hammer the programmers to actually do their job and add proper indices.