Quick Answer 🔍
How many people use Windows in 2023?
Windows runs on 1.6 billion active devices.
How many people use Windows in 2023?
Clue: a lot!
Admit it or not, we have all used Windows. In fact, the majority of us are still keeping the tradition until now.
While we do not get the nostalgic Windows opening salvo as we used to in the early 2000s, Microsoft’s operating systems have remained a reliable service provider over the years.
It has prevented billions of computers from going bonkers since its launch in 1985.
This explains why, despite many years gone, Windows still dominates the overall operating system market.
How Many People Use Windows in 2023?
 1")
Exactly how many people use Windows in 2023? In January 2022, Microsoft announced having 1.4 billion active devices running on Windows 10 and 11 monthly.
In the middle of 2020, the company successfully migrated about 80% of its customers to Windows’ newer version, particularly Windows 10.
On the other hand, there are still an estimated 200 million devices globally that are running on the earlier versions of Windows, most of these are reported to be using Windows 7.
This means Windows, new versions and otherwise, run on more or less 1.6 billion devices around the world.
It maintains a stronghold in the overall operating system market share which it dominated since its entrance in the 1980s.
Windows Operating Systems and their Penetration Rates
 2")
Windows operating systems’ penetration rates changed significantly over the years.
Take a look at this data detailing the rate of change in the period covering December 2015 to December 2019, as publicized by the US Digital Analytics Program.
Windows Vista/XP
- December 2015 – 5.9% of PCs run on this operating system during the period
- June 2017 – 2.3% of PCs run on this operating system during the period
- June 2018 – 1.3% of PCs run on this operating system during the period
- June 2019 – 0.7% of PCs run on this operating system during the period
- December 2019 – 0.6% of PCs run on this operating system during the period
Windows 8.x
- December 2015 – 14.7% of PCs run on this operating system during the period
- June 2017 – 7.4% of PCs run on this operating system during the period
- June 2018 – 5.9% of PCs run on this operating system during the period
- June 2019 – 4.9% of PCs run on this operating system during the period
- December 2019 – 4.6% of PCs run on this operating system during the period
Windows 7
- December 2015 – 64.2% of PCs run on this operating system during the period
- June 2017 – 51.8% of PCs run on this operating system during the period
- June 2018 – 39.4% of PCs run on this operating system during the period
- June 2019 – 26.0% of PCs run on this operating system during the period
- December 2019 – 18.9% of PCs run on this operating system during the period
Windows 10
- December 2015 – 15.3% of PCs run on this operating system during the period
- June 2017 – 38.6% of PCs run on this operating system during the period
- June 2018 – 53.4% of PCs run on this operating system during the period
- June 2019 – 68.4% of PCs run on this operating system during the period
- December 2019 – 75.8% of PCs run on this operating system during the period
By December 2019, 75.8% of all PCs running on Windows operating is using the then latest version, Windows 10.
During the same period, 18.9% are still on Windows 7, while only 0.6% of the total are using Windows Vista/XP.
Windows’ share in the operating systems market diminished from where it was nine years ago.
During the start of 2013, the Microsoft-owned enterprise captured 90.96% of the total market, making it a clear winner against its then only significant competitor, macOS, which held only 8% of the total.
Today, Windows is still the strongman in the operating systems market. Albeit, at an overly reduced market share from 2013 figures.
Below is the scene on the global operating systems market share as of June 2022.
- Windows – holds 76.33% of the global OS market
- macOS – holds 14.64% of the global OS market
- Linux – holds 2.42% of the global OS market
- Chrome – holds 1.71% of the global OS market
- Other service providers – unnamed/undetermined companies hold 4.82% of the global OS market
A Retrospect on Windows and its Beginnings
An operating system is software installed in a computer or any other type of computer-powered device that manages its host’s memory, storage, and processing capacity.
Windows 1.0 is Microsoft’s earliest OS, released in 1985. It came with a basic decent OS function such as file storage and running apps, among others.
It also featured some of the apps that still run on the latest Windows versions we have today namely Paint, Calculator, and Notepad.
By 1990, Microsoft has innovated and released Windows 3.0—the third installment on the company’s OS roster that features file and software icons for the first time.
These icons have been carried on until this day.
Windows in the New Millennium to Windows 11
 3")
Credits: unsplash.com
During the start of the new millennium, Windows XP has been made available to the public.
This Windows OS enjoyed international success and massive adoption, which explains why its new version did not come until 2007.
In October 2021, Windows marked a beginning of a new chapter with the introduction of Windows 11.
Aside from the upgrades on design and interface, this new OS version came with a Widgets taskbar button that makes app access easier for users. The latest data shows that 1.44% of PCs globally are now running on Windows 11.
Conclusion
There is no question about Microsoft’s dominance in the PC operating systems market since Windows 1’s entrance in 1985.
It consistently left macOS with a meager share, keeping it limited to having only 14.64% of the total.
But the company has obviously failed to spot an opportunity in one aspect: smartphones.
Today, Alphabet’s Android which uses Linux Kernel juggles 72% of the total OS market for smartphones. It left the remaining 28% for iOS.
This means that although Apple Inc is not the dominant player on both occasions, it managed to keep its presence steady at the number two spot in the PC and smartphone operating system markets.
Thanks for reading our article about how many people use Windows in 2023.
Sources
| StatCounter | The Win Central | Windows |
| GHacks | My Choice Software | ZDNet |
| TechAdvisor | Windows Latest | Computer Hope |
| Makeuseof | Statista |
Related
In this article, we will discuss How Many People Use Windows 2023?
In 2023, how many people will use Windows?
Clue: a lot!
We’ve all used Windows, whether we’ll admit it or not. In fact, most of us still follow the tradition up to this day.
Microsoft’s operating systems have been reliable over the years, even though we no longer get the nostalgic Windows opening salvo like we did in the early 2000s.
Since it came out in 1985, it has kept billions of computers from going crazy.
This is why, even though many years have passed, Windows is still the most popular operating system.
Windows Now Has 1.4 billion Users in 2023
How many people will use Windows in the year 2022? In January 2022, Microsoft said that Windows 10 and 11 were running on 1.4 billion active devices every month.
About 80% of the company’s customers had moved to a newer version of Windows, especially Windows 10, by the middle of 2020.
On the other hand, there are still about 200 million devices around the world that run on older versions of Windows. Most of these devices are said to be running Windows 7.
This means that Windows, both old and new versions, runs on about 1.6 billion devices all over the world.
It still has a big share of the market for operating systems as a whole, which it has had since the 1980s.
Windows Operating Systems and their Penetration Rates
The number of computers that use Windows has changed a lot over the years.
Check out this information from the US Digital Analytics Program about how fast things are changing from December 2015 to December 2019.
Windows Vista/XP
- December 2015 – This operating system was used by 5.9% of PCs
- June 2017 – This operating system was used by 2.3% of PCs
- June 2018 – This operating system was used by 1.3% of PCs
- June 2019 – This operating system was used by 0.7% of PCs
- December 2019 – This operating system was installed on 0.6% of PCs
Windows 8. x
- December 2015 – This operating system was installed on 14.7% of PCs
- June 2017 – This operating system was used by 7.4% of PCs
- June 2018 – This operating system was installed on 5.9% of PCs
- June 2019 – During this period, 4.9% of PCs are running this operating system
- December 2019 – This operating system was used by 4.6% of PCs
Windows 7
- December 2015 – This operating system was used by 64.2% of PCs
- June 2017 – This operating system was used by 51.8% of PCs
- June 2018 – This operating system was used by 39.4% of PCs
- June 2019 – This operating system is used by 26.0% of PCs
- December 2019 – This operating system is used by 18.9% of PCs
Windows 10
- December 2015 – This operating system was used by 15.3% of PCs
- June 2017 – This operating system is installed on 38.6% of PCs during this time period
- June 2018 – This operating system was used by 53.4% of PCs
- June 2019 – This operating system is used by 68.4% of PCs
- December 2019 – This operating system was used by 75.8% of PCs during this timeframe
By December 2019, 75.8% of all Windows PCs will be running Windows 10, which was the most recent version at the time.
During the same time period, 18.9% of computers are still using Windows 7, while only 0.6% are using Windows Vista or XP.
Global Operating Systems Market Share 2023
Windows’ share of the market for operating systems has gone down since nine years ago.
At the beginning of 2013, the company owned by Microsoft had 90.96% of the total market. This made it a clear winner over its only major competitor at the time, macOS, which only had 8% of the total market.
Windows is still the best operating system on the market right now. Even though their market share is much smaller than it was in 2013.
As of June 2022, the market share of operating systems around the world is shown below.
- Windows – dominates the global operating system market with 76.33%
- macOS – has a global market share of 14.64%
- Linux – is the world’s most popular operating system with a 2.42% market share
- Chrome – dominates the global OS market with 1.71%
- Other service providers – companies that are not named or identified hold 4.82% of the global OS market.
A Retrospect on Windows and its Beginnings
An operating system is a piece of software that is installed on a computer or other device that uses a computer. This software manages the memory, storage, and processing power of its host.
Microsoft’s first OS was Windows 1.0, which came out in 1985. It came with a basic OS that did things like store files and run apps, among other things.
It also had apps like Paint, Calculator, and Notepad, which can still be used on the most recent versions of Windows.
By 1990, Microsoft had come up with new ideas and released Windows 3.0, the third version of the company’s operating system. This was the first version to have icons for files and programs.
These symbols are still around to this day.
Windows In The New Millennium to Windows 11
Windows XP has been available to the public since the start of the new millennium.
This Windows OS was very popular all over the world, which is why its new version didn’t come out until 2007.
When Windows 11 came out in October 2021, it was the start of a new era for the company.
Aside from changes to the design and interface, this new OS version has a Widgets button on the taskbar that makes it easier for users to get to apps. The most recent information shows that 1.44 percent of PCs around the world are now running Windows 11.
Quick Links:
- How Many People Use Expressvpn? (Users Stats)
- How Many People Use Upwork?
- How Many People Use 1password? (Usage Stats)
- How Many People Use Yahoo Mail? (User Stats)
- Social Network Usage Stats: How Many People Would Be Using Social Media?
Conclusion: How Many People Use Windows 2023?
Since Windows 1 came out in 1985, there is no doubt that Microsoft has been the leader in the market for PC operating systems.
It always left macOS with a small share, so it could never have more than 14.64 percent of the total.
But it’s clear that the company has missed a chance in one area: smartphones.
Today, 72% of all smartphone operating systems are Android, which is made by Alphabet and runs on the Linux Kernel. It left iOS with the other 28%.
This means that Apple Inc. has stayed at the number two spot in both the PC operating system market and the smartphone operating system market, even though it is not the market leader.
Thanks for reading our article about how many people will use Windows in 2022.
Sources
| StatCounter | The Win Central | Windows |
| GHacks | My Choice Software | ZDNet |
| TechAdvisor | Windows Latest | Computer Hope |
| Makeuseof | Statista |
The usage share of operating systems is the percentage of computing devices that run each operating system (OS) at any particular time. All such figures are necessarily estimates because data about operating system share is difficult to obtain. There are few reliable primary sources and no agreed methodologies for its collection. Operating systems are used in numerous device types, from embedded devices without a screen through to supercomputers.
Most device types that people interact with access the web, so using web access statistics helps compare the usage share of operating systems across most device types, and also the usage share of operating systems used for the same types.
As of November 2022, Android, an operating system using the Linux kernel, is the world’s most-used operating system when judged by web use. It has 42% of the global market, followed by Windows with 30%, Apple iOS with 18%, macOS with 6%, then (desktop) Linux at 1.0% also using the Linux kernel.[1][2] These numbers do not include embedded devices or game consoles.
- For smartphones and other pocket-sized devices, Android leads with 71% market share, and Apple’s iOS has 28%.[3]
- For desktop and laptop computers, Windows is the most used at 76%, followed by Apple’s macOS at 16%, and Linux-based operating systems at 5% (i.e. «desktop Linux» at 2.6%, plus Google’s ChromeOS at 2.4%, in the US up to 6.2%).[4]
- For tablets, Apple’s iPadOS has 50.7% and Android has 49.18% worldwide[5] (Android is though more used in vast majority of countries;[6] and on occational days Android measures ahead or even, globally[7]).
For the above devices, smartphones and other pocket-sized devices make up 58%, desktops and laptops 40%, and tablets 2.0%.[8] Smartphones have the most use in virtually all countries, including in the US at 51% there with PC operating systems (including Windows) down to 46%.[9][10]
- Linux has completely dominated the supercomputer field since 2017, with all of the top 500 most powerful supercomputers in the world running a Linux distribution. Linux is also most used for (web) servers, and then most often Ubuntu used, the most common Linux distribution.
The most numerous type of device with an operating system are embedded systems. These use varied operating systems; a high percentage are standalone or do not have a web browser, which makes their usage share difficult to measure. Hypothetically some operating systems used in embedded systems are more popular than the ones mentioned above.
Worldwide device shipments[edit]
|
|
This section needs to be updated. Please help update this article to reflect recent events or newly available information. |
In May 2020, Gartner predicted a decline in all market segments for 2020 (from already declining market in 2019) due to COVID-19, predicting a decline by 13.6% for all devices, while «Work from Home Trend Saved PC Market from Collapse», with them only predicting to decline by 10.5% for PCs. However, in the end according to Gartner, PC shipments grew «10.7% in Fourth Quarter of 2020 and […] reached 275 million units in 2020, a 4.8% increase from 2019 and the highest growth in ten years.» Apple in 4th place for PCs had the largest growth in shipments for a company in Q4 of 31.3%, while «the fourth quarter of 2020 was another remarkable period of growth for Chromebooks, with shipments increasing around 200% year over year to reach 11.7 million units. In 2020, Chromebook shipments increased over 80% to total nearly 30 million units, largely due to demand from the North American education market.»[12] Chromebooks sold more than Apple’s Macs worldwide.
According to Gartner, the following is the worldwide device shipments (referring to wholesale) by operating system, which includes smartphones, tablets, laptops and PCs together.
| Source | Year | Android | iOS/macOS | Windows | Others |
|---|---|---|---|---|---|
| Gartner[13] | 2019 (2.161 bln) | ||||
| Gartner[14] | 2017 (2.278 bln) | ||||
| Gartner[15] | 2016 (2.332 bln) | 10.63% (248 mln) | 11.2% (260 mln) | ||
| Gartner[11] | 2015 (2.4 bln) | 54.16% (1.3 bln) | 12.37% (297 mln)
macOS = 1% |
11.79% (283 mln) | 21.66% |
| Gartner[16] | 2014 | 48.61% | 11.04% | 14.0% | 26.34% |
| Gartner[17] | 2013 | 38.51% | 10.12% | 13.98% | 37.41% |
| Gartner[18] | 2012 | 22.8% | 9.6% | 15.62% | 51.98% |
Shipments (to stores) do not mean sales to consumers (not necessarily in the year of shipment), therefore suggesting the numbers indicate popularity and/or usage could be misleading. Not only do smartphones sell in higher numbers than traditional PCs – but also as a whole a lot more, by dollar value – with the gap only projected to widen, to well over double.[19]
For 2015 (and earlier), Gartner reports for «the year, worldwide PC shipments declined for the fourth consecutive year, which started in 2012 with the launch of tablets» with an 8% decline in PC sales for 2015 (not including cumulative decline in sales over the previous years).[20] Gartner includes Macs (running macOS) in PC sales numbers (but not e.g. iPads and Androids), and they individually had a slight increase in sales in 2015.
On 28 May 2015, Google announced that there were 1.4 billion Android users and 1 billion Google play users active during that month.[21][22] This changed to 2 billion monthly active users in May 2017.[23][24]
On 27 January 2016, Paul Thurrott summarized the operating system market, the day after Apple announced «one billion devices»:
Apple’s «active installed base» is now one billion devices. [..] Granted, some of those Apple devices were probably sold into the market place years ago. But that 1 billion figure can and should be compared to the numbers Microsoft touts for Windows 10 (200 million, most recently) or Windows more generally (1.5 billion active users, a number that hasn’t moved, magically, in years), and that Google touts for Android (over 1.4 billion, as of September).
My understanding of iOS is that the user base was previously thought to be around 800 million strong, and when you factor out Macs and other non-iOS Apple devices, that’s probably about right. But as you can see, there are three big personal computing platforms.— Paul Thurrott[25]
Microsoft backed away from their goal of one billion Windows 10 devices in three years (or «by the middle of 2018»)[26] and reported on 26 September 2016 that Windows 10 was running on over 400 million devices,[27] and in March 2019 on more than 800 million.[28]
By late 2016, Android had been explained to be «killing» Apple’s iOS market share (i.e. its declining sales of smartphones, not just relatively but also by number of units, when the whole market is increasing) with
the gap between the two is growing ever larger all the time.
According to Gartner, Android now boasts a global market share of 86.2 percent. Apple’s iOS is a long way behind with a market share of just 12.9 percent. The rest may as well not even exist [..]
These figures, which cover the second quarter of 2016, show that Android has actually increased its market share by 4 percent over the last year. All other operating systems are down, with iOS losing 1.7 percent [..]
I think it’s fair to declare Android the winner in the mobile operating [system] wars at this point.
— makeuseof.com[29]
As of 9 May 2019, the biggest smartphone companies (by market share) were Samsung, Huawei and Apple, respectively.[30]
Gartner’s own press release said, «Apple continued its downward trend with a decline of 7.7 percent in the second quarter of 2016»,[31] which is their decline, based on absolute number of units, that underestimates the relative decline (with the market increasing), along with the misleading «1.7 percent [point]» decline. That point decline means an 11.6% relative decline (from 14.6% down to 12.9%).
Although in units sold Apple is declining, they are almost the only vendor making any profit in the smartphone sector from hardware sales alone. In Q3 2016 for example, they captured 103.6% of the market profits.[32]
There are more mobile phone owners than toothbrush owners,[33] with mobile phones the fastest growing technology in history.[citation needed] There are a billion more active mobile phones in the world than people (and many more than 10 billion sold so far with less than half still in use), explained by the fact that some people have more than one, such as an extra for work.[34] All the phones have an operating system, but only a fraction of them are smartphones with an OS capable of running modern applications. Currently 3.1 billion smartphones and tablets are in use across the world (with tablets, a small fraction of the total, generally running the same operating systems, Android or iOS, the latter being more popular on tablets. In 2019, a variant of iOS called iPadOS built for iPad tablets was released).
Tablet computers shipments[edit]
In 2015, eMarketer estimated at the beginning of the year that the tablet installed base would hit one billion[35] for the first time (with China’s use at 328 million, which Google Play doesn’t serve or track, and the United States’s use second at 156 million). At the end of the year, because of cheap tablets – not counted by all analysts – that goal was met (even excluding cumulative sales of previous years) as:
Sales quintupled to an expected 1 billion units worldwide this year, from 216 million units in 2014, according to projections from the Envisioneering Group.
While that number is far higher than the 200-plus million units globally projected by research firms IDC, Gartner and Forrester, Envisioneering analyst Richard Doherty says the rival estimates miss all the cheap Asian knockoff tablets that have been churning off assembly lines.[..]
Forrester says its definition of tablets «is relatively narrow» while IDC says it includes some tablets by Amazon — but not all.[..]
The top tech purchase of the year continued to be the smartphone, with an expected 1.5 billion sold worldwide, according to projections from researcher IDC. Last year saw some 1.2 billion sold.[..]
Computers didn’t fare as well, despite the introduction of Microsoft’s latest software upgrade, Windows 10, and the expected but not realized bump it would provide for consumers looking to skip the upgrade and just get a new computer instead.
Some 281 million PCs were expected to be sold, according to IDC, down from 308 million in 2014. Folks tend to be happy with the older computers and keep them for longer, as more of our daily computing activities have moved to the smartphone.[..]
While Windows 10 got good reviews from tech critics, only 11% of the 1-billion-plus Windows user base opted to do the upgrade, according to Microsoft. This suggests Microsoft has a ways to go before the software gets «hit» status. Apple’s new operating system El Capitan has been downloaded by 25% of Apple’s user base, according to Apple.
This conflicts with statistics from IDC that say the tablet market contracted by 10% in 2015 with only Huawei, ranked fifth, with big gains, more than doubling their share; for fourth quarter 2015, the five biggest vendors were the same except that Amazon Fire tablets ranked third worldwide, new on the list, enabled by its not quite tripling of market share to 7.9%, with its Fire OS Android-derivative.[37]
| Source | Year | Android | iOS | Windows | Others |
|---|---|---|---|---|---|
| Strategy Analytics[38] | Q2 2022 | 49% | 38% | 11% | 2% |
| Statista[39] | 2020 | 59.4% | 29.8% | 10.21% | 0.59% |
| Strategy Analytics[40] | 2015 | 68% | 22% | 10% | <0.1% |
| Gartner[41] | 2013 | 61.9% | 36.0% | 2.1% | <0.1% |
| Gartner[41] | 2012 | 45.8% | 52.8% | 1.0% | 0.3% |
Gartner excludes some devices from their tablet shipment statistic and includes them in a different category called «premium ultramobiles» with screen sizes of more than 10″ inches.[42]
Smartphone shipments[edit]
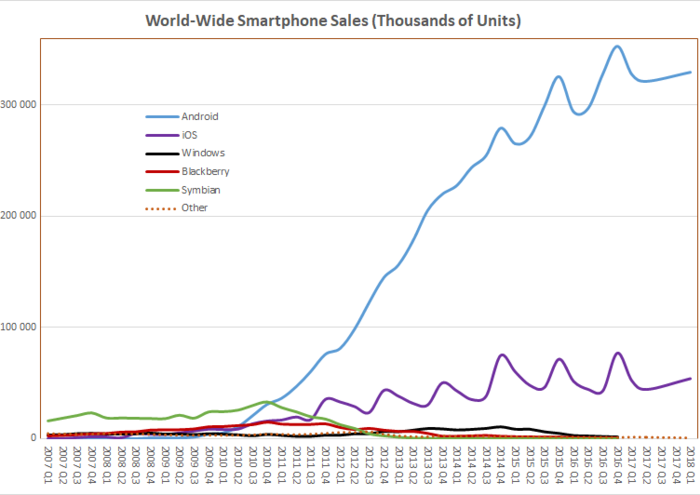
Worldwide smartphone sales to end users by operating systems, as measured by Gartner, International Data Corporation (IDG) and others:
| Source | Method | Quarter/month | Android (including forks) |
iOS | Windows (all versions) |
BlackBerry (all versions) |
Symbian | Others |
|---|---|---|---|---|---|---|---|---|
| Statista[43] | based on page views per month worldwide | 2022 Q4 | 71.1% | 28.3% | N/A | N/A | N/A | 0.6% |
| Gartner[44] | Units sold in quarter | 2018 Q1 | 85.9% | 14.1% | N/A | N/A | N/A | 0.0% |
| Gartner[45] | Units sold per year | 2017 | 85.9% | 14.0% | N/A | N/A | N/A | 0.1% |
| Gartner[46] | Units sold in quarter | 2017 Q1 | 86.1% | 13.7% | N/A | N/A | N/A | 0.2% |
| Gartner[47] | Units sold per year | 2016 | 84.8% | 14.4% | N/A | N/A | N/A | 0.8% |
| Gartner[48] | Units sold in quarter | 2016 Q4 | 81.7% | 17.9% | 0.3% | 0.0% | N/A | 0.1% |
| Gartner[49] | Units sold in quarter | 2016 Q3 | 87.8% | 11.5% | 0.4% | 0.1% | N/A | 0.2% |
| Gartner[50] | Units sold in quarter | 2016 Q2 | 86.2% | 12.9% | 0.6% | 0.1% | N/A | 0.2% |
| Gartner[51] | Units sold in quarter | 2016 Q1 | 84.1% | 14.8% | 0.7% | 0.2% | N/A | 0.2% |
| Gartner[52] | Units sold in quarter | 2015 Q4 | 80.7% | 17.7% | 1.1% | 0.2% | N/A | 0.2% |
| Gartner[53] | Units sold in quarter | 2015 Q2 | 82.2% | 14.6% | 2.5% | 0.3% | N/A | 0.4% |
| Gartner[54] | Units sold in quarter | 2014 Q4 | 76.0% | 20.4% | 2.8% | 0.5% | N/A | 0.4% |
| Strategy Analytics[55] | Units shipped in quarter | 2014 Q3 | 81.3% | 13.4% | 4.1% | 1.0% | N/A | 0.2% |
| Gartner[56] | Units sold in quarter | 2014 Q2 | 83.8% | 12.2% | 2.8% | 0.7% | N/A | 0.5% |
| Gartner[57] | Units sold in quarter | 2013 Q2 | 79.0% | 14.2% | 3.3% | 2.7% | 0.3% | 0.6% |
| Gartner[58] | Units sold in quarter | 2013 Q1 | 74.4% | 18.2% | 2.9% | 3.0% | 0.6% | 1.0% |
| International Data Corporation[59] | Units shipped in quarter | 2013 Q1 | 75.0% | 17.3% | 3.2% | 2.9% | 0.6% | 0.0% |
Web clients[edit]
|
|
This section needs to be updated. Please help update this article to reflect recent events or newly available information. |
| Web clients’ OS family statistics | ||
|---|---|---|
| Android (or based on) | 42.67% | |
| Windows | 29.56% | |
| Apple’s iOS | 17.38% | |
| Apple’s macOS | 6.07% | |
| Unknown | 2.04% | |
| Other | 1.25% | |
| Linux | 0.98% | |
| Web clients’ OS family market share according to StatCounter for April 2022.[60] The information on web clients is obtained from user agent information obtained through JavaScript code run by web browsers supplied to web servers. «Unknown» is probably mostly Windows operating systems.[citation needed] These figures have a large margin of error for a variety of reasons. For a discussion on the shortcomings see usage share of web browsers. |
The most recent data from various sources published during the last twelve months is summarized in the table below. All of these sources monitor a substantial number of web sites; statistics related to one web site only are excluded.
Android currently ranks highest,[61] above Windows (incl. Xbox console) systems. Windows Phone accounted for 0.51% of the web usage, before it was discontinued.[62]
Considering all personal computing devices, Microsoft Windows is well below 50% usage share on every continent, and at 30% in the US (24% single-day low) and in many countries lower, e.g. China, and in India at 19% (12% some days) and Windows’ lowest share globally was 29% in May 2022 (25% some days), and 29% in the US.[63]
iOS is slightly more popular than Windows in the US, and has been more used the last 6 months, on a monthly average basis,[64] or for up to 11 weeks in a row (weekly average).[65] That’s because it’s much more popular on the weekends, while Windows usually more used on weekdays. iOS has however been more used for up to almost 2 weeks, every day of that time-span, and even on some days, such as 29 May 2022, Android is also more used than Windows meaning iOS and Android are up to 2.6× more used than Windows there.[66] Worldwide, Android at 43.23% is 48% more used than Windows, next at 29.2%, and iOS third at 17.67% meaning the mobile operating systems Android and iOS are combined a bit over 2× more popular then Windows. In Africa, Android at 62.66% (for May alone is 3.3× (almost 4× with iOS) than Windows at 18.81 (and iOS third at 10.74%).[67] For a 12-month average Android is only 2.1× more popular than Windows in Africa.
Before iOS became the most popular operating system in any independent country, it was most popular in Guam, an unincorporated territory of the United States, for four consecutive quarters in 2017-18,[68][69] although Android is now the most popular there.[70] iOS has been the highest ranked OS in Jersey (a British Crown dependency in Europe) for years, by a wide margin, and iOS was also highest ranked in Falkland Islands, a British Overseas Territory, for one quarter in 2019, before being overtaken by Android in the following quarter.[71][72] iOS is competitive with Windows in Sweden, where some days it is more used.[73]
The designation of an «Unknown» operating system is strangely high in a few countries such as Madagascar where it was at 32.44% (no longer near as high).[74] This may be due to the fact that StatCounter uses browser detection to get OS statistics, and there the most common browsers are not often used. The version breakdown for browsers in Madagascar shows «Other» at 34.9%,[75] and Opera Mini 4.4 is the most popular known browser at 22.1% (plus e.g. 3.34% for Opera 7.6). However browser statistics without version-breakdown has Opera at 48.11% with the «Other» category very small.[76][clarification needed]
In China, Android got to be the highest ranked operating system in July 2016 (Windows has occasionally topped it since then, while since April 2016 it or all non-mobile operating systems haven’t outranked mobile operating systems, meaning Android plus iOS).[77] In the Asian continent as a whole, Android has been ranked highest since February 2016 and Android alone has the majority share,[78] because of a large majority in all the most populous countries of the continent, up to 84% in Bangladesh, where it has had over 70% share for over four years.[79] Since August 2015, Android is ranked first, at 48.36% in May 2016, in the African continent – when it took a big jump ahead of Windows 7,[80] and thereby Africa joined Asia as a mobile-majority continent. China is no longer a desktop-majority country,[81] joining India, which has a mobile-majority of 71%, confirming Asia’s significant mobile-majority.
Online usage of Linux kernel derivatives (Android + ChromeOS + other Linux) exceeds that of Windows. This has been true since some time between January and April 2016, according to W3Counter[82] and StatCounter.[83]
However, even before that, the figure for all Unix-like OSes, including those from Apple, was higher than that for Windows.
| Source | Date | Microsoft Windows (kernel): |
Apple Darwin: |
Linux kernel: |
Others:[b] | |||||||||
|---|---|---|---|---|---|---|---|---|---|---|---|---|---|---|
| 10 | 8/8.1 | 7 | Vista | XP | WP&RT | Other | macOS | iOS | Linux | Android | Other | |||
| W3Counter[84] | Oct 2022 | N/A | N/A | N/A | N/A | N/A | N/A | N/A | N/A | |||||
| W3Counter[85] | Oct
2020 |
20.55% |
N/A | 6.74% |
N/A | N/A | N/A | N/A | 8.06% |
13.67% |
N/A | 37.44% |
N/A | N/A |
| W3Counter[86] | Jun 2019 | N/A | N/A | N/A | N/A | N/A | N/A | N/A | N/A | |||||
| W3Counter[86] | Jun 2018 | N/A | N/A | N/A | N/A | N/A | N/A | N/A | N/A | |||||
| W3Counter[87] | Dec 2016 | N/A | N/A | N/A | N/A | N/A | ||||||||
| StatCounter Global Stats[88] | Mar 2017 | 0% | ||||||||||||
| StatCounter Global Stats[88] | Dec 2016 | |||||||||||||
| StatCounter Global Stats[89] | Oct 2016 | |||||||||||||
| StatCounter Global Stats[90] | May 2016 | |||||||||||||
| StatCounter Global Stats[90] | Dec 2015 | |||||||||||||
| Wikimedia[91] | Dec 2016 | 14.0% | 4.65% | 18.0% | 0.43% | 1.70% | 0.93% | 0.50% | 5.4% | 19.0% | 0.80% | 23.0% | 0.30% | 11.29% |
Desktop and laptop computers[edit]
|
|
This section needs to be updated. Please help update this article to reflect recent events or newly available information. |
Windows is still the dominant desktop OS, but the dominance varies by region and it has gradually lost market share to other desktop operating systems (not just to mobile) with the slide very noticeable in the US, where macOS usage has more than quadrupled from Jan. 2009 to Dec. 2020 to 30.62% (i.e. in Christmas month; and 34.72% in April 2020 in the middle of COVID-19, and iOS was more popular overall that year;[93] globally Windows lost to Android that year,[94] as for the two years prior), with Windows down to 61.136% and ChromeOS at 5.46%, plus traditional Linux at 1.73%.[95]
There is little openly published information on the device shipments of desktop and laptop computers. Gartner publishes estimates, but the way the estimates are calculated is not openly published. Another source of market share of various operating systems is StatCounter[96] basing its estimate on web use (although this may not be very accurate). Also, sales may overstate usage. Most computers are sold with a pre-installed operating system, with some users replacing that OS with a different one due to personal preference, or installing another OS alongside it and using both. Conversely, sales underestimate usage by not counting unauthorized copies. For example, in 2009, approximately 80% of software sold in China consisted of illegitimate copies.[97] In 2007, the statistics from an automated update of IE7 for registered Windows computers differed with the observed web browser share, leading one writer to estimate that 25–35% of all Windows XP installations were unlicensed.[98]
The usage share of Microsoft’s (then latest operating system) Windows 10 has slowly increased since July/August 2016, reaching around 27.15% (of all Windows versions, not all desktop or all operating systems) in December 2016. It eventually reached 79.79% on 5 October 2021, the same day on which its successor Windows 11 was released.
Web analysis shows significant variation in different parts of the world. For example, macOS use varies a lot by region, in North America claims 16.82%[99] (17.52%[100] in the US) whereas in Asia it is only 4.4%.[101] In the United States usage of Windows XP has dropped to 0.38% (of all Windows versions), and its global average to 0.59%, while in Africa it is still at 2.71%, and it still has double-digit share in at least one country.[102]
Since mid-2020, the world uses smartphones more than desktop (including laptop) computers.[103][104][105] For global statistics it’s every day of the week. It has also happened for all individual continents (at least for some weeks, and also for the United States[106][107][108][109] where the smartphone share has gone up to 54%, both on July 9, 2019, a Sunday,[110] and also that high in 2021). The proportions do vary widely by region (more so than by the day), e.g. in Africa the smartphone share is highest at 69%, in Asia at 65% and in South America at 50.19%, while in the United States it’s at 46% and desktop at 50%. On some continents, e.g. North America and the US, smartphone use may only go over 50% on weekends, since smartphones usage increases on weekends,[111][112][113][114] while the smartphone share has gone up to 54% for a single day (Thanksgiving), and on average over 50% for full week.[115][116]
Smartphones (58.01%)
Desktops/Laptops (39.49%)
Tablets (2.46%)
Console (0.06%)
The 2019 Stack Overflow developer survey provides no detail about particular versions of Windows. The desktop operating system share among those identifying as professional developers was:[117]
- Windows: 45.3%
- macOS: 29.2%
- Linux: 25.3%
- BSD/Unix: 0.1%
Microsoft data on Windows usage[edit]
In June 2016, Microsoft claimed Windows 10 had half the market share of all Windows installations in the US and UK, as quoted by BetaNews:
Microsoft’s Windows trends page [shows] Windows 10 hit 50 percent in the US (51 percent in the UK, 39 percent globally), while … Windows 7 was on 38 percent (36 percent in the UK, 46 percent globally).
A big reason for the difference in numbers comes down to how they are recorded. … actual OS usage (based on web browsing), while Microsoft records the number of devices Windows 10 is installed on. … Microsoft also only records Windows 7, Windows 8, Windows 8.1 and Windows 10, while NetMarketShare includes both XP and Vista.— BetaNews[118]
Desktop computer games[edit]
The digital video game distribution platform Steam publishes a monthly «Hardware & Software Survey», with the statistics below:
| Month | Microsoft Windows | Mac OS† | Linux† | Other |
|---|---|---|---|---|
| December 2022[119] | 96.15% | 2.48% | 1.38% | |
| December 2021 | 96.19% | 2.70% | 1.11% | |
| December 2020[119] | 96.41% | 2.82% | 0.78% | |
| December 2019[120] | 96.89% | 2.47% | 0.67% | |
| January 2019[121] | 95.92% | 3.27% | 0.82% | |
| January 2018[122] | 98.38% | 1.31% | 0.25% | |
| January 2017[123] | 95.79% | 3.31% | 0.80% | |
| January 2016[124] | 95.39% | 3.55% | 0.95% | |
| January 2015[125] | 95.48% | 3.32% | 1.09% | |
| January 2014[126] | 94.93% | 3.47% | 0.86% | 0.74% |
^† These figures, as reported by Steam, do not include SteamOS statistics.[127]
Mobile devices[edit]
Smartphones OS by usage[edit]

By Q1 2018, mobile operating systems on smartphones included Google’s dominant Android (and variants) and Apple’s iOS which combined had an almost 100% market share.[128]
Smartphone penetration vs. desktop use differs substantially by country. Some countries, like Russia, still have smartphone use as low as 22.35% (as a fraction of all web use),[129] but in most western countries, smartphone use is close to 50% of all web use. This doesn’t mean that only half of the population has a smartphone, could mean almost all have, just that other platforms have about equal use. Smartphone usage share in developing countries is much higher – in Bangladesh, for example, Android smartphones had up to 84% and currently 70% share,[79] and in Mali smartphones had over 90% (up to 95%) share for almost two years.[130][131] (A section below has more information on regional trends on the move to smartphones.)
There is a clear correlation between the GDP per capita of a country and that country’s respective smartphone OS market share, with users in the richest countries being much more likely to choose Apple’s iPhone, with Google’s Android being predominant elsewhere.[132][133][134]
| Source | Method | Quarter/month | Android (including forks) |
iOS | Windows (all versions) |
BlackBerry (all versions) |
Symbian | Others |
|---|---|---|---|---|---|---|---|---|
| StatCounter Global Stats[135] | Browsing (page view) | 2021, Oct | 71.09% | 28.21% | 0.01% | N/A | N/A | 0.69% |
| StatCounter Global Stats[136] | Browsing (page view) | 2020, Oct | 72.93% | 26.53% | 0.03% | N/A | N/A | 0.51% |
| StatCounter Global Stats | Browsing (page view) | 2019, Sep | 76.24% | 22.48% | 0.17% | 0.02% | 0.02% | 1.07% |
| StatCounter Global Stats[137] | Browsing (page view) | 2015, Mar | 61.94% | 22.64% | 2.27% | NA | 6.00% | 7.09% |
| StatCounter Global Stats[137] | Browsing (page view) | 2014, Aug | 54.87% | 23.57% | 2.36% | 1.59% | 9.73% | 7.87% |
| StatCounter Global Stats[137] | Browsing (page view) | 2014, Feb | 47.57% | 22.97% | 2.22% | 2.62% | 14.86% | 6.08% |
| Wikimedia (includes tablets)[d] | Browsing (page view) | 2013, Mar | 25.93% | 66.53% | 1.85% | 2.02% | 3.03% | 1.12% |
| Source | Method | Quarter/month | Android (including forks) |
iOS | Windows (all versions) |
BlackBerry (all versions) |
Symbian | Others |
|---|---|---|---|---|---|---|---|---|
| comScore[138] (US only) | US subscribers | 2017, Jan | 52.0% | 43.9% | 1.5% | 0.5% | N/A | N/A |
| comScore[139] (US only) | US subscribers | 2016, Jan | 52.8% | 43.6% | 2.7% | 0.8% | N/A | N/A |
| comScore[140] (US only) | US subscribers | 2015, Jan | 53.2% | 41.3% | 3.6% | 1.8% | 0.1% | N/A |
| comScore[141] (US only) | US subscribers | 2014, Jan | 51.7% | 41.6% | 3.2% | 3.1% | 0.2% | N/A |
| comScore[142] (US only) | US subscribers | 2012, Feb | 50.1% | 30.2% | 3.9% | 13.4% | 1.5% | N/A |
| comScore[143] (US only) | US subscribers | 2010, Dec | 28.7% | 25.0% | 8.4% | 31.6% | N/A | 3.7% |
Tablet computers OS by usage[edit]
|
|
This section needs to be updated. Please help update this article to reflect recent events or newly available information. |
Tablet computers, or simply tablets, became a significant OS market share category starting with Apple’s iPad. In Q1 2018, iOS had 65.03% market share and Android had 34.58% market share.[144] Windows tablets may not get classified as such by some analysts, and thus barely register; e.g. 2-in-1 PCs may get classified as «desktops», not tablets.
Since 2016, in South America (and Cuba[145] in North America), Android tablets have gained majority,[146] and in Asia in 2017 Android was slightly more popular than the iPad, which was at 49.05% usage share in October 2015.[147][148][149] In Africa, Android tablets are much more popular while elsewhere the iPad has a safe margin.
As of March 2015, Android has made steady gains to becoming the most popular tablet operating system:[150] that is the trend in many countries, having already gained the majority in large countries (India at 63.25%,[151] and in Indonesia at 62.22%[152]) and in the African continent with Android at 62.22% (first to gain Android majority in late 2014),[153] with steady gains from 20.98% in August 2012[154] (Egypt at 62.37%,[155] Zimbabwe at 62.04%[155]), and South America at 51.09% in July 2015.[156] (Peru at 52.96%[157]). Asia is at 46%.[158] In Nepal, Android gained majority lead in November 2014 but lost it down to 41.35% with iOS at 56.51%.[159] In Taiwan, as of October 2016, Android after having gained a confident majority, has been on a losing streak.[160] China is a major exception to Android gaining market share in Asia (there Android phablets are much more popular than Android tablets, while similar devices get classified as smartphones) where the iPad/iOS is at 82.84% in March 2015.[161]
| Source | Month | iOS | Android | Windows | Others |
|---|---|---|---|---|---|
| StatCounter[162] | Oct 2020 | 58.86% | 41.02% | 0.08% | 0.04% |
| StatCounter[163] | Dec 2019 | 63.11% | 36.65% | 0.15% | 0.09% |
| StatCounter[164] | Jul 2018 | 65.03% | 34.58% | 0.21% | 0.18% |
| StatCounter[165] | Jul 2015 | 65.51% | 31.36% | 0.78% | 2.93% |
| StatCounter[166] | Feb 2015 | 66.47% | 29.6% | 1.16% | 2.73% |
| StatCounter[167] | Oct 2014 | 71.67% | 25.62% | 0.08% | 2.63% |
[edit]
|
|
This section needs to be updated. Please help update this article to reflect recent events or newly available information. |
According to StatCounter web use statistics (a proxy for all use), smartphones are more popular than desktop computers globally (and Android in particular more popular than Windows). Including tablets with mobiles/smartphones, as they also run so-called mobile operating systems, even in the United States (and most countries) are mobiles including tablets more popular than other (older originally made for desktops) operating systems (such as Windows and macOS). Windows in the US (at 33.42%) has only 8% head-start (2.55-percentage points) over iOS only; with Android, that mobile operating system and iOS have 52.14% majority.[168] Alternatively, Apple, with iOS plus their non-mobile macOS (9.33%) has 20% more share (6.7-percentage points more) than Microsoft’s Windows in the country where both companies were built.
Although desktop computers are still popular in many countries (while overall down to 44.9% in the first quarter of 2017[169]), smartphones are more popular even in many developed countries. A few countries on all continents are desktop-minority with Android more popular than Windows; many, e.g. Poland in Europe, and about half of the countries in South America, and many in North America, e.g. Guatemala, Honduras, Haiti; up to most countries in Asia and Africa[170] with smartphone-majority because of Android, Poland and Turkey in Europe highest with 57.68% and 62.33%, respectively. In Ireland, smartphone use at 45.55% outnumbers desktop use and mobile as a whole gains majority when including the tablet share at 9.12%.[171][172] Spain was also slightly desktop-minority. As of July 2019, Sweden had been desktop-minority for eight weeks in a row.[173]
The range of measured mobile web use varies a lot by country, and a StatCounter press release recognizes «India amongst world leaders in use of mobile to surf the internet»[174] (of the big countries) where the share is around (or over) 80%[175] and desktop is at 19.56%, with Russia trailing with 17.8% mobile use (and desktop the rest).
Smartphones (discounting tablets), first gained majority in December 2016 (desktop-majority was lost the month before),[where?] and it wasn’t a Christmas-time fluke, as while close to majority after smartphone majority happened again in March 2017.[176][clarification needed]
In the week of 7–13 November 2016, smartphones alone (without tablets) overtook desktop for the first time, albeit for a short period.[177] Examples of mobile-majority countries include Paraguay in South America, Poland in Europe and Turkey and most of Asia and Africa. Some of the world is still desktop-majority, with for example the United States at 54.89% (but not on all days).[178] However, in some territories of the United States, such as Puerto Rico,[179] desktop is significantly under majority, with Windows just under 25%, overtaken by Android.
On 22 October 2016 (and subsequent weekends), mobile showed majority.[180] Since 27 October, the desktop hasn’t had a majority, including on weekdays. Smartphones alone have showed majority since 23 December to the end of the year, with the share topping at 58.22% on Christmas Day.[181] To the «mobile»-majority share of smartphones, tablets could be added giving a 63.22% majority. While an unusually high top, a similar high also occurred on Monday 17 April 2017, with the smartphone share slightly lower and tablet share slightly higher, combining to 62.88%.
Formerly, according to a StatCounter press release, the world has turned desktop-minority;[182] as of October 2016, at about 49% desktop use for that month, but mobile wasn’t ranked higher, tablet share had to be added to it to exceed desktop share.
For the Christmas season (i.e. temporarily, while desktop-minority remains and smartphone-majority on weekends[183][184]), the last two weeks in December 2016, Australia (and Oceania in general)[185] was desktop-minority for the first time for an extended period, i.e. every day from 23 December.[186]
In South America, smartphones alone took majority from desktops on Christmas Day,[184] but for a full-week-average, desktop is still at least at 58%.[187]
The UK desktop-minority dropped down to 44.02% on Christmas Day and for the eight days to the end of the year.[188] Ireland joined some other European countries with smartphone-majority, for three days after Christmas, topping that day at 55.39%.[189][190]
In the US, desktop-minority happened for three days on and around Christmas (while a longer four-day stretch happened in November, and happens frequently on weekends).[191]
According to StatCounter web use statistics (a proxy for all use), in the week from 7–13 November 2016, «mobile» (meaning smartphones) alone (without tablets) overtook desktop, for the first time, with them highest ranked at 52.13% (on 27 November 2016)[192] or up to 49.02% for a full week.[193][194] Mobile-majority applies to countries such as Paraguay in South America, Poland in Europe and Turkey; and the continents Asia and Africa. Large regions of the rest of the world are still desktop-majority, while on some days, the United States,[195] (and North America as a whole)[196] isn’t; the US is desktop-minority up to four days in a row,[197] and up to a five-day average.[198] Other examples, of desktop-minority on some days, include the UK,[196] Ireland,[199] Australia[200] (and Oceania as a whole); in fact, at least one country on every continent[201][202][203] has turned desktop-minority (for at least a month). On 22 October 2016 (and subsequent weekends), mobile has shown majority.[204]
Previously, according to a StatCounter press release, the world has turned desktop-minority;[205] as of October 2016, at about 49% desktop use for that month,[206][207] with desktop-minority stretching up to an 18-weeks/4-months period from 28 June to 31 October 2016,[208][209] while whole of July, August or September 2016, showed desktop-majority (and many other long sub-periods in the long stretch showed desktop-minority; similarly only Fridays, Saturdays and Sundays are desktop-minority). The biggest continents, Asia and Africa, have shown vast mobile-majority for long time (any day of the week), as well as several individual countries elsewhere have also turned mobile-majority: Poland, Albania (and Turkey)[210] in Europe and Paraguay and Bolivia[211] in South America.[212]
According to StatCounter’s web use statistics, Saturday 28 May 2016, was the day when smartphones («mobile» at StatCounter, that now counts tablets separately) became a most used platform, ranking first, at 47.27%, above desktops.[213][214] The next day, desktops slightly outnumbered «mobile» (unless counting tablets: some analysts count tablets with smartphones or separately while others with desktops – even when most tablets are iPad or Android, not Windows devices).[215]
Since Sunday 27 March 2016, the first day the world dipped to desktop-minority,[216] it has happened almost every week, and by week of 11–17 July 2016, the world was desktop-minority,[217] followed by the next week, and thereon also for a three-week period.[218] The trend is still stronger on weekends, with e.g. 17 July 2016 showed desktop at 44.67%, «mobile» at 49.5% plus tablets at 5.7%.[219] Recent weekly data shows a downward trend for desktops.[220][221]
According to StatCounter web use statistics (a proxy for overall use), on weekends desktops worldwide lose about 5 percent points, e.g. down to 51.46% on 15 August 2015, with the loss in (relative) web use going to mobile (and also a minuscule increase for tablets),[222] mostly because Windows 7, ranked 1st on workdays, declines in web use, with it shifting to Android and lesser degree to iOS.[223]
Two continents, have already crossed over to mobile-majority (because of Android), based on StatCounters web use statistics. In June 2015, Asia became the first continent where mobile overtook desktop[224] (followed by Africa in August;[225] while Nigeria had mobile majority in October 2011,[226][227] because of Symbian – that later had 51% share, then Series 40 dominating, followed by Android as dominating operating system[228]) and as far back as October 2014, they had reported this trend on a large scale in a press release: «Mobile usage has already overtaken desktop in several countries including India, South Africa and Saudi Arabia».[229] In India, desktop went from majority, in July 2012, down to 32%.[230] In Bangladesh desktop went from majority, in May 2013, down to 17%, with Android alone now accounting for majority web use.[231] Only a few African countries were still desktop-majority[232] and many have a large mobile majority including Ethiopia and Kenya, where mobile usage is over 72%.[233]
The popularity of mobile use worldwide has been driven by the huge popularity increase of Android in Asian countries, where Android is the highest ranked operating system statistically in virtually every south-east Asian country,[234] while it also ranks most popular in almost every African country. Poland has been desktop-minority since April 2015,[235] because of Android being vastly more popular there,[236] and other European countries, such as Albania (and Turkey), have also crossed over. The South America continent is somewhat far from losing desktop-majority, but Paraguay had lost it as of March 2015.[237] Android and mobile browsing in general has also become hugely popular in all other continents where desktop has a large desktop base and the trend to mobile is not as clear as a fraction of the total web use.
While some analysts count tablets with desktops (as some of them run Windows), others count them with mobile phones (as the vast majority of tablets run so-called mobile operating systems, such as Android or iOS on the iPad). iPad has a clear lead globally, but has clearly lost the majority to Android in South America,[238] and a number of Eastern European countries such as Poland; lost virtually all African countries and has lost the majority twice in Asia, but gained the majority back (while many individual countries, e.g. India and most of the middle East have clear Android majority on tablets).[239] Android on tablets is thus second most popular after the iPad.[240]
In March 2015, for the first time in the US the number of mobile-only adult internet users exceeded the number of desktop-only internet users with 11.6% of the digital population only using mobile compared to 10.6% only using desktop; this also means the majority, 78%, use both desktop and mobile to access the internet.[241] A few smaller countries in North America, such as Haiti (because of Android) have gone mobile majority (mobile went to up to 72.35%, and is at 64.43% in February 2016).[242]
Revenue[edit]
The region with the largest Android usage[61] also has the largest mobile revenue.[243]
| 2020[244] | |
|---|---|
| Asia Pacific | $85.3B |
| North and South America | $74.5B |
| Europe, Middle East, and Africa | $29.1B |
Public servers on the Internet[edit]
Internet based servers’ market share can be measured with statistical surveys of publicly accessible servers, such as web servers, mail servers[245] or DNS servers on the Internet: the operating systems powering such servers are found by inspecting raw response messages. This method gives insight only into market share of operating systems that are publicly accessible on the Internet.
There will be differences in the result depending on how the sample is done and observations weighted. Usually the surveys are not based on a random sample of all IP addresses, domain names, hosts or organisations, but on servers found by some other method.[citation needed] Additionally, many domains and IP addresses may be served by one host and some domains may be served by several hosts or by one host with several IP addresses.
| Source | Date | Unix, Unix-like | Microsoft Windows | References |
|---|---|---|---|---|
| W3Techs | 14 July 2022 | 80.1% | 20.1% | [246][247] |
| Security Space | Feb 2014 | <79.3% | >20.7% | [248][249] |
|
- Note
- Revenue comparisons often include «operating system software, other bundled software»[251] and are not appropriate for usage comparison as the Linux operating system costs nothing (including «other bundled software»), except if optionally using commercial distributions such as Red Hat Enterprise Linux (in that case, cost of software for all software bundled with hardware has to be known for all operating systems involved, and subtracted). In cases where no-cost Linux is used, such comparisons underestimate Linux server popularity and overestimate other proprietary operating systems such as Unix and Windows.
Mainframes[edit]
Mainframes are larger and more powerful than servers, but not supercomputers. They are used to process large sets of data, for example enterprise resource planning or credit card transactions.
The most common operating system for mainframes is IBM’s z/OS.[citation needed] Operating systems for IBM Z generation hardware include IBM’s proprietary z/OS,[252] Linux on IBM Z, z/TPF, z/VSE and z/VM.
Gartner reported on 23 December 2008, that Linux on System z was used on approximately 28% of the «customer z base» and that they expected this to increase to over 50% in the following five years.[253] Of Linux on IBM Z, Red Hat and Micro Focus compete to sell RHEL and SLES respectively:
- Prior to 2006, Novell claimed a market share of 85% or more for SUSE Linux Enterprise Server.
- Red Hat has since claimed 18.4% in 2007 and 37% in 2008.[254]
- Gartner reported at the end of 2008 that Novell’s SUSE Linux Enterprise Server had an 80% share of mainframe Linux.[253][dead link]
Decline[edit]
Like today’s trend of mobile devices from personal computers,[241] in 1984 for the first time estimated sales of desktop computers ($11.6 billion) exceeded mainframe computers ($11.4 billion). IBM received the vast majority of mainframe revenue.[255]
From 1991 to 1996, AT&T Corporation briefly owned NCR, one of the major original mainframe producers. During the same period, companies found that servers based on microcomputer designs could be deployed at a fraction of the acquisition price and offer local users much greater control over their own systems given the IT policies and practices at that time. Terminals used for interacting with mainframe systems were gradually replaced by personal computers. Consequently, demand plummeted and new mainframe installations were restricted mainly to financial services and government. In the early 1990s, there was a rough consensus among industry analysts that the mainframe was a dying market as mainframe platforms were increasingly replaced by personal computer networks.[256]
In 2012, NASA powered down its last mainframe, an IBM System z9.[257] However, IBM’s successor to the z9, the z10, led a New York Times reporter to state four years earlier that «mainframe technology—hardware, software and services—remains a large and lucrative business for IBM, and mainframes are still the back-office engines behind the world’s financial markets and much of global commerce».[258] As of 2010, while mainframe technology represented less than 3% of IBM’s revenues, it «continue[d] to play an outsized role in Big Blue’s results».[259]
Supercomputers[edit]

Sierra helps to assure the safety, reliability and effectiveness of the United States’ nuclear weapons.
The TOP500 project lists and ranks the 500 fastest supercomputers for which benchmark results are submitted. Since the early 1990s, the field of supercomputers has been dominated by Unix or Unix-like operating systems, and starting in 2017, every top 500 fastest supercomputer uses Linux as its supercomputer operating system.
The last supercomputer to rank #1 while using an operating system other than Linux was ASCI White, which ran AIX. It held the title from November 2000 to November 2001,[260] and was decommissioned in 2006. Then in June 2017, two AIX computers held rank 493 and 494,[261] the last non-Linux systems before they dropped off the list.

Supercomputer OS family – 1993–2021 systems share according to TOP500[262]
Historically all kinds of Unix operating systems dominated, and in the end ultimately Linux remains.
[edit]
| Category | Source | Date | Linux | UNIX and Unix-like (not incl. Linux) | Windows | In‑house | Other |
|---|---|---|---|---|---|---|---|
| Desktop, laptop | Net Applications[263] | Apr 2020 | 2.87% (excl. ChromeOS) plus 0.4% ChromeOS | 9.75% (macOS) | 86.92% (all versions) | 0.06% | |
| Embedded[e] | EE Times[264] | Mar 2019 | 38.42% (embedded Linux, Ubuntu, Android, other) | 2.82% (QNX, LynxOS) | 10.73% (Windows 10, Windows Embedded Compact) | 10.73% | 37.30% |
| Mainframe | Gartner[254] | Dec 2008 | 28% (SLES, RHEL) | 72% (z/OS)[f] | |||
| Server (web) | W3Techs[265] | Sep 2021 | Likely 77.4% (39.8% confirmed)[g] (Ubuntu, CentOS, Debian, Gentoo, RHEL, …)[266] | Less than 1% is confirmed to be UNIX or Unix-like and non-Linux. The top operating systems in order are: 0.3% BSD (97.8% of which is FreeBSD),[267] <0.1% Darwin,[268] <0.1% HP-UX,[269] <0.1% Solaris,[270] and <0.1% Minix.[271][g] | 22.7% (Windows Server 2019, WS2016, WS2012, WS2008) Microsoft’s own webserver runs 6.6% of websites.[272] |
||
| Smartphone, tablet | StatCounter Global Stats[273] | Apr 2020 | 70.80% (Android, KaiOS) | 28.79% (iOS) | 0.07% | 0.34% | |
| Supercomputer | TOP500[274] | Nov 2019 | 100% (Custom) |
See also[edit]
- Comparison of operating systems
- List of operating systems
- Timeline of operating systems
- Usage share of web browsers
- Mobile OS market share
Notes[edit]
- ^ «Shipments refer to sell-in», that is, wholesale.
- ^ The ‘Others’ column is obtained by summing all percentage data and subtracting from 100%.
- ^ Table is only showing mobile OS market share – not the overall market share.
- ^ Wikimedia Foundation statistics consider tablets as part of the mobile OS market share.
- ^ Embedded is a vast category, which has subcategories that include automotive, avionics, health, medical equipment, consumer electronics, intelligent homes, and telecommunications. The aggregated information above may be very different for each subcategory taken separately.
- ^ z/OS’s UNIX environment coexists with its native environment, which dates back to OS/360.
- ^ a b «UNIX and Unix-like (including Linux)» represents 77.4% of the total web server/website market share however 48.2% of that market share does not show «more specifically» which operating system.
References[edit]
- ^ «Operating System Market Share Worldwide». StatCounter Global Stats. Retrieved 7 November 2022.
- ^ «Operating System Market Share Worldwide April 2022». statcounter Global Stats.
- ^ «Mobile Operating System Market Share Worldwide — August 2022». statcounter Global Stats. Retrieved 4 May 2022.
- ^ «Desktop Operating System Market Share Worldwide — August 2022». statcounter Global Stats. Retrieved 13 September 2022.
- ^ «Tablet Operating System Market Share Worldwide». StatCounter Global Stats. Retrieved 7 November 2022.
- ^ «Tablet Operating System Market Share Worldwide». StatCounter Global Stats. Retrieved 7 November 2022.
- ^ «Tablet Operating System Market Share Worldwide». StatCounter Global Stats. Retrieved 7 November 2022.
- ^ «Desktop vs Mobile vs Tablet vs Console Market Share Worldwide — August 2022». statcounter Global Stats. Retrieved 4 May 2022.
- ^ «Desktop vs Mobile vs Tablet vs Console Market Share Worldwide». StatCounter Global Stats. Retrieved 4 May 2022.
- ^ «Desktop vs Mobile vs Tablet vs Console Market Share United States Of America». StatCounter Global Stats. Retrieved 4 May 2022.
- ^ a b «Windows comes up third in OS clash two years early». 1 April 2016. Retrieved 12 April 2016.
- ^ «Gartner Says Worldwide PC Shipments Grew 10.7% in Fourth Quarter of 2020 and 4.8% for the Year». Gartner. Retrieved 3 March 2021.
- ^ «Gartner Forecasts Worldwide Device Shipments to Decline 14% in 2020 Due to Coronavirus Impact». Gartner. Retrieved 3 March 2021.
- ^ «Gartner Says Worldwide Device Shipments Will Increase 2.1 Percent in 2018». 29 January 2018. Retrieved 18 December 2019.
- ^ «Gartner: Windows OS device shipments will falter in 2017». 10 January 2017. Retrieved 18 December 2019.
- ^ «Gartner Says Tablet Sales Continue to Be Slow in 2015». 5 January 2015. Archived from the original on 7 January 2015. Retrieved 6 March 2015.
- ^ «Gartner Says Worldwide Traditional PC, Tablet, Ultramobile and Mobile Phone Shipments to Grow 4.2 Percent in 2014». 7 July 2014. Archived from the original on 11 July 2014. Retrieved 6 March 2015.
- ^ «Gartner Says Worldwide PC, Tablet and Mobile Phone Shipments to Grow 4.5 Percent in 2013 as Lower-Priced Devices Drive Growth». 21 October 2013. Archived from the original on 21 October 2013. Retrieved 6 March 2015.
- ^ «Gartner Says Worldwide End-User Spending on Devices Will Grow 2 Percent in 2017, While Unit Shipments Remain Flat». Retrieved 7 December 2017.
- ^ «Gartner Says Worldwide PC Shipments Declined 8.3 Percent in Fourth Quarter of 2015: Holiday Sales Provided Little Cheer to PC Vendors in 2015» (Press release). 12 January 2016. Retrieved 15 March 2016.
- ^ «Android is now used by 1.4 billion people». The Verge. 29 September 2015.
- ^ «Google I/O website: Keynote». Archived from the original on 18 June 2015. Retrieved 20 January 2016.
- ^ Protalinski, Emil (17 May 2017). «Android passes 2 billion monthly active devices». VentureBeat. Retrieved 17 May 2017.
- ^ Ng, Alfred (17 May 2017). «Google’s Android now powers more than 2 billion devices». CNET. CBS Interactive. Retrieved 17 May 2017.
- ^ Thurrott, Paul (27 January 2016). «Apple’s active installed base is now over 1 billion strong». Retrieved 16 August 2016.
there are three big personal computing platforms. And only one of them is actually declining. We’ll see how Windows 10 fares over the long term, but even if Microsoft hits the 1 billion figure in 1-2 years as promised, it will by then still be the smallest of those three platforms.
- ^ Fuscaldo, Donna (18 July 2016). «Microsoft Backs Away From Windows 10 Goal (MSFT)». investopedia.com. Retrieved 22 March 2017.
- ^ Foley, Mary Jo. «Microsoft: Windows 10 now on 400 million devices». ZDNet.
- ^ Foley, Mary Jo. «Microsoft says Windows 10 is now on more than 800 million devices». ZDNet. Retrieved 11 March 2019.
- ^ Parrack, Dave (18 August 2016). «Android Is Killing iOS, Uber Launches Self-Driving Cars… [Tech News Digest]».
- ^ Gadgets Now Bureau, «World’s 5 biggest smartphone companies», Gadgets Now, 1 Aug 2018, 02.51 PM IST
- ^ «Gartner Says Five of Top 10 Worldwide Mobile Phone Vendors Increased Sales in Second Quarter of 2016: Global Sales of Smartphones Grew 4.3 Percent Year on Year» (Press release). Gartner. 19 August 2016.
- ^ Patrick, Seitz (3 November 2016). «Apple iPhone Grabs 104% Of Smartphone Industry Profit In Q3». Investor’s Business Daily.
- ^ «Are there Really More Mobile Phone Owners than Toothbrush Owners?». www.linkedin.com. Retrieved 15 June 2019.
- ^ Turner, Ash (10 July 2018). «1 Billion More Phones Than People In The World! BankMyCell». BankMyCell. Retrieved 15 June 2019.
- ^ «Tablet Users to Surpass 1 Billion Worldwide in 2015 — eMarketer». emarketer.com. Retrieved 22 March 2017.
- ^ «Tablets have banner 2015». 1 January 2016.
- ^ «IDC: Tablet Shipments Decline For Fifth Straight Quarter — Androidheadlines.com». androidheadlines.com. 1 February 2016. Retrieved 22 March 2017.
- ^ Eric Smith (29 July 2022). «Strategy Analytics: Android Tablet Market Share Falls Below 50% for First Time in 10 Years». Strategy Analytics. Retrieved 9 October 2022.
- ^ «Global tablet shipments by OS 2010-2020». Statista. Retrieved 16 November 2020.
- ^ Eric Smith (23 November 2015). «Tablets: Windows fast becoming a premium OS, says Strategy Analytics». Strategy Analytics. Retrieved 31 March 2016.
- ^ a b Lunden, Ingrid (3 March 2014). «Gartner: 195M Tablets Sold In 2013, Android Grabs Top Spot From iPad With 62% Share». Retrieved 21 July 2014.
- ^ «Ultramobiles». Gartner, Inc. Retrieved 9 October 2022.
- ^ «Mobile operating systems’ market share worldwide from 1st quarter 2009 to 4th quarter 2022». Retrieved 1 December 2022.
- ^ «Gartner Says Worldwide Sales of Smartphones Returned to Growth in First Quarter of 2018». 28 May 2018. Retrieved 22 September 2022.
- ^ «GGartner Says Worldwide Sales of Smartphones Recorded First Ever Decline During the Fourth Quarter of 2017» (Press release). 22 February 2018. Retrieved 22 September 2022.
- ^ «Gartner Says Worldwide Sales of Smartphones Grew 9 Percent in First Quarter of 2017». Retrieved 2 February 2018.
- ^ «GGartner Says Worldwide Sales of Smartphones Recorded First Ever Decline During the Fourth Quarter of 2017» (Press release). 22 February 2018. Retrieved 22 September 2022.
- ^ «Gartner Says Worldwide Sales of Smartphones Grew 7 Percent in the Fourth Quarter of 2016». Retrieved 2 February 2018.
- ^ «Gartner Says Chinese Smartphone Vendors Were Only Vendors in the Global Top Five to Increase Sales in the Third Quarter of 2016» (Press release). Retrieved 9 December 2016.
- ^ «Gartner Says Five of Top 10 Worldwide Mobile Phone Vendors Increased Sales in Second Quarter of 2016» (Press release). Retrieved 9 December 2016.
- ^ «Gartner Says Worldwide Smartphone Sales Grew 3.9 Percent in First Quarter of 2016» (Press release). Retrieved 9 December 2016.
- ^ «Gartner Says Worldwide Smartphone Sales Grew 9.7 Percent in Fourth Quarter of 2015» (Press release). 18 February 2016. Retrieved 22 September 2022.
- ^ «Gartner Says Worldwide Smartphone Sales Recorded Slowest Growth Rate Since 2013» (Press release). 20 August 2015. Retrieved 22 September 2022.
- ^ «Gartner Says Worldwide Smartphone Sales Grew 9.7 Percent in Fourth Quarter of 2015» (Press release). 18 February 2016. Retrieved 22 September 2022.
- ^ «Android Captures Record 81 Percent Share of Global Smartphone Shipments in Q3 2013». Archived from the original on 1 November 2013. Retrieved 1 November 2013.
- ^ «Gartner Says Worldwide Smartphone Sales Recorded Slowest Growth Rate Since 2013» (Press release). 20 August 2015. Retrieved 22 September 2022.
- ^ «Worldwide Smartphone Sales to End Users by Operating System in 2Q13» (Press release).
- ^ «Worldwide Smartphone Sales to End Users by Operating System in 1Q13» (Press release).
- ^ «Android and iOS Combine for 92.3% of All Smartphone Operating System Shipments in the First Quarter While Windows Phone Leapfrogs BlackBerry, According to IDC». www.businesswire.com. 16 May 2013.
- ^ Statcounter. «Operating System Market Share Worldwide: April 2022». gs.statcounter.com. Retrieved 4 May 2022.
- ^ a b «Android overtakes Windows for first time: «Milestone in technology history and end of an era» as Microsoft no longer owns dominant OS» (Press release).
- ^ «StatCounter Global Stats — Browser, OS, Search Engine including Mobile Usage Share». statcounter.com. Retrieved 19 April 2017.
- ^ «Operating System Market Share South America». StatCounter Global Stats. Retrieved 1 October 2020.
- ^ «Operating System Market Share United States Of America». StatCounter Global Stats. Retrieved 19 June 2022.
- ^ «Operating System Market Share United States Of America». StatCounter Global Stats. Retrieved 19 June 2022.
- ^ «Operating System Market Share United States Of America». StatCounter Global Stats. Retrieved 19 June 2022.
- ^ «Operating System Market Share Africa». StatCounter Global Stats. Retrieved 19 June 2022.
- ^ «Operating System Market Share Guam». StatCounter Global Stats. Retrieved 4 December 2019.
- ^ «Operating System Market Share Guam». StatCounter Global Stats. Retrieved 14 July 2019.
- ^ «Operating System Market Share Guam». StatCounter Global Stats. Retrieved 4 December 2019.
- ^ «Operating System Market Share Falkland Islands (malvinas): Q3 2018 — Q2 2019». StatCounter Global Stats. Retrieved 14 July 2019.
- ^ «Operating System Market Share Falkland Islands (malvinas)». StatCounter Global Stats. Retrieved 14 July 2019.
- ^ «Operating System Market Share Sweden». StatCounter Global Stats. Retrieved 14 July 2019.
- ^ «Operating System Market Share Madagascar». StatCounter Global Stats. Retrieved 15 July 2019.
- ^ «Browser Version Market Share Madagascar». StatCounter Global Stats.
- ^ «Browser Market Share Madagascar». StatCounter Global Stats.
- ^ «StatCounter Global Stats — Browser, OS, Search Engine including Mobile Usage Share». statcounter.com. Retrieved 16 October 2019.
- ^ «Top 8 Operating Systems in Asia from July 2014 to September 2019». statcounter.com.
- ^ a b «Operating System Market Share Bangladesh». StatCounter Global Stats. Retrieved 16 October 2019.
- ^ «Top 8 Operating Systems in Africa from July 2014 to Apr 2016». statcounter.com.
- ^ «StatCounter Global Stats — Browser, OS, Search Engine including Mobile Usage Share». statcounter.com. Retrieved 22 March 2017.
- ^ «Global stats». W3 Counter.
- ^ «StatCounter Global Stats — Browser, OS, Search Engine including Mobile Usage Share». statcounter.com. Retrieved 22 March 2017.
- ^ «W3Counter: Global Web Stats — October 2022». www.w3counter.com. Retrieved 1 December 2022.
- ^ «W3Counter: Global Web Stats — October 2020». www.w3counter.com. Retrieved 16 November 2020.
- ^ a b «Global stats». W3 Counter.
- ^ «Global stats». W3 Counter.
- ^ a b «StatCounter Stats through Dec 2016». www.statcounter.com. Retrieved 5 December 2016.
- ^ «Worldwide user OS families in Jul 2016».
- ^ a b «Worldwide user OS families in Dec 2015».
- ^ «Wikimedia Traffic Analysis Report — Operating Systems, 28Nov2016-1Jan2017».
- ^ «Desktop Operating System Market Share Worldwide». StatCounter Global Stats.
- ^ «Operating System Market Share United States Of America». StatCounter Global Stats. Retrieved 5 January 2021.
- ^ «Operating System Market Share Worldwide». StatCounter Global Stats. Retrieved 5 January 2021.
- ^ «Desktop Operating System Market Share United States Of America». StatCounter Global Stats. Retrieved 5 January 2021.
- ^ https://gs.statcounter.com/#desktop-os-ww-monthly-201508-201508-bar StatCounter
- ^ «Software Pirates in China Beat Microsoft to the Punch». The New York Times. 19 October 2009.
- ^ «Around 25–35% of Windows XP systems are pirated (calculations included)». Archived from the original on 4 March 2016.
- ^ «StatCounter Global Stats — Browser, OS, Search Engine including Mobile Usage Share». statcounter.com. Retrieved 22 March 2017.
- ^ «StatCounter Global Stats — Browser, OS, Search Engine including Mobile Usage Share». statcounter.com. Retrieved 22 March 2017.
- ^ «Top 7 Desktop OSs in Asia on May 2016». StatCounter. May 2016. Retrieved 9 April 2016.
- ^ «Desktop Windows Version Market Share Armenia». StatCounter Global Stats. Retrieved 4 October 2021.
- ^ «Desktop vs Mobile vs Tablet vs Console Market Share Worldwide». StatCounter Global Stats. Retrieved 2 October 2021.
- ^ «Desktop vs Mobile vs Tablet vs Console Market Share Worldwide». StatCounter Global Stats. Retrieved 16 November 2020.
- ^ «Desktop vs Mobile vs Tablet vs Console Market Share Worldwide». StatCounter Global Stats. Retrieved 1 October 2020.
- ^ «Desktop vs Mobile vs Tablet vs Console Market Share United States Of America». StatCounter Global Stats. Retrieved 4 October 2021.
- ^ «Desktop vs Mobile vs Tablet vs Console Market Share Oceania». StatCounter Global Stats. Retrieved 4 October 2021.
- ^ «Desktop vs Mobile vs Tablet vs Console Market Share Europe». StatCounter Global Stats. Retrieved 4 October 2021.
- ^ «Desktop vs Mobile vs Tablet vs Console Market Share North America». StatCounter Global Stats. Retrieved 4 October 2021.
- ^ «Desktop vs Mobile vs Tablet vs Console Market Share United States Of America». StatCounter Global Stats. Retrieved 1 July 2019.
- ^ «Desktop vs Mobile vs Tablet vs Console Market Share United States Of America». StatCounter Global Stats. Retrieved 18 October 2021.
- ^ «Desktop vs Mobile vs Tablet vs Console Market Share United States Of America». StatCounter Global Stats. Retrieved 18 October 2021.
- ^ «Desktop vs Mobile vs Tablet vs Console Market Share United States Of America». StatCounter Global Stats. Retrieved 18 October 2021.
- ^ «Desktop vs Mobile vs Tablet vs Console Market Share Worldwide». StatCounter Global Stats. Retrieved 1 July 2019.
- ^ «Desktop vs Mobile vs Tablet vs Console Market Share United States Of America». StatCounter Global Stats. Retrieved 13 December 2021.
- ^ «Desktop vs Mobile vs Tablet vs Console Market Share United States Of America». StatCounter Global Stats. Retrieved 13 December 2021.
- ^ «Stack Overflow Developer Survey 2019, Primary Operating System». stackoverflow. Retrieved 30 April 2019.
- ^ «Windows 10 has over 50 percent market share, according to Microsoft — wait, what?». BetaNews. 29 August 2016.
- ^ a b Steam Hardware & Software Survey: December 2022, archived from the original on 4 January 2021, retrieved 31 January 2023
- ^ Steam Hardware & Software Survey: December 2019, archived from the original on 2 January 2020
- ^ Steam Hardware & Software Survey: January 2019, archived from the original on 11 February 2019
- ^ Steam Hardware & Software Survey: December 2018, archived from the original on 1 March 2018
- ^ Steam Hardware & Software Survey, archived from the original on 12 February 2017
- ^ Steam Hardware & Software Survey, archived from the original on 10 February 2016
- ^ Steam Hardware & Software Survey, archived from the original on 16 February 2015
- ^ Steam Hardware & Software Survey, archived from the original on 15 February 2014
- ^ «Linux gaming is much healthier than Steam’s Hardware Survey implies». pcworld.com. Retrieved 22 March 2017.
- ^ «Gartner Says Worldwide Sales of Smartphones Returned to Growth in First Quarter of 2018». Gartner, Inc. Gartner. 29 May 2018. Archived from the original on 13 June 2018. Retrieved 25 August 2018.
- ^ «Desktop vs Mobile vs Tablet vs Console Market Share Russian Federation | StatCounter Global Stats». StatCounter Global Stats. Retrieved 16 October 2019.
- ^ «Desktop vs Mobile vs Tablet vs Console Market Share Mali | StatCounter Global Stats». StatCounter Global Stats. Retrieved 16 October 2019.
- ^ «Operating System Market Share Mali». StatCounter Global Stats. Retrieved 15 July 2019.
- ^ Bates, Adam. «InsightPortal | Higher GDP per capita corresponds with more Apple devices, stats suggest». www.insightportal.io. Retrieved 18 October 2017.
- ^ «Google Mobile App Marketing Insights: Asia» (PDF). storage.googleapis.com.
- ^ «Mobile Operating System Market Share India». StatCounter Global Stats. Retrieved 23 January 2019.
- ^ «Mobile Operating System Market Share Worldwide». StatCounter Global Stats. Retrieved 8 October 2022.
- ^ «Mobile Operating System Market Share Worldwide». StatCounter Global Stats. Retrieved 16 November 2020.
- ^ a b c «StatCounter Global Stats — Browser, OS, Search Engine including Mobile Usage Share». StatCounter Global Stats.
- ^ «Comscore Reports April 2017 U.S. Smartphone Subscriber Market Share». comScore, Inc. 8 June 2017. Retrieved 8 October 2022.
- ^ «comScore Reports January 2016 U.S. Smartphone Subscriber Market Share». comScore, Inc. Retrieved 9 December 2016.
- ^ «comScore Reports January 2015 U.S. Smartphone Subscriber Market Share». comScore. 4 March 2015. Retrieved 5 May 2015.
- ^ «comScore Reports January 2014 U.S. Smartphone Subscriber Market Share — comScore, Inc». comScore. 7 March 2014. Retrieved 30 March 2014.
- ^ «Comscore Reports February 2012 U.S. Mobile Subscriber Market Share: Android Captures Majority Share of U.S. Smartphone Market». comScore, Inc. 3 April 2012. Retrieved 8 October 2022.
- ^ «comScore Reports December 2010 U.S. Mobile Subscriber Market Share: Number of Smartphone Users Up 60 Percent Versus Year Agoe». comScore, Inc. 7 February 2011. Retrieved 8 October 2022.
- ^ «Tablet Operating System Market Share Worldwide — July 2018». StatCounter. StatCounter. 29 May 2018. Retrieved 25 August 2018.
- ^ «StatCounter Global Stats — Browser, OS, Search Engine including Mobile Usage Share». statcounter.com. Retrieved 22 March 2017.
- ^ «StatCounter Global Stats — Browser, OS, Search Engine including Mobile Usage Share». statcounter.com. Retrieved 20 October 2017.
- ^ «StatCounter Global Stats — Browser, OS, Search Engine including Mobile Usage Share». statcounter.com. Retrieved 20 October 2017.
- ^ «StatCounter Global Stats — Browser, OS, Search Engine including Mobile Usage Share». statcounter.com. Retrieved 22 March 2017.
- ^ «StatCounter Global Stats — Browser, OS, Search Engine including Mobile Usage Share». statcounter.com. Retrieved 22 March 2017.
- ^ «StatCounter Global Stats — Browser, OS, Search Engine including Mobile Usage Share». statcounter.com.
- ^ «StatCounter Global Stats — Browser, OS, Search Engine including Mobile Usage Share». statcounter.com.
- ^ «StatCounter Global Stats — Browser, OS, Search Engine including Mobile Usage Share». statcounter.com.
- ^ «StatCounter Global Stats — Browser, OS, Search Engine including Mobile Usage Share». statcounter.com.
- ^ «StatCounter Global Stats — Browser, OS, Search Engine including Mobile Usage Share». statcounter.com.
- ^ a b «StatCounter Global Stats — Browser, OS, Search Engine including Mobile Usage Share». statcounter.com.
- ^ «Top 7 Tablet OSes in South America from Aug 2012 to Aug 2015». statcounter.com.
- ^ «StatCounter Global Stats — Browser, OS, Search Engine including Mobile Usage Share». statcounter.com.
- ^ «Top 7 Tablet OSes in South America from Aug 2012 to Sep 2015». statcounter.com.
- ^ «StatCounter Global Stats — Browser, OS, Search Engine including Mobile Usage Share». statcounter.com.
- ^ «StatCounter Global Stats — Browser, OS, Search Engine including Mobile Usage Share». statcounter.com.
- ^ «StatCounter Global Stats — Browser, OS, Search Engine including Mobile Usage Share». statcounter.com.
- ^ «Tablet Operating System Market Share Worldwide». StatCounter Global Stats. Retrieved 16 November 2020.
- ^ «Tablet Operating System Market Share Worldwide». StatCounter Global Stats. Retrieved 16 November 2020.
- ^ «Tablet Operating System Market Share Worldwide». StatCounter Global Stats. Retrieved 16 November 2020.
- ^ Global Stats Top 7 Tablet OSs from Jan to Aug 2015. Retrieved 20 September 2015.
- ^ Global Stats Top 7 Tablet OSs from Feb 2015. Retrieved 16 March 2015.
- ^ Global Stats Top 7 Tablet OSs from Oct 2014. Retrieved 7 March 2015.
- ^ «Operating System Market Share United States Of America». StatCounter Global Stats. Retrieved 16 October 2019.
- ^ «Desktop vs mobile vs tablet vs console market share Worldwide — StatCounter Global Stats». StatCounter Global Stats.
- ^ «Operating System Market Share Worldwide | StatCounter Global Stats». StatCounter Global Stats. Retrieved 10 April 2018.
- ^ «Desktop vs mobile vs tablet vs console market share in Europe — StatCounter Global Stats». StatCounter Global Stats.
- ^ «Desktop vs mobile vs tablet vs console market share Worldwide — StatCounter Global Stats». StatCounter Global Stats.
- ^ «Desktop vs Mobile vs Tablet vs Console Market Share Sweden». StatCounter Global Stats. Retrieved 12 July 2019.
- ^ «India amongst world leaders in use of mobile to surf the internet» (Press release). 28 March 2017.
- ^ «Operating system market share in India — StatCounter Global Stats». StatCounter Global Stats.
- ^ «Desktop vs mobile vs tablet vs console market share Worldwide — StatCounter Global Stats». StatCounter Global Stats.
- ^ «Comparison from W34 to W45 2015». StatCounter Global Stats.
- ^ «StatCounter Global Stats — Browser, OS, Search Engine including Mobile Usage Share».
- ^ «Operating system market share in Puerto Rico — StatCounter Global Stats». StatCounter Global Stats.
- ^ «StatCounter Global Stats — Browser, OS, Search Engine including Mobile Usage Share».
- ^ «StatCounter Global Stats — Browser, OS, Search Engine including Mobile Usage Share». statcounter.com. Retrieved 22 March 2017.
- ^ «Mobile and tablet Internet usage exceeds desktop for first time worldwide». StatCounter (Press release).
- ^ «Desktop vs mobile vs tablet vs console market share Worldwide — StatCounter Global Stats». statcounter.com. Retrieved 3 April 2017.
- ^ a b «Desktop vs mobile vs tablet vs console market share Worldwide — StatCounter Global Stats». statcounter.com. Retrieved 22 March 2017.
- ^ «StatCounter Global Stats — Browser, OS, Search Engine including Mobile Usage Share». statcounter.com. Retrieved 22 March 2017.
- ^ «StatCounter Global Stats — Browser, OS, Search Engine including Mobile Usage Share». statcounter.com. Retrieved 22 March 2017.
- ^ «StatCounter Global Stats — Browser, OS, Search Engine including Mobile Usage Share». statcounter.com. Retrieved 22 March 2017.
- ^ «StatCounter Global Stats — Browser, OS, Search Engine including Mobile Usage Share». statcounter.com. Retrieved 22 March 2017.
- ^ «StatCounter Global Stats — Browser, OS, Search Engine including Mobile Usage Share». statcounter.com. Retrieved 22 March 2017.
- ^ «StatCounter Global Stats — Browser, OS, Search Engine including Mobile Usage Share». statcounter.com. Retrieved 22 March 2017.
- ^ «StatCounter Global Stats — Browser, OS, Search Engine including Mobile Usage Share». statcounter.com. Retrieved 22 March 2017.
- ^ «StatCounter Global Stats — Browser, OS, Search Engine including Mobile Usage Share». statcounter.com. Retrieved 22 March 2017.
- ^ «StatCounter Global Stats — Browser, OS, Search Engine including Mobile Usage Share». statcounter.com. Retrieved 22 March 2017.
- ^ «Comparison from W34 to W47 2016». StatCounter Global Stats.
- ^ «StatCounter Global Stats — Browser, OS, Search Engine including Mobile Usage Share». statcounter.com. Retrieved 22 March 2017.
- ^ a b «StatCounter Global Stats — Browser, OS, Search Engine including Mobile Usage Share». statcounter.com. Retrieved 22 March 2017.
- ^ «StatCounter Global Stats — Browser, OS, Search Engine including Mobile Usage Share». statcounter.com. Retrieved 22 March 2017.
- ^ «StatCounter Global Stats — Browser, OS, Search Engine including Mobile Usage Share». statcounter.com. Retrieved 22 March 2017.
- ^ «StatCounter Global Stats — Browser, OS, Search Engine including Mobile Usage Share». statcounter.com. Retrieved 22 March 2017.
- ^ «StatCounter Global Stats — Browser, OS, Search Engine including Mobile Usage Share». statcounter.com. Retrieved 22 March 2017.
- ^ «StatCounter Global Stats — Browser, OS, Search Engine including Mobile Usage Share». statcounter.com. Retrieved 22 March 2017.
- ^ «StatCounter Global Stats — Browser, OS, Search Engine including Mobile Usage Share». statcounter.com. Retrieved 22 March 2017.
- ^ «StatCounter Global Stats — Browser, OS, Search Engine including Mobile Usage Share». statcounter.com. Retrieved 22 March 2017.
- ^ «StatCounter Global Stats — Browser, OS, Search Engine including Mobile Usage Share». statcounter.com. Retrieved 22 March 2017.
- ^ «Mobile and tablet internet usage exceeds desktop for first time worldwide». StatCounter (Press release).
- ^ «StatCounter Global Stats — Browser, OS, Search Engine including Mobile Usage Share». statcounter.com. Retrieved 22 March 2017.
- ^ «StatCounter Global Stats — Browser, OS, Search Engine including Mobile Usage Share». statcounter.com. Retrieved 22 March 2017.
- ^ «StatCounter Global Stats — Browser, OS, Search Engine including Mobile Usage Share». statcounter.com. Retrieved 22 March 2017.
- ^ «StatCounter Global Stats — Browser, OS, Search Engine including Mobile Usage Share». statcounter.com. Retrieved 22 March 2017.
- ^ «StatCounter Global Stats — Browser, OS, Search Engine including Mobile Usage Share». statcounter.com. Retrieved 22 March 2017.
- ^ «StatCounter Global Stats — Browser, OS, Search Engine including Mobile Usage Share». statcounter.com. Retrieved 22 March 2017.
- ^ «StatCounter Global Stats — Browser, OS, Search Engine including Mobile Usage Share». statcounter.com. Retrieved 22 March 2017.
- ^ «StatCounter Global Stats — Browser, OS, Search Engine including Mobile Usage Share». statcounter.com. Retrieved 22 March 2017.
- ^ «StatCounter Global Stats — Browser, OS, Search Engine including Mobile Usage Share». statcounter.com. Retrieved 22 March 2017.
- ^ «StatCounter Global Stats — Browser, OS, Search Engine including Mobile Usage Share». statcounter.com. Retrieved 22 March 2017.
- ^ https://gs.statcounter.com/#all-comparison-ww-daily-20150701-20160724 Comparison from 1 July 2015 to 24 July 2016
- ^ «StatCounter Global Stats — Browser, OS, Search Engine including Mobile Usage Share». statcounter.com. Retrieved 22 March 2017.
- ^ «StatCounter Global Stats — Browser, OS, Search Engine including Mobile Usage Share». statcounter.com. Retrieved 22 March 2017.
- ^ «StatCounter Global Stats — Browser, OS, Search Engine including Mobile Usage Share». statcounter.com. Retrieved 22 March 2017.
- ^ «StatCounter Global Stats — Browser, OS, Search Engine including Mobile Usage Share». statcounter.com. Retrieved 22 March 2017.
- ^ «StatCounter Global Stats — Browser, OS, Search Engine including Mobile Usage Share». statcounter.com. Retrieved 22 March 2017.
- ^ «StatCounter Global Stats — Browser, OS, Search Engine including Mobile Usage Share». statcounter.com.
- ^ «StatCounter Global Stats — Browser, OS, Search Engine including Mobile Usage Share». statcounter.com.
- ^ «StatCounter Global Stats — Browser, OS, Search Engine including Mobile Usage Share». statcounter.com.
- ^ «StatCounter Global Stats — Browser, OS, Search Engine including Mobile Usage Share». statcounter.com.
- ^ «StatCounter Global Stats — Browser, OS, Search Engine including Mobile Usage Share». statcounter.com.
- ^ «StatCounter Global Stats — Browser, OS, Search Engine including Mobile Usage Share». statcounter.com.
- ^ «StatCounter Global Stats — Browser, OS, Search Engine including Mobile Usage Share». statcounter.com.
- ^ «Mobile internet usage soars by 67%» (Press release). Retrieved 21 October 2014.
- ^ «StatCounter Global Stats — Browser, OS, Search Engine including Mobile Usage Share». statcounter.com.
- ^ «StatCounter Global Stats — Browser, OS, Search Engine including Mobile Usage Share». statcounter.com.
- ^ «StatCounter Global Stats — Browser, OS, Search Engine including Mobile Usage Share». statcounter.com.
- ^ «StatCounter Global Stats — Browser, OS, Search Engine including Mobile Usage Share». statcounter.com.
- ^ «StatCounter Global Stats — Browser, OS, Search Engine including Mobile Usage Share». statcounter.com.
- ^ «StatCounter Global Stats — Browser, OS, Search Engine including Mobile Usage Share». statcounter.com. Retrieved 22 March 2017.
- ^ «StatCounter Global Stats — Browser, OS, Search Engine including Mobile Usage Share». statcounter.com.
- ^ «StatCounter Global Stats — Browser, OS, Search Engine including Mobile Usage Share». statcounter.com. Retrieved 22 March 2017.
- ^ «StatCounter Global Stats — Browser, OS, Search Engine including Mobile Usage Share». statcounter.com. Retrieved 22 March 2017.
- ^ «StatCounter Global Stats — Browser, OS, Search Engine including Mobile Usage Share». statcounter.com. Retrieved 22 March 2017.
- ^ «StatCounter Global Stats — Browser, OS, Search Engine including Mobile Usage Share». statcounter.com. Retrieved 22 March 2017.
- ^ a b Number of Mobile-Only Internet Users Now Exceeds Desktop-Only in the U.S.. Retrieved 5 May 2015.
- ^ «StatCounter Global Stats — Browser, OS, Search Engine including Mobile Usage Share». statcounter.com. Retrieved 22 March 2017.
- ^ «Forecast: Mobile App Store Revenue to Exceed $139B in 2021». appannie.com.
- ^ «Worldwide mobile app revenues by region 2020». Statista. Retrieved 16 November 2020.
- ^ «Mail Server Survey». Security Space. August 2011.
- ^ «Usage of operating systems for websites». W3Techs. Retrieved 14 July 2022.
- ^ «Usage of Unix for websites». W3Techs. Retrieved 14 July 2022.
- ^ «Web Server Survey». Security Space. 1 March 2014.
- ^ «OS/Linux Distributions using Apache». Security Space. 1 March 2014.
- ^ «Web Technologies Statistics and Trends». W3Techs. December 2013.
- ^ «Worldwide Server Market Revenues Decline −3.7% in the Third Quarter as Weak Unix Server Demand Weights on the Market, According to IDC». International Data Corporation. Archived from the original on 8 February 2014. Retrieved 24 February 2014.
- ^ «IBM Tightens Stranglehold Over Mainframe Market; Gets Hit with Antitrust Complaint in Europe». Computer & Communications Industry Association. 2 July 2008. Archived from the original on 6 July 2010. Retrieved 27 May 2015.
- ^ a b «Vendor Rating: Novell, 2008». Gartner RAS Core Research Note G00162399. 23 December 2008. Retrieved 23 November 2009.[dead link]
- ^ a b Claybrook, Bill (1 September 2009). «Red Hat bolsters Linux for mainframes, tries to catch Novell». SearchDataCenter.com. Retrieved 23 November 2009.
- ^ Sanger, David E. (5 February 1984). «Bailing Out of the Mainframe Industry». The New York Times. p. Section 3, Page 1. ISSN 0362-4331. Retrieved 2 March 2020.
- ^ Also, Stewart (8 March 1993). «IBM still has brains to be player in client/server platforms». InfoWorld. Retrieved 26 December 2013.
- ^ Cureton, Linda (11 February 2012). The End of the Mainframe Era at NASA. NASA. Retrieved 31 January 2014.
- ^ Lohr, Steve (23 March 2008). «Why Old Technologies Are Still Kicking». The New York Times. Retrieved 25 December 2013.
- ^ Ante, Spencer E. (22 July 2010). «IBM Calculates New Mainframes Into Its Future Sales Growth». The Wall Street Journal. Retrieved 25 December 2013.
- ^ «No. 1 system from November 2000 to November 2001». top500.org. Retrieved 22 May 2019.
- ^ «Linux is Running on Almost all of the Supercomputers». TechFAE. 25 June 2017.
- ^ «Operating system Family — Systems share». Top 500 project.
- ^ «Operating System Market Share». Net Applications.
- ^ «Embedded Markets Study» (PDF). March 2019.
- ^ «Usage Statistics and Market Share of Operating Systems for Websites, September 20212020». W3Techs. Retrieved 8 September 2021.
- ^ «Usage Statistics and Market Share of Linux for Websites, September 2021». W3Techs. Retrieved 8 September 2021.
- ^ «Usage Statistics and Market Share of BSD for Websites, September 2021». W3Techs. Retrieved 8 September 2021.
- ^ «Usage Statistics and Market Share of Darwin for Websites, September 2021». W3Techs. Retrieved 8 September 2021.
- ^ «Usage Statistics and Market Share of HP-UX for Websites, September 2021». W3Techs. Retrieved 8 September 2021.
- ^ «Usage Statistics and Market Share of Solaris for Websites, September 2021». W3Techs. Retrieved 8 September 2021.
- ^ «Usage Statistics and Market Share of Minix for Websites, September 2021». W3Techs. Retrieved 8 September 2021.
- ^ «Usage Statistics and Market Share of Web Servers, September 2021». W3Techs. Retrieved 8 September 2021.
- ^ «StatCounter Global Stats: Top 8 Mobile Operating Systems on April 2020».
- ^ «Operating system Family (Linux)». www.top500.org. Retrieved 12 May 2020.
In contrast the share of households with a personal computer in developed countries was closer to 80 percent.
Share of households with a computer at home worldwide from 2005 to 2019.
| Characteristic | Share of households |
|---|---|
| 2019 | 47.1% |
| 2018 | 47% |
| 2017 | 46.4% |
| 2016 | 45.8% |
Contents
- 1 What percentage of people use computers 2020?
- 2 How many computer users are there in the world?
- 3 How many people use computers 2019?
- 4 How many computers are in use today?
- 5 What percentage of households have a PC?
- 6 What percentage of the world uses computers?
- 7 How many people use Windows?
- 8 How many people use social media?
- 9 How much does the average person use technology?
- 10 How many computers are in the US?
- 11 How many people had computers 1984?
- 12 How many people use PC in UK?
- 13 How many households had computers in 2000?
- 14 How many schools use computers?
- 15 How many users are using Windows 7?
- 16 How many Windows 11 users are there?
- 17 Will there be a Windows 11?
- 18 How many people are on Instagram?
- 19 What percentage of 50+ Americans use social media?
- 20 What is the most popular social media 2021?
What percentage of people use computers 2020?
Access to a computer in households worldwide 2020
According to the survey, in the U.S 87 percent of individuals have access to a computer in their households.
How many computer users are there in the world?
How many people use the internet? As of January 2021 there were 4.66 billion active internet users worldwide – 59.5 percent of the global population. Of this total, 92.6 percent (4.32 billion) accessed the internet via mobile devices.
How many people use computers 2019?
As of February 2019, 74 percent of Americans owned a desktop or laptop computer.
Desktop/laptop ownership among adults in the United States from 2008 to 2019.
| Characteristic | Share of U.S. adults |
|---|---|
| February 2019 | 74% |
| January 2018 | 73% |
| November 2016 | 78% |
| April 2016 | 74% |
How many computers are in use today?
In 2019, there were over 2 billion computers in the world, including servers, desktops, and laptops.
What percentage of households have a PC?
88%
The share of United Kingdom households that own a home computer reached a plateau of 88 percent, starting in 2015/16.
Percentage of households with home computers in the United Kingdom (UK) from 1985 to 2018.
| Characteristic | Percentage of respondents |
|---|---|
| 2017-18 | 88% |
| 2016-17 | 88% |
| 2015-16 | 88% |
What percentage of the world uses computers?
In contrast the share of households with a personal computer in developed countries was closer to 80 percent.
Share of households with a computer at home worldwide from 2005 to 2019.
| Characteristic | Share of households |
|---|---|
| 2019 | 47.1% |
| 2018 | 47% |
| 2017 | 46.4% |
| 2016 | 45.8% |
How many people use Windows?
1.5 billion
But that 1 billion figure can and should be compared to the numbers Microsoft touts for Windows 10 (200 million, most recently) or Windows more generally (1.5 billion active users, a number that hasn’t moved, magically, in years), and that Google touts for Android (over 1.4 billion, as of September).
4.48 billion people
4.48 billion people use social media worldwide, according to platform reports on the current number of active users. 56.8% of the world’s population is active on social media when looking at eligible audiences aged 13+ years, rising to 82% in North America.
How much does the average person use technology?
A study of 11k RescueTime users found that people spend around 3 hours and 15 minutes a day on phones. Let’s spread out geographically and look at the amount of time spent by people from different countries. 2. As per eMarketer, the average US adult spends 3 hours and 43 minutes on their mobile devices.
How many computers are in the US?
118,860,100
| [Standard errors appear in parentheses] | ||
|---|---|---|
| State | Total number of households | Households with computer (including smartphone)1 |
| United States | 118,860,100 | (115,620) |
| Alabama | 1,852,500 | (8,910) |
| Alaska | 248,500 | (2,060) |
How many people had computers 1984?
About 31,099,000 persons ages 18 and above, 18.3 percent (1.2) of the adult population, reported that they used a computer somewhere-either at home, work or school (or some combination).
How many people use PC in UK?
Before we begin, you should check out these statistics: In 2020, there were almost 2,700 households in the UK with at least one computing device. In 2018, the desktop PC penetration rate in the UK reached 88%. In April 2021, Windows held almost 70% of the UK’s market.
How many households had computers in 2000?
Census figures showed that 54 million households, or 51 percent, had one or more computers in 2000, up from 42 percent in 1998.
How many schools use computers?
SCHOOL ACCESS TO TECHNOLOGY
Ninety-eight percent of all schools own computers. The current student-to-computer ratio of 10 to 1 represents an all-time low ratio.
How many users are using Windows 7?
Windows 7: Microsoft Windows 7 operating system still has 100 million users globally, Telecom News, ET Telecom.
How many Windows 11 users are there?
Now that the operating system is out in the wild, a new survey from AdDuplex says over 5% of PC users have the OS. 4.8% are running plain-old Windows 11, while 0.3% are on the W11 Insider track, for a grand total of 5.1%. These results are pulled from approximately 60,000 PCs.
Will there be a Windows 11?
Windows 11 is here, and if you own a PC, you might be wondering whether it’s time to upgrade your operating system. After all, you are likely to get this new software free. Microsoft first revealed its new operating system in June, its first major software upgrade in six years.
How many people are on Instagram?
1.386 billion
Ranked 4th: Most Used Social Media Platforms Worldwide
| Platform | Active users |
|---|---|
| 2.853 billion | |
| YouTube | 2.291 billion |
| 1.6 billion | |
| 1.386 billion |
Internet and social media use
As of 2019, per Pew data, 72 percent of all adults in America used some sort of social media, including 69 percent of those age 50 to 64, and 40 percent of people age 65 and older.
Top 10 Social Networking Sites by Market Share Statistics [2021]
- Facebook – 2.74 Billion Active Users.
- YouTube – 2.291 Billion Active Users.
- WhatsApp – 2.0 Billion Active Users.
- Facebook Messenger – 1.3 Billion Active Users.
- Instagram – 1.221 Billion Active Users.
- Weixin/WeChat – 1.213 Billion Active Users.

Microsoft has said for years that its customer base includes 1.5 billion Windows users. Among pundits and analysts, this number is often treated as authoritative and precise. It is not.
It is, rather, an aspirational bit of rhetoric, called forth when Microsoft’s senior management wants to emphasize the sheer size of the Windows customer base to motivate its workforce or rev up its partners. Satya Nadella’s invocation at a Windows 10 event in January 2016 is a perfect example of the genre:
The fact that there are 1.5 billion users of Windows is incredible and humbling. It’s a responsibility that none of us at Microsoft take lightly.
I believe that 1.5 billion number has shrunk quite a bit in the past few years. Here, let me show you.
The rise of Windows 10
Microsoft executives have, unsurprisingly, focused mostly on the growth of its Windows 10 installed base, reporting steady growth over the past five years. The company can be extremely confident about that metric, thanks to the update and telemetry components built into every copy of Windows 10. (As my colleague Mary Jo Foley notes regularly, Microsoft’s «monthly active devices» metric counts devices that have been in contact with Microsoft’s servers in the past 28 days.)
See also: Windows 10 telemetry secrets: Where, when, and why Microsoft collects your data
These statements are also material representations from a publicly traded company, so they’re vetted by lawyers and likely to be accurate. Making a material misrepresentation about the performance of a core business unit is the sort of thing that brings down the wrath of regulators like the Securities and Exchange Commission.
As of September 24, 2019, Microsoft officials said that more than 900 million active devices were running Windows 10. That figure includes 40-50 million Xbox One consoles, an insignificant number of HoloLens and Surface Hub devices, and a rapidly shrinking population of Windows Phones. After making those adjustments, let’s call it 850 million Windows 10 PCs.
That number has been increasing by about 100 million every six months, and usage statistics I’ve reviewed show that the pace is ticking up slightly as the Windows 7 deadline nears. Given those trends, it’s reasonable to project that the number of active Windows 10 devices will be over a billion by the end of the first calendar quarter of 2020.
But how does that number compare to the current Windows installed base? After reviewing all the available evidence, I’m convinced that the current installed base of Windows PCs as we head into 2020 is down significantly since its peak and is probably close to 1.2 billion today.
Erosion of the Windows installed base
A decade ago, when the PC era was in full swing, Microsoft executives regularly shared the company’s estimates of how many Windows PCs were in use worldwide.
For example, then-CEO Steve Ballmer told financial analysts in mid-2007 that the Windows installed base was approaching 1 billion and that the company expected to cross that threshold by mid-2008.
The reported number of Windows users went up to 1.25 billion at the end of 2011 and had increased again to 1.5 billion by the end of 2014. Five years later, that public number has not gone up, and executives rarely mention it. In short, if you’re looking for the highwater mark in the PC era, 2014 is a pretty good place to zero in.
Every bit of available data since that time says the Windows installed base is declining, although probably not as steeply as it grew in its heyday. One obvious deduction from that 2015 number is the population of roughly 70 million Windows Phones, almost all of which have long since been retired or replaced.
Businesses are mostly in PC replacement mode, often using hardware upgrades as an excuse to migrate PCs to a new operating system. One of the biggest replacement cycles in enterprise PCs in recent memory is happening now, as companies and government institutions migrate their workers from older Windows versions (mostly Windows 7) to Windows 10.
Some old machines are being retired and are not being replaced, especially in the consumer space. Enthusiasts who used to have multiple PCs now have only one or two. In consumer households, smartphones and tablets are handling the majority of computing tasks these days. Aging PCs, if they’re replaced at all, are likely to be swapped out for iPads and Macs (and perhaps even Chromebooks) rather than a Windows PC from Dell, HP, Lenovo, or Microsoft.
How do you measure the shrinkage in the PC population? One way is to look at PC sales based on the average useful life of the current population. For this estimate, I assume that 95% of PCs sold seven years ago are no longer in active use. According to Gartner’s estimates, OEMs shipped 351 million PCs in 2012. Seven years later, at the end of 2019, Gartner’s estimates of PC shipments for the trailing four quarters total less than 260 million for the year. Allowing for some of those old PCs to still be at work, that’s a gap of about 75 million PCs dropping out of the installed base.
The numbers are similar for a year earlier: In 2011 the PC industry shipped 353 million PCs; seven years later, in 2018, the total was below 260 million.
In the five years since Microsoft hit its high of 1.5 billion customers, I think it’s reasonable, even conservative, to assume that the PC population worldwide has shrunk by about 60 million every year, which means there are probably no more than 1.2 billion Windows PCs in use worldwide today.
How many Windows 7 holdouts remain?
If my estimates are accurate — 1.2 billion Windows PCs worldwide, with 1 billion running Windows 10 — then Microsoft will have successfully migrated more than 80% of its active customers to Windows 10 by the middle of 2020. Roughly 200 million PCs worldwide will still be running older Windows versions, mostly Windows 7.
That estimate lines up nicely with the most recent real-time traffic reports available from the United States Government’s Digital Analytics Program, which is the world’s largest credible source reporting actual, unfiltered web traffic analytics. The dataset includes nearly 700 million visits from Windows devices to a broad mix of sites for the six-week period ending December 14; the list includes sites that attract non-business visitors, including the National Weather Service and NASA’s Astronomy Picture of the Day; destinations designed for individuals doing government business (passport applications and Social Security claims, for example); and sites like the National Science Foundation and Centers for Disease Control, which serve businesses and educational institutions. It also includes visits to widely popular sites that cut across population lines, like the United States Postal Service and the Internal Revenue Service.
Here’s what the mix looked like:
Based on U.S. Government website traffic, nearly 1 in 5 visitors who use PCs are running Windows 7.
Data from US Digital Analytics Program
Do those numbers match up perfectly with the Windows installed base at large? No one knows for sure, of course, but I suspect any differences would be minor, probably no more than a few percentage points.
Meanwhile, I still see people citing data from NetMarketShare and StatCounter Global Stats. I addressed my reasons for skepticism about these data sources nearly three years ago, in January 2017, and nothing I’ve seen lately leads me to change my mind. For November 2019, StatCounter GS shows the Windows 10/Windows 7 split at 64.7% and 27.4%, while NetMarketShare’s (normalized) numbers show Windows 10 usage at 62% with Windows 7 at 31.2%.
The only way either number would be consistent with Microsoft’s reported base of 850-900 million active Windows 10 PCs is if the worldwide base of Windows PCs were nearly 1.4 billion. A much more likely explanation is that botnets masquerading as Windows 7 PCs are skewing the results. That’s an ongoing problem for both sites, which are driven by advertising networks.
NetMarketShare, for example, notes that 76% of the sites in its population «participate in pay per click programs to drive traffic to their sites.» That provides a powerful motive for scammers to rig the statistics. On its About page, NetMarketShare acknowledges that reality: «Bots and fraudulent traffic are responsible for a large and growing percentage of web traffic,» and the only question is what percentage of the fake clicks are able to evade these anti-fraud measures.
Regardless of which numbers you find most believable, the inescapable reality is that by the middle of 2020 hundreds of millions of PCs will be running an unsupported Windows version. That’s a massive target for online crooks, and a challenge for anyone who’s worried about the health of the PC ecosystem.
Featured
![]()
There have been various numbers thrown around suggesting how many people have downloaded Windows 10 and how many have the operating system installed. Great debates have started about just how accurate these figures may be, but as any statistician will tell you, the more data you have to work with, the more likely it is to give an accurate picture.
Microsoft announced that there were 14 million downloads in the first 24 hours after launch, and it has been estimated that this figure now stands at anything from 50 million to 67 million. UK-based data analysis firm GoSquared has put together a tool that shows, in real time, Windows 10 adoption around the world by indicating its share of Windows traffic.
It’s very hard to pin down an exact number of installations at this stage, but GoSquared’s figures make for very interesting reading. The company explains that its analysis draws on tens of thousands of sources, aggregating the data to give as accurate a picture as possible. So where does Windows 10 stand at the moment? As I write this Windows 10 accounts for 12 percent of traffic from Windows machines.
As the stats are updated in real time, there is visible fluctuation, and I have watched the number jump from 10 percent to 13 percent and then drop down again.
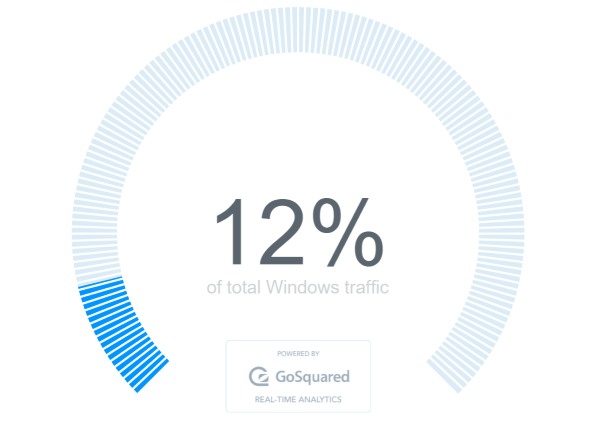
While it’s certainly interesting to see what’s happening right now, GoSquared’s data is more useful for seeing the general trend of Windows 10 adoption — and that trend is on a definite, steady climb. Since launch, Windows 10 hit a peak in terms of traffic share on 8 August when it hit almost 15 percent.
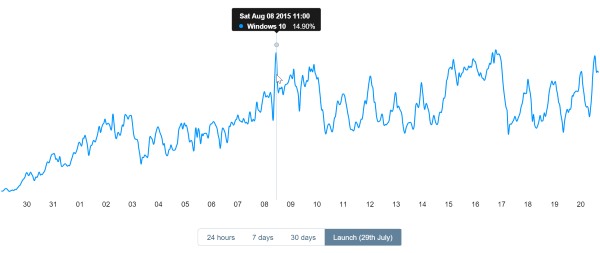
The company admits that the data may not give a completely accurate picture, saying: «In the scheme of things, it’s by no means definitive, but we feel the data shows interesting trends».
Take a look for yourself and see what you think.
Photo credit: rvlsoft / Shutterstock

(Image credit: Microsoft)
Microsoft has just kicked off Build 2017 with the unveiling that Windows 10 is now in use by over 500 million Windows 10 devices, up 100 million from the last major milestone back in September 2016.
As a reminder, Mirosoft counts not only Windows 10 PCs and tablets, but Xbox, HoloLens, and even Windows 10 Mobile in that number too. Unfortunately, Microsoft hasn’t detailed how many of those users are using Windows with a Microsoft account, or how many people out of that number are using universal Windows Apps on the regular.
Microsoft did reveal that 141 million users are now using Cortana, which is a bigger number than we were expecting. In an ideal world, all 500 million users would be using Cortana, but 141 million active Cortana users is still an impressive feat.
Of course, Microsoft’s original goal was to have Windows 10 in use by one billion users around about now, but the company is 500 million users short. Microsoft has been open about this in the past, saying they knew they wouldn’t be able to make it several months before their deadline of 2 years since the Windows 10 launch.
What do you think about the rate of new installs? Let us know.
Get the best of Windows Central in in your inbox, every day!
Zac Bowden is a Senior Editor at Windows Central. Bringing you exclusive coverage into the world of Windows on PCs, tablets, phones, and more. Also an avid collector of rare Microsoft prototype devices! Keep in touch on Twitter: @zacbowden.