Keeping your CPU temperature in check is one of the foundations of looking after your computer. A hot CPU can result in throttling, which can impact the clock speeds of your CPU and therefore slow it down. It can also cause BSoD crashes and your CPU to deteriorate quicker, giving it a shorter lifespan than it deserves.
To help you check your CPU temperature in Windows 10 and 11, this tutorial shows you the best tools to monitor it.
Content
- But First – What’s a «Bad Temperature»?
- How to Check CPU Temperature in Windows
- 1. Using Ryzen Master (AMD Ryzen CPUs only)
- 2. Using Throttlestop
- 3. Using HWMonitor
- 4. Using Open Hardware Monitor
- 5. Using Core Temp
- 6. Using Speccy
- 7. Using SpeedFan
- 8. Using HWinFO
- 9. Using MSI Afterburner
- 10. Using AIDA64 Extreme
- Frequently Asked Questions
But First – What’s a “Bad Temperature”?
Unfortunately, it’s not immediately obvious what a good or bad temperature for a processor is. If you see your processor’s idle temperature is 30°C (86°F), is that a good or bad idle temperature? What about 40°C (104°F), 50°C (122°F), 60°C (140°F), or 70°C (158°F)?
Let’s grab a quick summary of your CPU data by looking for “Device Specifications” under “Setting -> System -> About.” Take note of your processor name and details including the GHz frequency.

If you want to know what your processor’s max temperature is, search the Web for the product page of your specific CPU, then find where it lists the max ideal temperature for your processor. If the temperature is listed under something similar to “Maximum Operating Temperature” or “T Case,” then that’s the temperature that you should strive to keep your processor under most of the time.
On the other hand, if it says, “T Junction” (as in the image below), the general advice is to keep things at least 30°C (86°F) under this stated temperature. (In this example, we are striving to stay under 70°C / 158°F.) Either way, if your PC is under this temperature for most (or, ideally, all!) of the time, you’re doing fine.

Now that we know what the temperature limit is, it’s time to find out how to check CPU temperature in Windows. This requires the aid of third-party programs, to help keep tabs on how hot the processor is getting. Any of the software listed below will allow you to easily check the CPU temperature.
1. Using Ryzen Master (AMD Ryzen CPUs only)
This may only apply to the lucky ones who own a Ryzen CPU, but if you do, then it’s by far the most accurate way to track your CPU temperature, as it uses an AMD proprietary method to read the CPU temperature that other CPU monitoring software doesn’t have access to.
This makes sense, as Ryzen Master is widely used as an overclocking utility, which makes CPU temperature readings all the more critical.

You can download the tool online from the official AMD page. To use it, open the app to see the temperature. It can be compared with the maximum temperature limits supported by your processor.
Tip: want to boost your PC’s performance? Consider getting an eGPU.
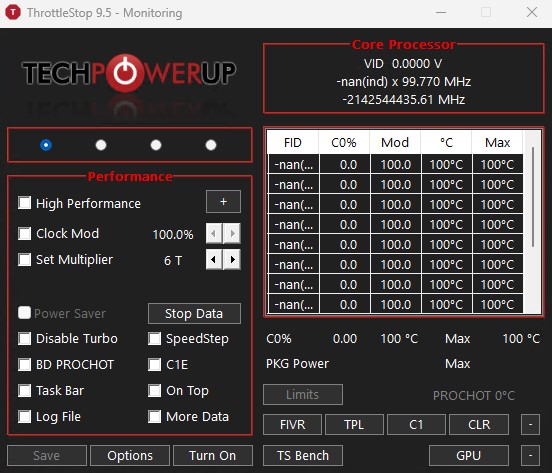
2. Using Throttlestop
We’ve discudsed the undervolting tool Throttlestop here at Make Tech Easier. (Check out our undervolting guide.) Briefly, the lightweight tool lets you undervolt your CPU to cool down temperatures and prevent throttling, which in turn allows your CPU to function more effectively.

It’s worth looking into undervolting if you want to cool down your CPU, but as an added bonus, you can also use Throttlestop as a CPU temperature monitor.
You can see each individual core temperature in the main Throttlestop window.

You can also get your CPU temperature to appear in the notification area on your PC. To do this, click “Options” at the bottom of Throttlestop, then in the middle, check the “CPU Temp” box. Now, every time you open Throttlestop, you’ll see a little number in your taskbar notification area showing your CPU temperature at that moment.

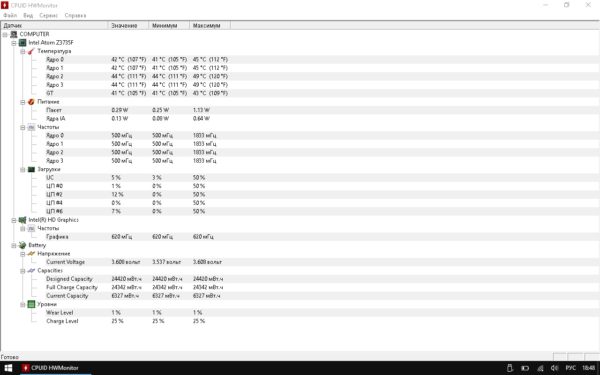
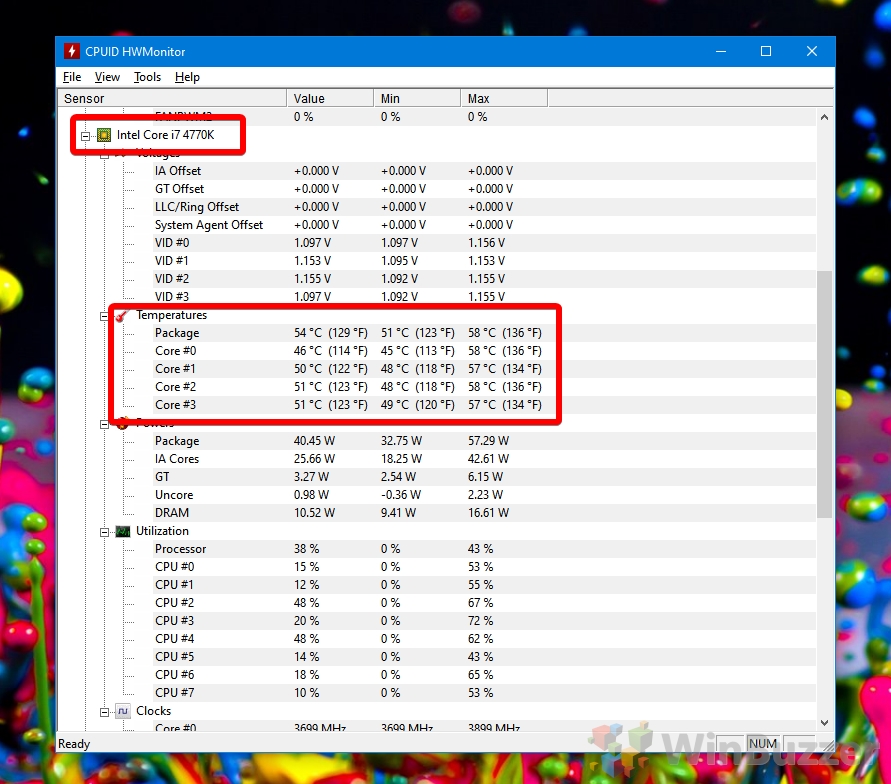
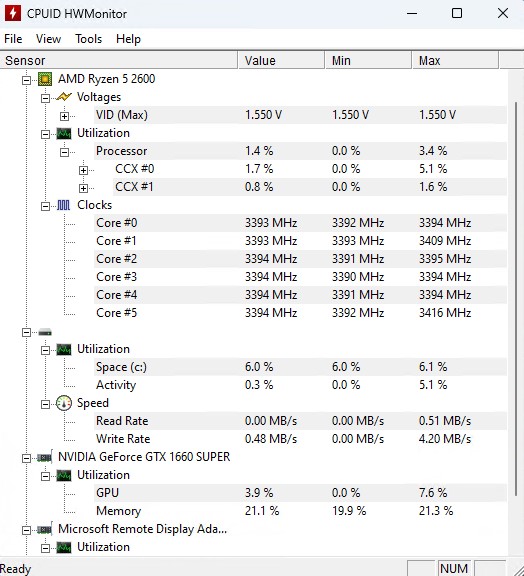
3. Using HWMonitor
HWMonitor does much more than just monitor CPU temperatures. On one screen, you’ll find all the information you need and much more.
- After installation, run the app as an administrator.
- In the main HWMonitor pane, scroll down to see your CPU listed with all its information.

You’ll see the voltage of each core, the amount of CPU being utilized, and – most importantly – the temperature of each core. It displays the current temperature as well as the minimum and maximum temperatures.
There’s not a ton to dig into here, as everything is displayed on that one screen. You can switch on a dark mode for those nocturnal monitoring sessions, switch on a status bar, and quickly save a log of your monitoring data with the Ctrl + S shortcut.
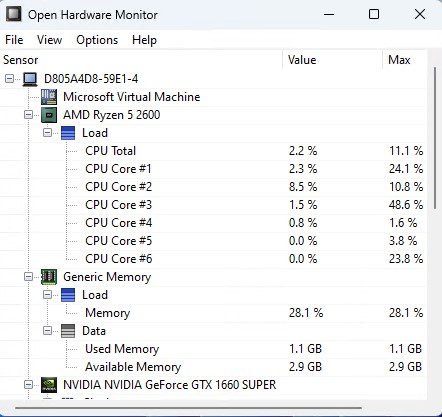
4. Using Open Hardware Monitor
Open Hardware Monitor is a nice solution for getting all of your needed statistics in one place. This includes your CPU’s temperatures as well as your GPU’s temperature, the voltages being used in your computer, and even how fast your system fans are going. This makes it a robust tool that allows you to keep an eye on all of your system temperatures.
You can find your CPU’s temperature under the category with your CPU’s name in it. It will list the temperature for each core your processor has.

Many of these temperature monitors allow you to put readings on your taskbar. This is particularly useful if you’re doing system-intensive tasks and want to keep an eye on your temperatures without darting back and forth between the active window and the system monitor.
If you’d like to see the CPU temperature in the taskbar, right-click the temperature itself and click “Show in Tray.”

If the reading ends up hiding in the “additional” icons section, you can drag it onto the main active tray so that it will always be visible as long as you can see the taskbar.
PC slower than usual? Learn how to fix “Windows Modules Installer Worker” high CPU usage with our handy tutorial.
5. Using Core Temp
If you’d like something a little more focused on the processor itself, Core Temp is a good choice when you need to check the CPU temperature in Windows.
Once installed, you can run the app to find everything you want to know about your processor, such as its name, the cores it uses, and its temperature.

It will even inform you of your processor’s T Junction limit, listed as “Tj. Max” above your temperatures. If you’d like to see the temperature in the system tray, it should be enabled by default. If it’s not, click “Options -> Settings.”

Click the “Windows Taskbar” tab, then “Enable Windows 7 Taskbar features -> Temperature -> OK.”

6. Using Speccy
Another all-in-one suite, Speccy, is a nice package of various systems diagnostics, including the ability to check CPU temperature in Windows.
As soon as you open Speccy, you’re shown all of the relevant temperatures you need to know for a healthy laptop. It’s also great for digging up information on your system, so make sure you remember this application, should you need information about your operating system or motherboard, for instance.

If you click on “CPU” on the left, you can get more focused information on your processor.

If you’d like the temperature to appear in the tray, click “View -> Options.”

Click “System tray -> Minimize to tray -> Display metrics in tray,” then select “CPU.”

Now when you minimize Speccy, you can keep tabs on how hot your CPU is running as you do other things.
Need to access Device Manager quickly? There are several methods to do so.
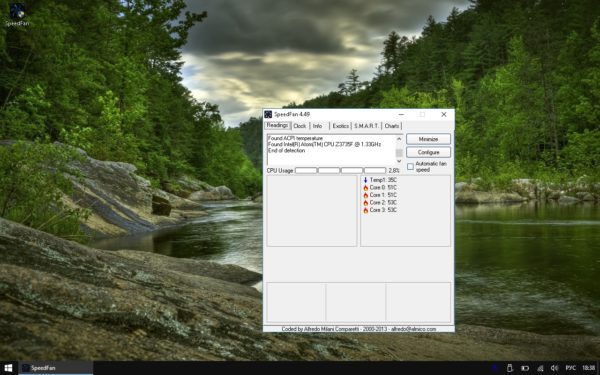
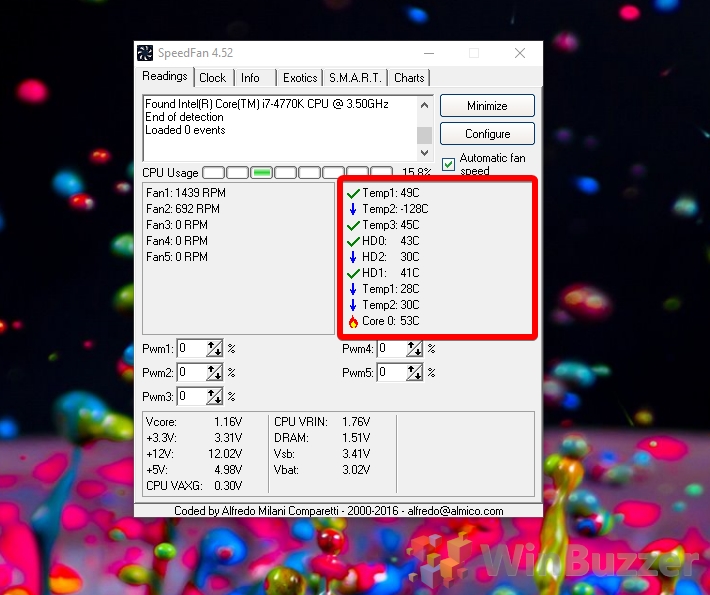
7. Using SpeedFan
This tool is a hardware monitoring software that can change fan speeds according to system temperatures. SpeedFan can read temperature values from your hard disks using your PC’S built-in temperature sensors.
This Intel-recommended system tool is available as a free trialware for 30 days. It supports older operating systems and CPUs as well as the latest versions. There are very few components to install. Always opt for the latest software version.

Once you launch the main SpeedFan screen, you will get a quick glance at all readings, including the hard disk temperature and CPU core temperatures, Core 0, Core 1, and so forth.

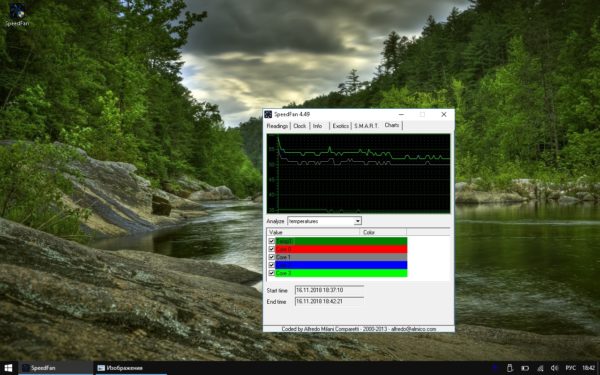
If you’re unable to view the temperature values, head to the “Charts” tab and check the labels for various temperature values. After you do this, the temperature readings are immediately visible in the “Readings” tab.

Click the “Configure” menu in the “Readings” tab. This will lead to a pop-up window where you can control the “desired” and “warning” limits for various temperature values. Apart from CPU temperature, you can configure fan speeds, voltage, and other actions on the motherboard.
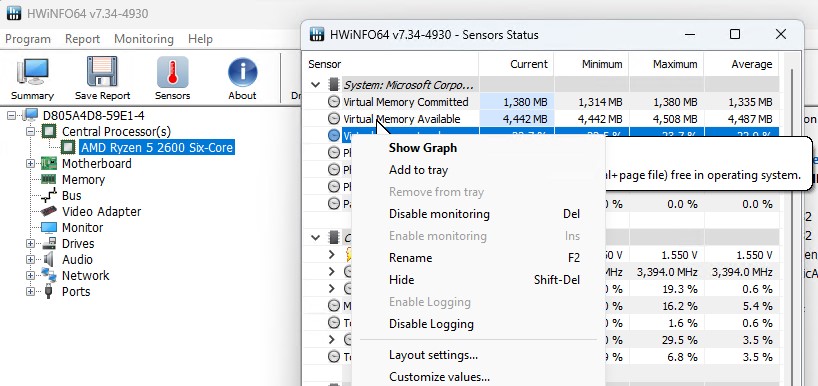
8. Using HWinFO
HWinFO is one of the most comprehensive free Windows diagnostics software. It supports a complete range of Intel processors, from Xeon/Atom to Core i9 as well as most AMD processors except the latest Ryzen family. HWinFO offers amazing graphic visualization features to alert you when your computer is heating up unexpectedly.
While there is a Pro and a portable version of HWinFO, you get plenty of valuable information from the free download installer.

After launching the dashboard, navigate to the “Sensors” tab. The software will display a warning message, as it uses an embedded controller (EC) sensor on your motherboard. It is safe to disable this warning as you temporarily experience a little bit of latency and delay in performance.

Check the temperature values for the various CPU cores under the “Sensors” status readings.

With a right-click, you can add these temperature values to the system tray. If you want to monitor your CPU’s temperature rise over time, click “Show Graph.” A graph to monitor CPU heat levels will pop up. Any unexpected temperature rise (during a heavy game or application) will trigger spikes.

9. Using MSI Afterburner
Designed with gamers in mind, and for those who want to overclock their PCs, MSI Afterburner doubles as an excellent tool to monitor your PC temperatures. Note that MSI Afterburner doesn’t play nice with all CPUs and is known not to show temperatures for AMD CPUs in particular.

Once you’ve installed and opened Afterburner, you should see a graph on its home screen showing your GPU temperature, CPU temperature, and various other data.
If you don’t see the temperature as an option, then your CPU might not be supported, but there is still hope! Open the app’s properties from a Settings icon. Under the “Monitoring” tab, click the three-dotted menu icon below.

You’ll see a list of plugins and can link MSI Afterburner to another tool that monitors CPU temperatures or check the “CPU.dll” option to pull in CPU temperatures.

To reorder the graphs and prioritize CPU temperature so that it appears near the top, click “Settings” in Afterburner, then the “Monitoring” tab. You’ll see a menu where you can tick which things you want to be displayed on the home screen and drag to the top the things you want to appear near the top.
Drag “CPU1 temperature,” “CPU2 temperature,” and all of the other CPU temperatures near the top of the graph and click “OK.” They’ll appear on the home screen in the order you chose.

When you select the “CPU” temperature, you can also tick the “Show in LCD Display” box so that it appears in the corner whenever you enter the shortcut for bringing up the OSD. (You can choose what key you want this to be by going to the “Profiles” tab in Afterburner’s settings.)
10. Using AIDA64 Extreme
AIDA64 Extreme is another all-inclusive diagnostics software with a special focus on CPU temperature values. There is a trial and evaluation version, which is free for 30 days. Apart from Windows, it also supports Ubuntu, iOS, Google Play, and other operating systems.
The AIDA64 Extreme software supports both Intel Core 13000 and AMD Ryzen 7000 series processors. It is one of the best system tools on the market for the latest GPUs, RAM, and SSD level.
Once you’re able to view the AIDA64 Extreme home screen, click “Computer -> Sensor.”

Under “Sensor,” you can view various sensor properties including CPU temperatures, CPU package temperatures, CPU IA Core temperature, and CPU GT Core temperature. But due to the usage of sensors, the CPU temperature rises very quickly. It is not advisable to keep the processor overheated for a very long time.

Want to do more laptop maintenance? Read our guide on how to fix Wmpnetwk.exe high CPU and memory usage in Windows.
Frequently Asked Questions
How does gaming impact CPU temperature?
Gaming is an important variable when it comes to CPU temperature. If you’re playing graphically intensive modern games, then not only will your GPU be under load, but your CPU too.
Again, CPU temperature limits vary greatly, but under heavy gaming load, it’s not uncommon for temperatures to soar into the 80s (176 °F). In most cases, this is perfectly safe (if a little hot on the palms for laptop users), and you only need to start worrying if you’re creeping up into the 90s (194 °F).
How long can a CPU run at high temperatures?
A healthy non-gaming laptop CPU is equipped to handle occasional spikes for several minutes when you’re performing a CPU stress test, playing GPU-intensive heavy games, or hooking your laptop to an external monitor. But prolonged exposure to very high temperatures can lead to thermal throttling, so it is not recommended to run a typical computer in this state for very long.
If you have a non-gaming laptop, try to avoid temperature rises beyond 80°C (176°F) for several hours at a stretch. Gaming laptops can take it up a few notches, but anything continuously over 90°C (194 °F) is not recommended even for these devices. Most gaming laptops have an internal safeguard mechanism to cool the CPU down to more manageable levels. You can operate them in their high 80s for much longer than a non-gaming one. You can also buy an external USB cooling pad to control an unpredictable temperature rise.
Can a CPU overheating damage it?
It is an urban myth that an overheated CPU can get permanently damaged. The CPU would shut itself off before that happens. But continuous high-temperature exposure surely leads to a decline in raw PC performance. That is why gaming laptops may become incredibly slow in just a few years’ time.
Being a vital part of your laptop, an overheating processor is a cause for concern. With third-party apps, however, you can easily check CPU temperature in Windows and ensure your processor is working as cool as it should.
How can I permanenly delete Ryzen Master from my PC?
Ryzen Master is one of those persistent programs that won’t remove itself from your Windows Apps or Control Panel. To uninstall it properly, open the Command Prompt in Administrator mode.
- Enter
wmic. This creates a command-line environment. - Type
product get name, which will give you a complete list of software and third-party apps installed on your device. - Type
product where name ="AMD Ryzen Master" call uninstall. - If prompted for a further “Yes” or “No”, enter
Y.
Image credit: Pixabay. All screenshots by Sayak Boral.

Sayak Boral
Sayak Boral is a technology writer with over eleven years of experience working in different industries including semiconductors, IoT, enterprise IT, telecommunications OSS/BSS, and network security. He has been writing for MakeTechEasier on a wide range of technical topics including Windows, Android, Internet, Hardware Guides, Browsers, Software Tools, and Product Reviews.
Subscribe to our newsletter!
Our latest tutorials delivered straight to your inbox
Here we have explained the best methods to check CPU temp on Windows 10 and Windows 11 including DIY tips to lower CPU temp.
Keeping tabs on CPU temperature is essential to keep your PC cool. If you are seeing that your CPU is too hot, it shut down abruptly, or act slow during intense task, then there are chance that your PC is overheting.
These days overheating has become a common problem that’s why we should all know how to see CPU temperature on Windows PC.
The benefit of regularly checking your CPU temp on Windows 10/11 is to overcome computer overheating problems.
Table of Contents
- How to check CPU temp on Windows 10/11 from your BIOS/UEFI
- How To Check CPU Temperature on Windows 10/11 Using Third-Party Application
- 1. Core Temp
- 2. HWInfo
- 3. NZXT CAM
- 4. Open Hardware Monitor
- What’s a Bad CPU Temperature?
- What is the Ideal CPU Temp?
- Why is my CPU Overheating?
- Tips To Minimize CPU Temperature Issues
How to check CPU temp on Windows 10/11 from your BIOS/UEFI
Let’s start with the DIY method for checking the CPU temps on Window 10/11 PC. As the Windows OS doesn’t have built-in utility to show temps so you have to rely on your PC’s BIOS or UEFI.
Here’s how you’ll get started:
- Press Windows Logo + I to open Windows Settings.
- Now Click on Update & Security tab at the bottom of settings index.
- Select the Recovery tab in the left sidebar. The new sidebar should load alongside the Update & Recovery panel.
- Scroll down to the Advanced startup heading and select the Restart now button.
- Your device will power down as usual and begin to restart. It should interrupt just before your typical boot and login procedures, and it will provide several advanced startup options.
- Select the Troubleshoot button.
- Select the Advanced options button. This is also where you can view the system restore and startup settings, as well as other recovery options.
- Select Restart. This should load your BIOS / UEFI interface, which for many Windows 10 users will include a CPU temperature readout.
Although this method is very simply you don’t have to install any additional tool. But the only drawback is that you have to restart twice your PC to check CPU temperature.
How To Check CPU Temperature on Windows 10/11 Using Third-Party Application
Third-party software privides the easiest and fastest way to check CPU temperature on Windows 10 and Windows 11. Instead of static readings the CPU temperature monitoring tools gives you more in-depth details.
There are several options out there that we have already covered in (13 Best CPU Temperature Monitor Software) You can use lots of their resources and compare services.
Here we have listed the top 5 popular free options.
1. Core Temp
Starting with the Core Temp which has simple and easy-to-use tool with clear temperature readouts for all of your CPU cores. Be careful during Core temp download and installation.
Because as a free program it tries to install bloatware, so you must uncheck some unwanted boxes during the Core Temp installation setup.
Once you’ve downloaded Core Temp and installed it. On opening core temp, it displays readings of current CPU temperature on Windows 10.
Related: Ultimate Guide To Check PC’s CPU temp on Windows
Core temp also displays the average CPU temperature reading at the bottom of the window.

2. HWInfo
Core Temp isn’t the only computer temperature monitor tool for Windows 10/11. You can also try the HWInfo monitor.
The HWInfo gives you more in-depth system monitoring details as compare to Core Temp. You can get full details about every piece of your PC’s hardware.
If you choose to run it in sensors-only mode, scrolling down to the CPU section, the dedicated section, not the CPU temperature portion of the motherboard listing—reveals current CPU temps and other nitty-gritty details.
The HWInfo is available in two versions called HWInfo32 and HWInfo64. The HWInfo portable version is also there which doesn’t require installation.
3. NZXT CAM

NZXT’s Cam software is another popular option to check CPU temperature on Windows 10. The NZXT Cam temperature monitor is equipped with diverse skillsets.
Its slick interface is easier to read at a glance than those on most other CPU temp monitoring tools.
This CPU heat monitoring program shows all sorts of useful info about your CPU, graphics card(GPU temperature), memory, and storage.
NZXT Cam also includes an in-game FPS overlay and overclocking tools, among other features.
You can also download NZXT Cam mobile apps to check CPU temperature on mobile phones. The NZXT cam software keeps tabs on your PC temp when you’re away from your system.
With NZXT cam software installed in your system, you shouldn’t worry that how hot should my CPU be?
4. Open Hardware Monitor
Another great open-source option that offers monitoring for a variety of components in a streamlined and customizable interface. It’s available for free, but you can donate to the developers.
These tools can quickly track your system information. Now you’ve got plenty of options! But to simply check the computer’s CPU temperatures, Core Temp’s our choice.
What’s a Bad CPU Temperature?
It’s not possible to explain bad or normal CPU temperature because each CPU model has a different temperature range.
If you see idle CPU temperature and noticed that it is at 30 C, is that a good CPU temperature or bad idle CPU temperature? What about 40, 50, 60, or 70 C? That’s a debatable issue!

If you want to know what the max CPU temperature is, search the Web for the product page of your specific CPU, then find where it lists the max ideal CPU temperature for your processor.
If the CPU temperature is listed under something similar to “Maximum Operating Temperature” or “T Case.”
Related: What’s The Safe/ Ideal GPU Temp Range While Gaming?
Then that’s the CPU temperature which you should strive to keep your processor under most of the time.
If it says “T Junction” (like above), the general advice is to keep CPU temperature at least 30 Celsius under this stated temperature.
(For the above example we’ll be striving to stay under 70 C.) Either way, if your PC is under this CPU temp for most (or, ideally, all!) of the time, you’re doing fine.
What is the Ideal CPU Temp?
- Most users should be looking for an average running temperature below 140°F (60°C). Cooler temps, in general, are better when it comes to PC hardware.
- Temperatures between 160°F (70°C) to 195°F (90°C) may be a cause for concern.
- Anywhere above that range? Your hardware is under serious stress at over 195°F (90°C).
Why is my CPU Overheating?
You will only encounter intense heat when you are running multiple programs or games at once. The temp spikes are linked with the heavey tasks or the CPU that is overclocked.
There are also other factors that you should be aware of.
- Poor maintenance, accumulated dust, malware, bad ventilation, and even undetected hardware problems can all contribute to heat-related issues.
- Older hardware is more susceptible because of lower heat tolerances at the date of manufacture.
- Thinner builds with performance components can also sometimes get too hot for comfort, simply because there’s more opportunity for heat to travel.
Tips To Minimize CPU Temperature Issues
There are many DIY solutions to lower CPU temperatures. You can use these free methods to make your processor temperature down to a more reasonable level. We have also published an article about 11 Ways to Prevent Computer Overheating.
Содержание
- 1. Как проверить температуру CPU
- 2. Как узнать температуру процессора средствами Windows
- 3. Какая температура считается нормальной
- 4. Как температура влияет на производительность
- 5. В чем причина перегрева процессора
- 6. Частые вопросы и ответы
Технические гайды для геймеров на ПК
- Как настроить Windows 10 для игр: максимальная производительность, игровой режим и другие советы
- Как узнать температуру процессора в Windows 10
- Как настроить мониторинг MSI Afterburner в играх: узнаем температуру и загрузку процессора и видеокарты
- Загрузка видеокарты в играх: как проверить, почему нагружена не на 100%, что такое раскрытие
Компьютерные компоненты неизбежно выделяют тепло, поэтому очень важно следить за температурными показателями. Современная электроника достаточно умная, чтобы не допустить поломки в случае перегрева. Тем не менее постоянная работа при повышенной температуре все равно не сулит ничего хорошего. Кроме того, из-за перегрева производительность системы может снижаться. Поэтому такие параметры, как температура нужно мониторить. Наш гайд актуален не только для Windows 10, но и для более ранних ОС вроде Windows 7, но проверяли все способы мы только на 10-ке.
Как проверить температуру CPU
Если в комплекте с вашим ноутбуком или материнской платой идет фирменное программное обеспечение для мониторинга параметров, то лучше им и пользоваться. Кроме показателей температуры, там можно настроить еще много других параметров: скорость вентиляторов, режимы производительности и т.п. У популярных брендов софт, как правило, хороший. Яркий пример — Armoury Crate от ASUS и Dragon Center от MSI.
Также можно использовать фирменные утилиты от производителя процессора: Intel Extreme Tuning Utility и AMD Ryzen Master Utility.
Если устанавливать программы желания нет, то температуру можно проверить и в BIOS. Но на самом деле это неудобно, так как во время нахождения в BIOS нагрузки на процессор нет. То есть вы поймете только температуру в простое.


Рассмотрим также популярные сторонний софт: Speccy, Core Temp, HWiNFO64, HWMonitor, MSI Afterburner, AIDA64, SpeedFan.
Speccy
Простая утилита на русском языке от создателей CCleaner. Легка в обращении, сразу после запуска показывает общую информацию о системе и выводит температуры. При нажатии на иконку температуры открывается график.

Core Temp
Простая бесплатная программа для мониторинга параметров процессора. Сложностей с ней возникнуть не должно: просто открываете программу, температура будет указана в первом окне. Показания температуры для каждого ядра также выводятся на панель задач, поэтому программу можно держать в свернутом состоянии. Есть русский язык, который нужно устанавливать дополнительно.

HWiNFO64
Продвинутая программа со множеством настроек и параметров. Запустите программу с галочкой Sensors-only, затем найдите строчку со своим процессором или материнской платой: для мониторинга температуры они используют разные сенсоры. Допустим, для процессора Ryzen 1600 можно смотреть показатель CPU (Tctl/Tdie).

Показатель Current означает текущую температуру (идет отслеживание в реальном времени), Average среднюю, Minimum и Maximum соответственно минимально и максимально зафиксированную с момента начала мониторинга. Чтобы сбросить эти значения, нажмите на значок часов на нижней панели.
Если дважды кликнуть на параметр, например CPU (Tctl/Tdie), то откроется окно с графиком. Это полезно, если вам нужно визуально представить общую картину на определенном временном отрезке.
HWMonitor
Утилита от создателей знаменитой CPU-Z, которая такая же простая в обращении. Как и в HWiNFO64 можно смотреть температуру с нескольких датчиков: процессора и материнской платы. Чтобы обнулить минимальные, максимальные и средние показания в верхней строке нажмите View и выберите Clear Min/Max.

MSI Afterburner
Для отслеживания температуры CPU во время игр, удобнее всего использовать экранный оверлей программы MSI Afterburner. Зайдите в настройки, далее «Мониторинг». Найдите строку «Температура ЦП», поставьте галочку слева и далее уже ниже отметьте пункт «Показывать в ОЭД». Можно также выбрать отдельные ядра процессора для мониторинга. После этого в игре должны отображаться выбранные параметры, которые можно контролировать без отрыва от геймплея. Имеет смысл также настроить и остальные параметры: загрузку и температуру видеокарты, использование оперативной памяти и т.п. Программа на русском языке.

AIDA64
Функциональная и сложная программа, к тому же еще и платная. Но для наших целей хватит и пробной версии. Посмотреть температуру процессора просто: раскройте выпадающий список «Компьютер» в левой части программы, затем выберите «Датчики». В правой части программы откроется окно, где можно посмотреть температуры ЦП и других компонентов. Программа на русском языке.

SpeedFan
Некогда популярная программа для регулировки скорости вращения вентиляторов и сейчас чувствует себя неплохо. Есть версии для современных ОС. Можно посмотреть текущие температуры, а также включить график.

Откройте командную строку (CMD) или PowerShell от имени администратора. Можно просто ввести поисковой запрос в поле поиска. Введите следующие команды:
- для командной строки: wmic /namespace:\rootwmi PATH MSAcpi_ThermalZoneTemperature get CurrentTemperature
- для PowerShell: get-wmiobject msacpi_thermalzonetemperature -namespace «root/wmi»

Ищите строку CurrentTemperature. В нашем случае значение составляет 3292. Чтобы перевести это в градусы по Цельсию, делим число на 10 и отнимаем 273,15.
3292 / 10 — 273,15 = 56,05
Также в PowerShell можно сразу вывести температуру в градусах Цельсия. Нужно набрать следующее:
$CPUt = Get-WmiObject MSAcpi_ThermalZoneTemperature -Namespace «root/wmi»
$currentTempKelvin = $CPUt.CurrentTemperature[0] / 10
$currentTempCelsius = $currentTempKelvin — 273.15$currentTempCelsius
Внимание! Если появится сообщение, что функция не поддерживается или параметр CurrentTemperature всегда одинаковый, то на вашей системе этот способ не работает.
Какая температура считается нормальной
У каждого процессора есть своя критическая температура. Критическая температура — это максимальная температура, допустимая на кристалле процессора. Ее превышение может привести к нестабильной работе или даже необратимым негативным последствиям.

У Intel ищите параметр T junctionУ Intel ищите параметр T junction
Максимальная температура процессоров может быть высокой, например, 95 градусов и более, а может быть и низкой — всего 61 градус. Именно такой показатель у легендарного AMD FX-8350. Обязательно смотрите спецификации своего процессора на официальном сайте. Тем не менее, если процессор работает при температуре близкой к максимальной, это тоже не норма. Наоборот, надо выяснять причину, но об этом мы поговорим далее.

Вычислить оптимальную температуру просто: отнимите 25-30% от максимальной и получите рекомендуемую температуру процессора под нагрузкой. В целом, оптимальными считаются температуры 60-70 градусов в нагрузке и 30-50 в простое, если это десктопный CPU.
Для ноутбучных процессоров, как правило, характерны более высокие максимальные и температуры. Так, у мобильного AMD Ryzen 9 5980HX этот показатель составляет 105 градусов. Также мобильным процессорам чаще приходится работать при более высоких температурах. При интенсивной нагрузке они могут доходить до 90-95 градусов и даже выше.
Обратите внимание, что в играх температуры могут быть ниже, чем в стресс-тестах, так как игровая нагрузка на железо ниже, чем синтетическая. У ноутбуков в играх может быть высокая температура, чем в стресс-тестах, из-за дополнительной нагрузки на видеокарту. Система охлаждения GPU и CPU там, как правило, комбинированная.
Как температура влияет на производительность

Опасаться, что процессор может сгореть от перегрева не стоит. Встроенная система защиты этого не допустит. Но халатно относиться к высоким температурам все же не стоит. При достижении определенной температуры процессор начинает троллить, то есть пропускать такты, пытаясь снизить температуру. Производительность от этого, конечно же, падает. Температура, после достижения которой, начинается троттлинг зависит от процессора. И опять, же отталкивать тут надо от максимально допустимой температуры. Но в любом случае, все, что выше 100 градусов — это очень плохо.
В чем причина перегрева процессора
Что делать, если температура процессора высокая. Не паниковать! Есть несколько основных причин перегрева:
- Плохой продув корпуса. Если корпус с глухими стенками, в нем недостаточно вентиляторов, они неправильно установлены или же провода перекрывают воздушные потоки, то хорошего продува не будет.
- Вентиляционные отверстия забиты пылью. Уборку в корпусе необходимо делать хотя бы раз в год, но лучше каждые полгода чистить фильтры. У современных моделей они съемные и легко доступны.
- Слабый кулер. Каждый процессор имеет определенный теплопакет, который указывается в характеристиках как TDP. Если кулер не может рассеять столько тепла, то будут перегревы.
- Вирус-майнер. Возможно, процессор нагружен вирусом. Проверьте в диспетчере задач, что именно грузит CPU. Узнайте в интернете, что делает этот процесс и если нужно завершите его. В дальнейшем вирус нужно удалить при помощи антивируса или других средств для удаления вредоносных программ.
- Разгон. Чрезмерный или неправильный разгон может привести к повышению температур. Даже при грамотном разгоне желательно ставить более мощное охлаждение.
- Плохая термопаста. От времени термопаста может высохнуть и потерять свои свойства. Кроме того, она может быть и вовсе изначально плохо нанесена. Здесь поможет только снятие кулера и осмотр процессора.
- Плохой прижим кулера. Это редко, но все же случается. Если процессор показывает высокую температуру, а сам радиатор при этом немного теплый, то что-то не в порядке с контактом поверхностей.
- Слишком жарко в комнате. Если у вас нет кондиционера, то летом температура процессора может повышаться из-за жары. А зимой комплектующим может мешать, например, горячая батарея, рядом с которой стоит системник.
Частые вопросы и ответы

Что делать, если температура ядер процессора разная? Ничего не делать, это нормально, ведь ядра могут быть нагружены неравномерно. Если температура не превышает критические значения, то не беспокойтесь об этом.
Как вывести температуру процессора на экран? Проще всего с помощью MSI Afterburner. Подробнее читайте выше по тексту.
Как отобразить температуру процессора на панели задач? Это умеет программа Core Temp. Читайте о ней выше по тексту.
Как узнать температуру процессора онлайн? Мы не нашли рабочего способ мониторить температуру онлайн. Если вы знаете о таком, поделитесь в комментариях.
Температура процессора на ноутбуке 100 градусов, это нормально? Нет, это многовато даже для ноутбука. Вреда, скорее всего, не будет, так как максимальные температуры ноутбучных процессоров составляют и более 100 градусов (см. характеристики). Но приемлемой температурой можно считать 90-95 градусов под нагрузкой.
- Какой процессор купить в начале 2021 года: подбираем CPU под любой кошелек
- Какую клавиатуру выбрать для игр и набора текста в начале 2021 года: от 2 000 рублей и до бесконечности
- Как узнать, какой у меня компьютер (процессор, видеокарта, оперативная память)? Инструкция для новичков
Перегрев процессора в компьютере может быть вызван многими факторами, например, неправильным охлаждением или неадекватным разгоном, а так как данный компонент является важнейшей составляющей ПК, контролю его температуры следует уделять особое внимание.
Для чего нужен контроль температуры процессора
В результате перегрева процессора в ходе работы компьютера могут иметь место такие неприятности, как:
- различного рода ошибки,
- зависания,
- внезапные перезагрузки,
- выход ПК из строя.
Чтобы избежать этих и других проблем, температуру процессора необходимо контролировать. Сделать это можно как с помощью встроенных в Windows 10 инструментов, так и с применением специальных сторонних программ.
В большинстве случаев узнать температуру процессора компьютера можно без скачивания и установки каких-либо программ или утилит. Windows 10 позволяет прекрасно осуществить измерения такого рода штатными средствами.
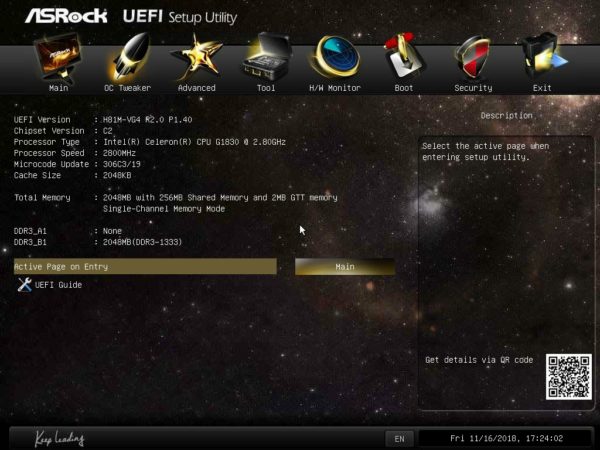
С помощью BIOS (UEFI)
Одним из основных способов контроля температуры процессора без использования стороннего программного обеспечения является её мониторинг в BIOS (UEFI). За редким исключением данная информация доступна в любом устройстве. От вас потребуется зайти в BIOS (UEFI) и найти нужную информацию.
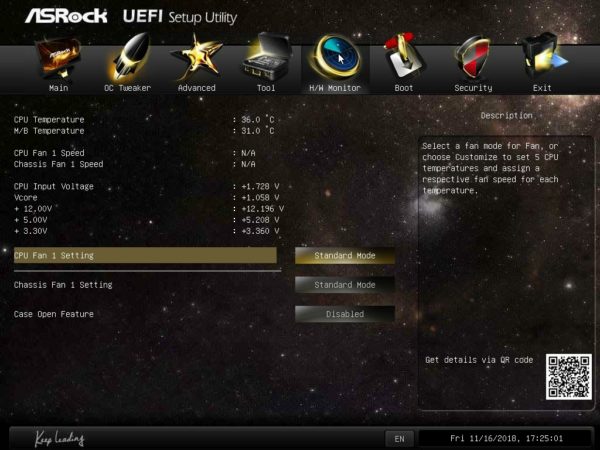
- Чтобы попасть в BIOS (в примере это ASRock UEFI BIOS), во время загрузки компьютера несколько раз нажмите клавишу Delete (в зависимости от модели и типа устройства это могут быть также кнопки F2, Esc и другие, в том числе комбинации). Откроется главный экран настроек. В некоторых компьютерах необходимая информация может находиться здесь же, в числе основных характеристик «железа». В англоязычных версиях BIOS ищите строку CPU Temperature или CPU Temp, либо что-то похожее.

Примерно половина БИОСа не имеет перевода на русский - При отсутствии показаний датчиков температуры на главном экране вам необходимо найти раздел PC Health Status (Status, Hardware Monitor, Monitor), в случае с ASRock UEFI BIOS это H/W Monitor, и перейти в него. Откроется окно мониторинга с необходимыми данными.
Не следует особо ориентироваться на показания температуры в БИОС, так как процессор в этот момент практически не загружен - Сейчас в BIOS лучше ничего не изменять и не сохранять при выходе, поэтому нажмите «Discard Changes and Exit». Компьютер перезагрузится.
После нажатия на кнопку «Выход» компьютер перезагрузится

Помимо несомненного плюса данного способа — его простоты, имеется один существенный минус — вам доступна информация о температурных режимах процессора вне загрузки основной операционной системы. Компьютер в этот момент практически простаивает.
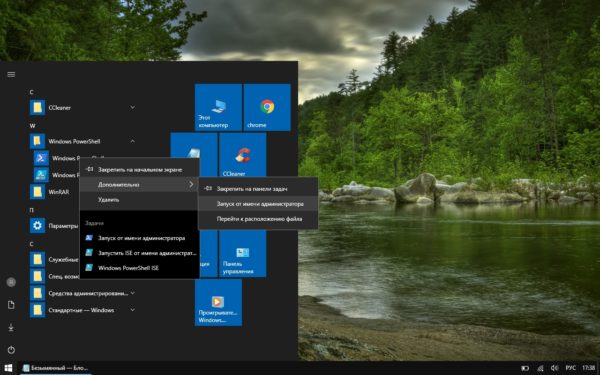
Через Windows PowerShell
В реальных «полевых» условиях в Windows 10 температуру процессора можно посмотреть, воспользовавшись мощным средством PowerShell. В зависимости от аппаратной конфигурации работать данный способ может не на всех устройствах:
- Запуск PowerShell осуществляется от имени администратора из меню «Пуск». В приведённом примере система не нагружена, но вы можете запустить что-либо (например, браузер или плеер с видео) в фоне для имитации рабочей среды.

PowerShell — это оболочка командной строки Windows, предназначенная специально для системных администраторов - В окне PowerShell введите get-wmiobject msacpi_thermalzonetemperature -namespace «root/wmi». В выпавшем списке найдите строку CurrentTemperature — это и есть температурный показатель в Кельвинах.
Внешне редактор PowerShell выглядит и функционирует так же, как и окружение командной строки cmd.exe - Запустите калькулятор, введите полученное значение, разделите его на 10 и отнимите 273,15. Таким образом осуществляем конвертацию в градусы по Цельсию.
Температура ядер процессора может существенно отличаться от общих показаний

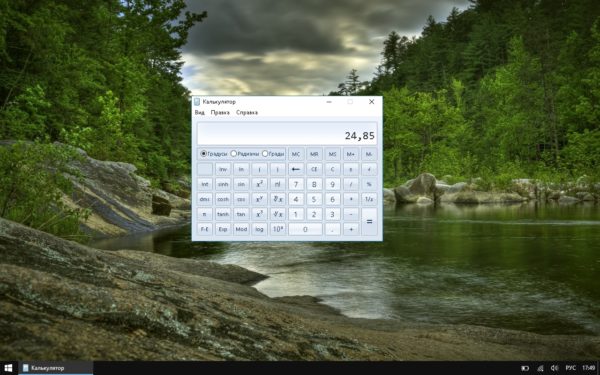
На некоторых компьютерах PowerShell может вывести сразу несколько показаний температуры. Обычно это нагрев возле процессора и разогрев ядер. Температуры снаружи (первое) и внутри (второе) могут существенно разниться, следует иметь это в виду.
Программы для диагностики
Существует большое количество сторонних утилит и программ для мониторинга температуры процессора компьютера на Windows 10. Многие из них универсальны, позволяя:
- контролировать нагрев процессора, видеокарты, материнской платы;
- получать другую информацию об аппаратной и программной среде;
- тестировать ОЗУ, жёсткие диски и другое.
Aida64
Инструмент Aida64 можно смело назвать настоящим диагностическим комбайном, позволяющим осуществлять самые разные измерения и проводить тестирование элементов компьютера и операционной системы. Программа является платной, на ноябрь 2018 года её стоимость составляет 2265 рублей на официальном сайте, но функционал данного программного комплекса стоит этих денег. Кроме того, у приложения имеется 30-дневный бесплатный период с некоторыми ограничениями в функционале, но, как правило, рядовому пользователю и этого бывает вполне достаточно.
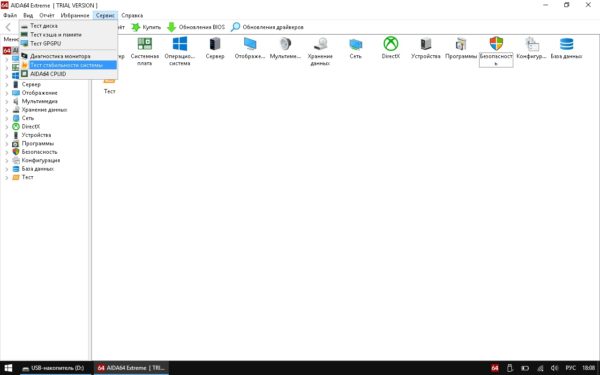
- Чтобы определить температуру процессора в Aida64, программу необходимо скачать с официального сайта и установить (существует портативная версия, не требующая установки). Установка и запуск приложения не сопряжены с какими-либо трудностями, с этим справится любой пользователь ПК. На главном экране программы выберите «Сервис». В выпадающем списке нажмите «Тест стабильности системы».
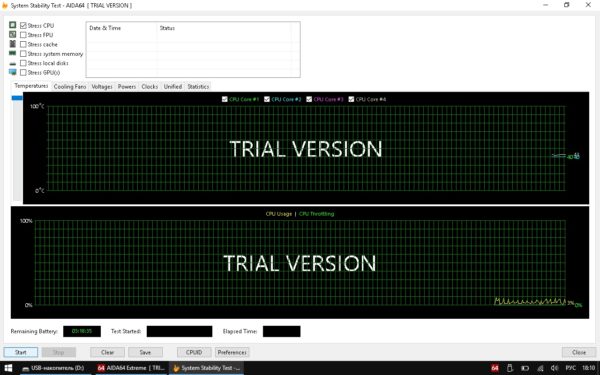
Функционал Aida64 — самый богатый в сравнении с аналогичными программами - В появившемся окне снимите все галочки в списке в левом верхнем углу, кроме Stress CPU. Вы увидите графики температуры ядер и загруженности процессора в реальном времени. Однако эти значения «холостые», так как процессор не нагружен.
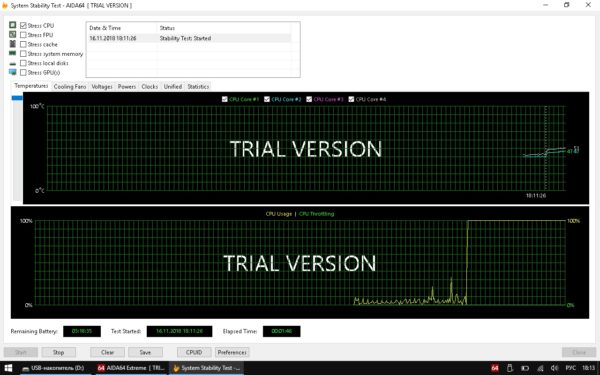
В нижнем окне показана загрузка CPU - Чтобы проверить температуру в стрессовых условиях, нажмите Start. Вы можете осуществлять контроль как всех ядер одновременно, так и по отдельности, поставив или сняв соответствующие отметки. Результаты мониторинга можно сохранить в файл, нажав кнопку Save.
В любой момент вы можете прервать тест
Aida64 обладает следующими возможностями:
- мониторит аппаратную часть в целом и системные компоненты по отдельности;
- тестирует обороты вентиляторов;
- выполняет замеры температурных режимов и режимов питания;
- отслеживает состояние памяти ПК;
- выявляет ошибки, сбои и неполадки;
- может тестировать видеокарты различных производителей;
- выполняет диагностику ОЗУ;
- диагностирует программное обеспечение компьютера;
- оптимизирована для работы с Windows 10;
- имеет удобный и логичный интерфейс;
- может сохранять в файл детальную информацию о проведённых диагностических процедурах.
Преимущества Aida64:
- большое количество средств диагностики и тестирования производительности операционной системы;
- расширенный мониторинг системной платы, ОЗУ и других аппаратных компонентов ПК;
- постоянное обновление и улучшение компонентов приложения;
- есть Portable-версия программы;
- пробная версия бесплатна;
- есть поддержка Windows 10 (32, 64 bit);
- есть русский язык.
Недостатки программы Aida64:
- ограниченное время бесплатной версии;
- относительно высокая стоимость утилиты;
- отсутствуют инструменты по рекомендациям и устранению обнаруженных в ходе тестирования проблем.
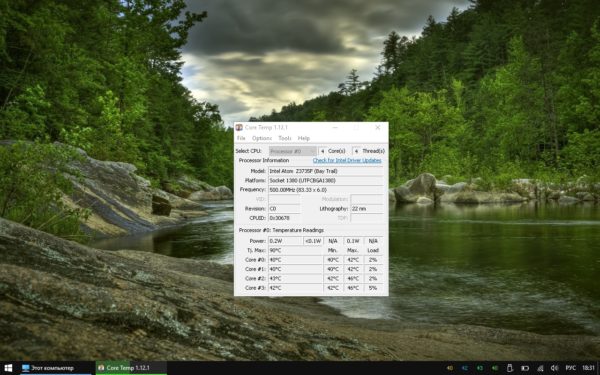
Core Temp
Бесплатная программа Core Temp позволяет контролировать температуру процессора в режиме реального времени, показывая данные по всем имеющимся на борту ядрам. Утилита поддерживает линейки Intel Core, Core 2, AMD64, AMD K8. В ходе установки программы вы можете дополнительно загрузить необходимый вам языковой пакет, включая русский. В окне выводятся показатели температуры ядер и другая информация о процессоре.
Core Temp также может:
- защитить ваш процессор от перегрева (функция включается в разделе Options);
- оповестить вас о превышении допустимых значений;
- сохранить данные и все изменения в файл.
Плюсы программы:
- бесплатна;
- оптимизирована для работы Windows 10 (32, 64 bit);
- работает с разными системными платами;
- часто обновляется;
- умеет импортировать данные в Excel;
- присутствует русский язык.
Минусы Core Temp
- отсутствует автозапуск,
- древний интерфейс.
Во время инсталляции будьте очень внимательны, программа пытается «подсунуть» в установку кучу Яндекс-сервисов и другого подобного софта. Не торопитесь и снимайте все ненужные вам галочки.
SpeedFan
Бесплатное приложение SpeedFan — простой, но эффективный софт, позволяющий контролировать и менять скорость вращения вентиляторов. Данная программа показывает также температуру аппаратной комплектации компьютера, включая процессор. Загрузка и установка SpeedFan не имеет подводных камней и предельно проста. После запуска все данные сразу же видны на экране.
Переключившись на вкладку Charts, вы можете видеть данные в графическом режиме. Показания основного датчика высвечиваются в трее.
Другие особенности SpeedFan:
- умеет не только показывать, но и анализировать данные;
- предоставляет точные сведения о режимах (скоростях) работы вентиляторов;
- имеет поддержку S.M.A.R.T., необходимую для анализа жёстких дисков;
- имеет возможность осуществлять регулировку скоростей вентиляторов;
- умеет анализировать состояние жёстких дисков через Web.
Достоинства SpeedFan:
- подтверждённая пользователями достоверность измерений температуры процессора,
- может регулировать частоты вращения вентиляторов,
- оптимизирована под Windows 10,
- обладает большой онлайн-базой по жёстким дискам,
- умеет менять частоты на системной шине;
- есть русский язык,
- программа бесплатна.
Недостатки утилиты
- по отзывам пользователей, может вызывать проблемы со стабильностью системы;
- имеет не слишком привлекательный интерфейс.
HWMonitor
Утилита HWMonitor — одна из наиболее информативных бесплатных программ такого рода. Приложение не требует установки, не мусорит в системе и не навязывает ненужных сервисов. Возможности HWMonitor впечатляют, это, например:
- мониторинг температуры процессора и видеокарты;
- диагностика уровней напряжения и скорости вращения вентиляторов;
- получение информации с датчиков блоков питания и дисков.
Утилита показывает температуру ядер процессора в формате «значение-минимум-максимум». Ориентироваться лучше всего на средний показатель, хотя на максимальные уровни тоже следует обратить внимание. В случае, если температура процессора вашего компьютера является повышенной, HWMonitor укажет на это, а также сравнит показатели с оптимальными.
Прочие особенности HWMonitor:
- программа отображает скорости вращения вентиляторов,
- информация при желании сохраняется в виде текстового документа,
- имеется поддержка видеокарт Nvidia,
- умеет показывать температуру и в фаренгейтах, и в градусах.
Плюсы:
- утилита обладает приятным минималистичным интерфейсом;
- есть текущие, минимальные и максимальные показатели;
- часто выходят обновления;
- программа, несмотря на мощный функционал, очень компактна и не требует установки;
- поддерживает операционную систему Windows 10;
- есть русский язык (частично);
- программа бесплатна.
Недостатки
- некоторые пункты меню не переведены на русский,
- в сохранённом файле предоставляется усечённая информация.
Какова нормальная температура процессора?
Этот вроде бы простой вопрос на самом деле не имеет точного и однозначного ответа, так как рабочие температуры процессоров разных производителей, линеек, марок и типов очень сильно разнятся. Влияет на показатель загруженность процессоров, возраст и конфигурация ПК и многое другое. В любом случае можно ориентироваться на информацию в таблице.
Таблица: сравнение температурных режимов Intel и AMD
| Процессор | Рабочая температура в режиме простоя | Рабочая температура в режиме нагрузки | Максимально допустимая температура |
| Intel | 28 – 38 °C (с индексом K — 30–41 °C) | 40 – 62 °C(50 – 65 °C, до 70 °C для i7–6700K) | 67 – 72 °C |
| AMD | 30 – 40 °C | 40 – 60 °C | 65–75 °C (FX-4300, FX-6300, FX-8350, FX-8150 — 61 °C) |
При достижении температур 90–100 °C большая часть парка процессоров переходит в режим троттлинга (пропускают такты), при значениях ещё более высоких — отключается.

Стоит также сказать, что на температурный режим процессора влияют следующие факторы:
- температура окружающей среды — при её повышении на 1 °C нагрев процессора увеличивается на 1,5 °C;
- внутренний объём системного блока — большое свободное пространство в корпусе ПК может существенно улучшить ситуацию с нагревом;
- расположение системника — отрицательно на температуре блока (и, следовательно, процессора) сказывается нахождение корпуса в «компьютерном» отделении стола, возле стен и особенно у радиаторов отопления;
- пыль — одна из основных помех теплоотводу воздуха из компьютера.
Что делать при повышенной температуре
Как уже писалось, при температуре 90–100 °С (в зависимости от типа CPU) процессор входит в режим троттлинга. Компьютер начинает тормозить, «глючить» и перезагружаться. Происходит снижение производительности. Дальнейшее функционирование ПК в таком экстремальном режиме обычно приводит к выходу процессора (и других элементов) из строя.
Чтобы этого не случилось, важно контролировать температурный режим процессора с помощью описанных выше средств, а если показания на вашем ПК превысили допустимые значения, проводить мероприятия в следующей последовательности по их значимости:
- осмотреть системный блок на наличие пыли — в домашних условиях последняя удаляется пылесосом с узкой насадкой (прежде рекомендуется снять вентилятор с кулера процессора и особое внимание уделить радиатору);
- обратить внимание на расположение системника — убрать корпус из стола, отставить от стены, батареи;
- заменить термопасту процессора, сделать апгрейд системы охлаждения, провести ревизию кулера — данные шаги требуют знаний и опыта обращения с компьютерными компонентами и обычно проводятся специалистами сервис-центров;
- попробовать снизить напряжение питания процессора в BIOS (внимательно изучив инструкции для вашего «железа») — это крайний шаг, работает не на всех компьютерах, но может использоваться как временное решение или в ситуации, когда невозможно провести ремонт и профилактику устройства (например, если это планшет);
- также может помочь перевод операционной системы в низкопроизводительный режим питания, удаление тяжёлых программ.
Видео: как «скальпировать» процессор и заменить на нём термопасту
Отзывы пользователей
Чтобы избежать выхода персонального компьютера из строя в результате перегрева процессора, необходимо регулярно осуществлять мониторинг данного элемента с помощью встроенных или сторонних программ и не забывать своевременно проводить технические мероприятия по профилактике потенциальных проблем, которые могут возникнуть при высокой температуре.
- Распечатать
Оцените статью:
- 5
- 4
- 3
- 2
- 1
(7 голосов, среднее: 2.7 из 5)
Поделитесь с друзьями!
Is the CPU on your computer so hot so often? You could face performance issues, automatic reboots, etc. if you answer yes to those questions. Windows 10 CPU temperature should be regularly monitored to ensure the health of your computer.
If the CPU becomes overheated, not only will the performance of the computer be affected, but the lifespan of the computer will be diminished as well.
People tend to find the process of checking CPU temperature confusing since it involves a number of steps. I am writing this post for those of you who are also among them. Here’s how to check the CPU temperature on a Windows 10 computer.
If you have a device running Windows, you can check its CPU temperature easily. It is not possible to check the CPU temperature as a built-in feature in Windows 10.
You can easily get CPU info, including the temperature, from a number of other software applications.
What is a Bad Temperature?
Ideally, we should know what is a bad temperature and what is a good temperature before going forward. The limit of the temperature varies from CPU to CPU. So if you want to know what your CPU’s temperature limit is, then you have the search for your specific CPU on the web.
If you see the temperature listed as “Maximum Operating Temperature” or “T Case”, this is what your CPU’s temperature should be. If the temperature is listed as “T Junction”, it means you should keep the CPU temperature 30°C lower than what written there. For example, if you see 100°C written next to the T Junction, it means you should strive to maintain your CPU temperature at around 70°C.
Then we will talk about the possible ways to verify CPU temperature now that we know what bad and good temperature is. On Windows 10, there is no inbuilt way to check the CPU temperature.
In order to monitor the CPU temperature, you have to use third-party programs. Here are some of the best third-party programs for checking CPU temperature that we have gathered. Browse through them now.
Monitor Your CPU and GPU temperature
Always monitor your CPU and GPU temperature using one of the following methods to make your system run smoothly.
1. HWMonitor
In addition to monitoring the CPU temperature, HWMonitor lets you check the temperatures of the hard drive, graphic card, and motherboard. You can check the CPU temperature in Windows 10 by following the following steps.
1. On your Windows 10 computer, you will need to download HWMonitor. Please click here for more information.
2. To install the software, simply follow the instructions on the screen. The temperature table will look similar to the one shown below after successful installation.

3. To check the CPU temp, scroll down to find the related temperature section.

2. MSI Afterburner
MSI Afterburner is another great tool to check CPU temperature on Windows. High-end gamers will find this tool useful. Furthermore, this tool displays GPU temperature, along with other useful data such as CPU speed and power of the computer.

The first thing you need is the MSI Afterburner. Click here to do so. When the installation is complete, you will be presented with the graphic displaying the temperature of the CPU and GPU, as well as other important information.
3. Core Temp
You can keep an eye on the CPU temperature, or processor temperature, with the help of Core Temp. Including the ideal temperature and all the necessary information, it will give you an overview.

Core Temp’s icon will appear under the system tray once you have downloaded and installed it. You can enable it manually if it’s not enabled by default. Click on “Options” and then “Settings” to do so.
Mark the checkbox before “Enable Windows 7 taskbar feature” in the “Windows Taskbar” tab. Click the “Ok” button when you’ve selected the “Temperature” box.
4. NZXT Cam
As another application that monitors your CPU and GPU temperatures, NZXT CAM will also notify you when your temperatures get too high. When you need to turn them down, NZXT Cam also sends you an automated message.
As with MSI Afterburner and RivaTuner, NZXT Cam lets you monitor your FPS, temperature, bandwidth, and much more. If you have installed your system and GPU overclocking, NZXT Cam also lets you control the RGB lighting.
There is no charge for NZXT Cam. There will, however, be many emails and pop-ups advertising in the future. With NZXT Cam, you can also check your CPU and GPU temperatures remotely from your mobile device. Remote computer control will also be possible with the app.
5. CUPID HWMonitor
CUPID HWMonitor is the best application for monitoring CPU and GPU temperatures.
HWMonitor displays all the sensor data from the motherboard, including temperatures, voltage, fan speed, power supply, hardware utilization, clock speed, and fan speed.
With HWMonitor, you will be able to look at your network and manage your devices without taking up a great deal of space on your machine. Sensors come in three different value ranges in HWMonitor: maximum value, minimum value, and current value. CUPID HWMonitor is useful for monitoring your hardware and overclocking or undervolting your system.
Best CPU Temperature Monitor
- SolarWinds CPU Load Monitor
- Atera
- HWMonitor
- Open Hardware Monitor
- Core Temp
- Paessler CPU Monitoring with PRTG
- HWiNFO
- SpeedFan
- AIDA64 Extreme
- Rainmeter
If you are only interested in CPU Temperature, I recommend using Open Hardware Monitor.
To discover performance issues, I suggest you use HWiNFO, as it provides detailed information on CPUs, GPUs, drivers, mainboards, and more.
A normal temperature range is defined as 40°C and 65°C (104°F to 149°F) in normal use. If you’re playing games and editing, you expect to reach 65 to 80.
Your cooling system and external environment could affect how high the temperature goes. The main point you should note is, that the CPU is made from silicon, which means it should be kept within a limit of 85 degrees.
If you go above this limit, the CPU might be seriously damaged.
How to Lower CPU and GPU Temperatures
The following tips will help reduce CPU and GPU temperatures.
Every once in a while, I recommend that you monitor GPU and CPU temperature. Our computers are based on CPUs and GPUs. Consequently, working at a safe temperature is crucial.
In an effort to save energy, it is recommended that you do not use your computer at temperatures above recommended.
You can monitor CPU and GPU temperature in Windows 10 thanks to a variety of monitoring options. Your system will run smoothly if you follow these steps.
Maintaining your system’s health can ensure its efficiency by monitoring the temperature all the time.
Wrapping Up
Your CPU should be monitored very carefully if your work is computer-dependent. Over time, you will start to notice your performance degrading if you ignore overheating. It is also important to keep the CPU temperature low because it has a direct effect on the lifespan of the CPU.
Thanks for reading our post on the best way to check CPU temperature in Windows 10 today.

Hi, I’m Stephen Smith. I love traveling, computer hardware, and software. I’m constantly trying to learn new skills and programming languages. Reviewing new pieces of hardware is one of my favorites hobbies. Drop by any time to leave me a message if you have any questions.

Contents
- 1 Check Your Processor Temperature with Core Temp
- 2 Use SpeedFan as a Temp Monitor
- 3 Monitor Windows 10 CPU Temperature and PC Temperature with HWMonitor
Whether you’ve just installed a new CPU cooler or you’re simply curious, it’ a good idea to keep an eye on your CPU temp (Core temp). Though processors in many modern laptops have good specs, that matters little if they run into thermal throttling.
What´s the common CPU temperature range?
Intel does not provide temperature ranges for each processor. According to the company, operating ranges below the protection points are highly dependent on system configuration and workload. However, the following average temperature ranges for current CPUs should can give you a basic idea of when your CPU is running cool, normal, warm, or hot.
- 80°C Hot (100% Load)
- 75°C Warm
- 70°C Warm (Heavy Load)
- 60°C Norm
- 50°C Norm (Medium Load)
- 40°C Norm
- 30°C Cool (Idle)
When a processor gets too hot, it slows its clock speed down, impacting performance and sometimes causing lag. This can often be remedied by adjusting fan speeds, but first, you need to use a CPU temperature monitor to check your core temp. Today we’re going to show you how to check CPU temp with a CPU temperature monitor in Windows 10 to take that part out of the equation.
The best CPU temp monitors
There are various third-party apps that allow you to check and monitor CPU temperature in Windows 10, including Core Temp, which pretty much does what it says on the tin. Here’s a roundup of each of them:
Check Your Processor Temperature with Core Temp
Core Temp is a popular CPU temperature monitor, and for good reason. It’s lightweight with minimal bloat and an easy-to-read interface. It can also show the temperature of each core in your system tray, so you don’t even need to open the app to check.

Clicking one of the tray icons opens that app for a more detailed readout. You can see the power details, processor model and specs, TDP, and min/mad temperature and load of each core. It’s particularly important to pay attention to the T.j Max temperature, which is the maximum temperature the CPU manufacturer has rated it to run. It’s dangerous to exceed this temperature, and you should generally aim for at least 10-20 degrees below that for longevity reasons.
You can find the Core temp download page here.
Use SpeedFan as a Temp Monitor
If you followed our fan adjustment guide or have just changed your fans in the past, there’s a good chance you already have SpeedFan installed. The software isn’t strictly created for monitoring, but it does the job just fine, giving a simple readout of overall core temp.
It also provides some information about voltage, which can be relevant, as well as a chart of CPU temps, which can be very useful. The only downside here is that it didn’t detect all of the cores on our test machine, but your experience may vary.
Monitor Windows 10 CPU Temperature and PC Temperature with HWMonitor
If you want something a bit more in-depth, HWInfo provides very detailed monitoring of your entire PC. It includes individual readouts for each component, and the CPU is obviously included in that.
You’ll see an accurate readout of core temp even on AMD systems, with current, minimum, and maximum CPU temperatures nicely displayed. It also gives information like your processor mode, power, utilization, and clock speeds.
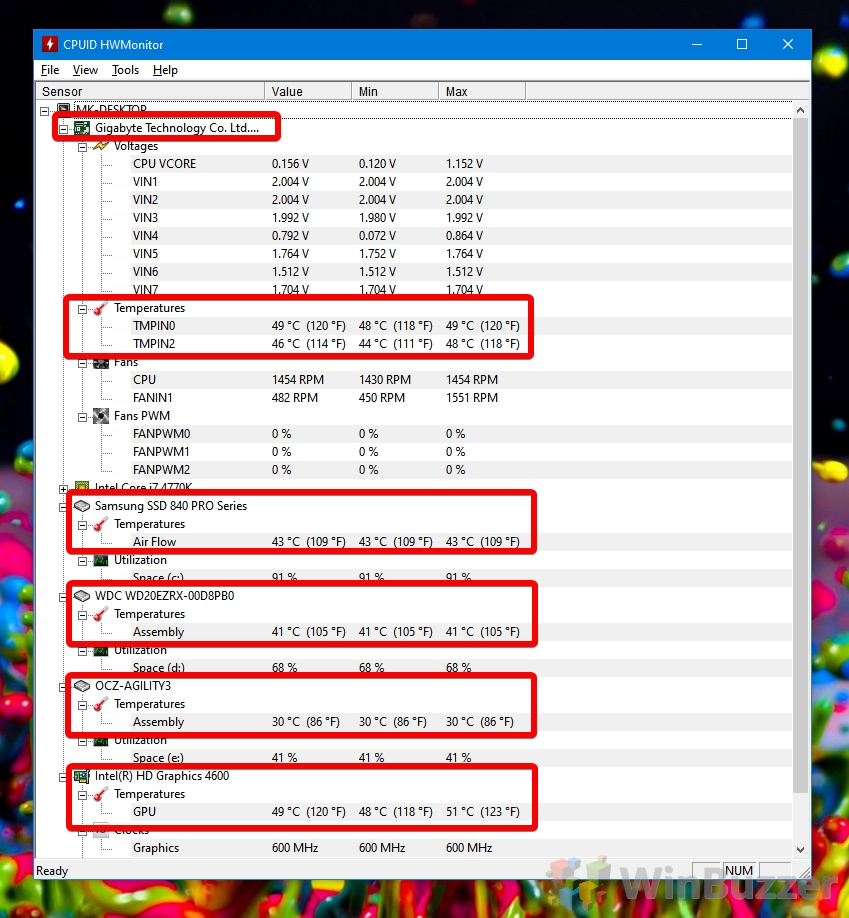
However, its HW Monitor’s ability to display the temperatures of other hardware that makes it one of the best CPU temp monitors. You can utilize it as an all-in-one solution to keep an eye on hard drive, GPU, and motherboard temps to do a general PC temperature check. While you’re there, you can also use it as a way to check which GPU you have.
On top of all that, HW Monitor shows voltages, fan speeds, clock speeds, and other useful information. This makes it a very strong choice, but you’ll still have to boot up SpeedFan if you actually want to change anything.
Высокая температура процессора на компьютере или ноутбуке может привести к троттлингу и резкому BSOD синему экрану в Windows 11/10.
По этому важно иногда мониторить при нагрузке на ЦП его температуру, чтобы примерно быть в дальнейшим уверенным, что процессор не перегревается.
С температурой процессоров не всё так однозначно. К примеру, некоторые модели в режиме простоя могут нагреваться до 30° и это считается не очень хорошо, так как производитель рекомендует не ниже 35°. Лучшим решением будет зайти на сайт производителя ЦП и почитать характеристики максимальной идеальной температуры. К примеру, если на сайте будет стоять обозначение T Case, то это максимальная рабочая температура, а если T Junction, то поддержка температуры не меньше к примеру 30°.
В данном руководстве разберем популярные программы, чтобы узнать и посмотреть температуру процессора на компьютере или ноутбуке с Windows 11/10.
Какая нормальная температура процессора при нагрузке и в простое?
Нормальная температура при нагрузке в играх считается для большинства моделей ЦП до 83°. Если приближаетесь к 90°, то стоит уже беспокоится, чтобы её снизить. 40°-60° считается нормальной температурой, обычно в режиме простоя без нагрузки или средней ннгрузки.
Может ли перегрев процессора повредить его?
Нет, не может. Процессор автоматически отключиться, когда достигнет критической температуры заложенный в прошивку. Это своего рода защита от перегрева, так что можете не беспокоится о том, что перегрев повреждает процессор.
Как долго ЦП работает при высоких температурах?
Процессор может работать минуты 3 при высоких температурах, потом идет троттлинг от перегрева и в играх появляются подлагивания. Избегайте порог в 90° в течении часа, чтобы избежать фризы в играх.
Как снизить высокую температуру на процессор?
- увеличение вращения кулера на ЦП
- Продуть пыль с вентилятора, если она там имеется
- Сменить термопасту
1. MSI Afterburner
MSI Afterburner — Программа для геймеров, которая способна отображать информацию о температуре процессора, скорости вращения вентилятора и его регулировка. Кроме того, можно повысить или понизить частоту процессора. Я уже писал о данной программе, как при помощи MSI Afterburner настроить мониторинг, разгон и вращение кулера.
- Скачать

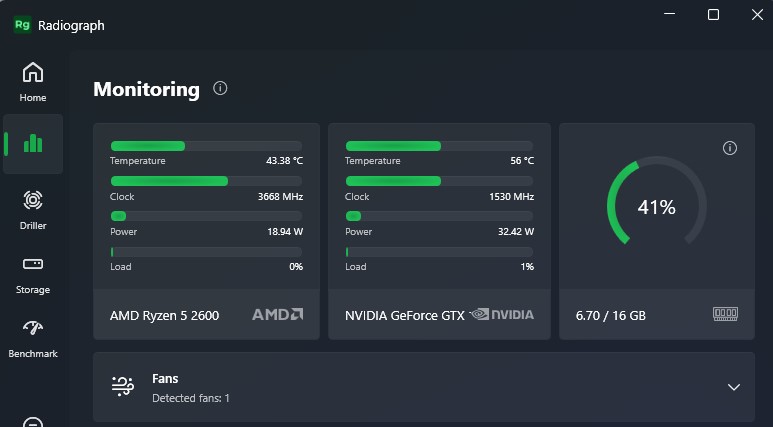
2. Radiograph
Radiograph — UWP приложение из Microsoft Store, которое отобразит температуру процессора и другую информацию о вашем компьютере или ноутбуке. Вы узнаете температуру видеокарты, загруженность ОЗУ, скорость вращения вентилятора, частоту CPU и GPU, вольтаж материнской платы и её температуру, скорость сетевого адаптера и интернета.
- Скачать
3. Throttlestop
Throttlestop — Многофункциональная программа для настройки и мониторинга процессора. Вы сможете посмотреть температуры каждого отдельного ядра процессора, снизить частоту процессора, чтобы понизить его температуру и также вывести мониторинг процессора в область уведомления на мониторе (нажав Option и выбрав CPU Temp).
- Скачать
4. HWMonitor
HWMonitor — Минималистичная программа, где вы не запутаетесь в настройках, так как всё показано на первом экране. Сможете посмотреть температуру процессора, напряжение каждого ядра, текущую нагрузку и другую информацию. Для некоторых в данной программе может быть один недостаток, нельзя выводить мониторинг ЦП в область уведомления на мониторе.
- Скачать
5. Open Hardware Monitor
Open Hardware Monitor — Покажет не только температуру процессора, но и температуру видеокарты GPU. Помимо мониторинг напряжения ЦП, имеется информация о скорости вращения вентилятора RPM. Параметры мониторинга ЦП, Видеокарты, Памяти и Диска можно вывести на панель задач для лучшего удобства, просто нажмите правой кнопкой мыши по нужному параметру и Show in tray. Очень удобная и минималистичная программа, чтобы узнать температуру процессора.
- Скачать
6. Core Temp
Core Temp — Программа покажет более подробную информацию сфокусированную на самом процессоре. Вы сможете узнать Tj. Макс температуру ЦП, чтобы поддерживать её на максимальном минимуме. Можно вывести мониторинг температур в системный трей на пень задач Windows 11/10.
- Скачать

7. Speccy
Speccy — Программа покажет большую информацию о вашем ПК, в частности информацию о ЦП, Видеокарте, RAM, Диске и других компонентов ПК или ноутбука. Кроме того, мониторинг можно вывести в область панели задач Windows, нажав Вид > Параметры > Область уведомлений. Кроме того, имеется русский язык, что для некоторых может являться ключевым фактором.
- Скачать

8. HWINFO
HWINFO — Поддерживает практически все процессоры Intel и AMD, чтобы определить их температуру и другие спецификации. Имеется предупреждение, когда температура процессора доходит до порога. Выбрав процессор и нажав на Sensor вы узнаете информацию о температуре процессора, а чтобы её добавить на панель задач, то нажмите правой кнопкой мыши по данному значению температуры и выберите add to tray.
- Скачать
Смотрите еще:
- Программы для разгона процессора и видеокарты
- Как проверить скорость жесткого диска HDD и SSD
- Лучшие бесплатные 3D программы для разных нужд
- Программы для очистки оперативной памяти Windows 11/10
- VPN программы для компьютера Windows 11/10
[ Telegram | Поддержать ]
Содержание
- How to Check the CPU Temperature in Windows 10
- But First – What’s a “Bad Temperature”?
- 1. Throttlestop
- 2. HWMonitor
- 3. MSI Afterburner
- 4. Open Hardware Monitor
- 5. Core Temp
- 6. Speccy
- Help! My Processor Is Too Hot!
- Checking the Heat
- How to Check CPU Temperature on Windows 10
- How to Check CPU Temp on Windows 10 with “Open Hardware Monitor”
- How to Check CPU Temp on Windows 10 with “Core Temp”
- How To Check CPU Temperature on Windows 10 PC
- What’s a Bad CPU Temperature?
- How to Check CPU Temperature on Windows 10 Using BIOS
- How To Check CPU Temperature on Windows 10 Using Third-Party Application
- How To Lower Your CPU Temperature Which Is Too Hot?
- How to See the CPU Temperature in Windows 10
- What Is a Normal CPU Temperature?
- How to See the CPU Temperature in Windows 10 Using ThrottleStop
- How to See the CPU Temperature in Windows 10 Using HWmonitor
- How to See the CPU Temperature in Windows 10 Using MSI Afterburner
- How to See the CPU Temperature in Windows 10 Using Open Hardware Monitor
- How to See the CPU Temperature in Windows 10 Using Core Temp
- How to See the CPU Temperature in Windows 10 Using Speccy
- Additional FAQs
- What’s a a good temperature for my Windows 10 CPU?
- What are consequences of running hot for too long?
- How do I lower my CPU temperature?
- Helping Your CPU to Keep Its Cool
How to Check the CPU Temperature in Windows 10

Keeping your CPU temperature in check is one of the foundations of looking after your computer. The CPU is pretty much the brain of your computer, through which millions of calculations are made, tasks are prioritized, and data is turned into information on your screen.
A hot CPU can result in throttling, which can impact the clock speeds of your CPU and therefore slow it down. It can also cause BSOD crashes and cause your CPU to deteriorate quicker, giving it a shorter lifespan than it deserves.
To help you check your CPU temperature in Windows 10, we’re going to show you the best tools you can use to monitor it.
But First – What’s a “Bad Temperature”?
Unfortunately, it’s not immediately obvious what a good or bad temperature for a processor is. If you see your processor’s idle temperature is 30°C, is that a good or bad idle temperature? What about 40°, 50°, 60°, or 70°C?
If you want to know what your processor’s max temperature is, search the Web for the product page of your specific CPU, then find where it lists the max ideal temperature for your processor.

If the temperature is listed under something similar to “Maximum Operating Temperature” or “T Case,” then that’s the temperature which you should strive to keep your processor under most of the time. If it says “T Junction” (like above), the general advice is to keep things at least 30°C under this stated temperature. (For the above example, we’ll be striving to stay under 70°C.) Either way, if your PC is under this temperature for most (or, ideally, all!) of the time, you’re doing fine.
Gaming is an important variable here. If you’re playing graphically intensive modern games, then not only will your GPU be under load, but your CPU too. Again, CPU temperature limits vary greatly, but under heavy gaming load, it’s not uncommon for temperatures to soar into the 80s. In most cases this is perfectly safe (if a little hot on the palms for laptop users), and you only need to start worrying if you’re creeping up into the 90s.
Now that we know what the temperature limit is, it’s time to explore how to check CPU temperature in Windows 10. This requires the aid of third-party programs, which will help keep tabs on how hot the processor is getting.
1. Throttlestop
We’ve waxed lyrical plenty about the undervolting tool Throttlestop here at Make Tech Easier. (Check out our undervolting guide for proof!) The lightweight tool lets you undervolt your CPU to only cool down temperatures and prevent throttling, which in turn allows your CPU to function more effectively.

It’s worth looking into undervolting if you want to cool down your CPU, but as an added bonus, you can also use Throttlestop as a CPU temperature monitor.
First up, you can see each individual core temperature right there in the main Throttlestop window, but you can also get your CPU temperature to appear in the notification area on your PC.
To do this, click Options at the bottom of Throttlestop, then in the middle, check the “CPU Temp” box.

Now, every time you open Throttlestop, you’ll see a little number in your taskbar notification area showing you your CPU temperature at that moment.
2. HWMonitor
This tool does a whole lot more than just monitor CPU temperatures, but on one single screen, you’ll find all the information you need and much more. In the main HWMonitor pane, you can scroll down to see your CPU listed with all its information.

You’ll see the voltage of each core, the amount of CPU being utilized and – most importantly – the temperature of each core. It displays the current temperature as well as the minimum and maximum temperatures.
There’s not a ton to dig into here because everything is displayed on that one screen. You can switch on a dark mode for those nocturnal monitoring sessions, switch on a status bar, and quickly save a log of your monitoring data with the Ctrl + S shortcut.
3. MSI Afterburner
Designed with gamers in mind, and for those who want to overclock their PCs, MSI Afterburner doubles as an excellent tool to monitor your PC temperatures. Once you’ve installed and opened Afterburner, you should see a graph on its home screen showing you your GPU temperature, CPU temperature, and various other data.

To reorder the graphs and prioritize CPU temperature so it appears near the top, click “Settings” in Afterburner, then the Monitoring tab. Here you’ll see a menu where you can tick which things you want displayed on the home screen and drag to the top the things you want to appear near the top. Just drag “CPU1 temperature,” “CPU2 temperature,” and all the other CPU temperatures near the top of the graph, and click OK. They’ll appear on the home screen in the order you chose.

When you select the “CPU” temperature, you can also tick the “Show in On-Screen Display” box so that it appears in the corner whenever you enter the shortcut for bringing up the OSD. (You can choose what key you want this to be by going to the “On-Screen Display” tab in Afterburner’s settings.)
4. Open Hardware Monitor
Open Hardware Monitor is a nice solution for getting all your needed statistics in one place. This will be able to tell you what your CPU’s temperatures are as well as your GPU’s temperature, the voltages being used in your computer, and even how fast your system fans are going. This makes it a robust tool that allows you to keep an eye on all your system temperatures.

You can find your CPU’s temperature under the category with your CPU’s name in it. It will list a temperature for each core your processor has.

Many of these temperature monitors allow you to put readings on your taskbar. This is particularly useful if you’re doing system-intensive tasks and want to keep an eye on your temperatures without darting back and forth between the active window and the system monitor. If you’d like to see the CPU temperature in the taskbar, right-click the temperature itself and click “Show in Tray.”

If the reading ends up hiding in the “additional” icons section, you can drag it onto the main active tray. This means it’ll always be visible as long as you can see the taskbar.

5. Core Temp

If you’d like something a little more focused on the processor itself, Core Temp is a good choice when you need to check the CPU temperature in Windows 10. It gives you everything you may want to know about your processor, such as its name, the cores it uses, and – most importantly – its temperature. It will even inform you of your processor’s T Junction limit, listed as “Tj. Max” above your temperatures.

If you’d like to see the temperature in the system tray, it should be enabled by default. If it’s not, click “Options,” then “Settings.”

Click the “Windows Taskbar” tab, then “Enable Windows 7 Taskbar features,” followed by “Temperature,” then “OK.”

6. Speccy
Another all-in-one suite, Speccy, comes as a nice package of various systems diagnostics, including the ability to check CPU temperature in Windows 10. As soon as you open Speccy, you’re shown all the relevant temperatures you need to know for a healthy laptop. It’s also great for digging up information on your system, so make sure you remember this application, should you need information about your operating system or motherboard, for instance.

If you click on “CPU” on the left, you can get more focused information on your processor.

If you’d like the temperature to appear in the tray, click “View,” then “Options.”

Click “System tray,” then “Minimize to tray,” followed by “Display metrics in tray,” then select “CPU.”

Now when you minimize Speccy, you can keep tabs on how hot your CPU is running as you do other things.
Help! My Processor Is Too Hot!
If the above methods lead you to discover that you have quite a toasty processor, don’t panic. There are many solutions you can use to bring your processor down to a more reasonable level. We published an article about how to cool down your CPU, so see if the solutions there will help bring your CPU down to a more manageable heat.
Checking the Heat
Being a vital part of your laptop, an overheating processor is a cause for concern. With third-party apps, however, you can easily check CPU temperature in Windows 10 and ensure your processor is working as cool as it should.
Want to do more laptop maintenance? Then read our guide on how to check whether a USB drive is bootable in Windows 10 as well as our guide on installing unsigned drivers in Windows 10.
Content Manager at Make Tech Easier. Enjoys Android, Windows, and tinkering with retro console emulation to breaking point.
Источник
How to Check CPU Temperature on Windows 10

This Itechguide teaches you how to check CPU temp on Windows 10. The guide covers steps for 2 methods to check CPU temp on Windows 10.
Expand “Browse Post Topics” below to go straight to a topic.
Browse Post Topics
How to Check CPU Temp on Windows 10 with “Open Hardware Monitor”

To use this tool to check CPU temperature on Windows 10, you have to download and unzip the file.
How to Check CPU Temp on Windows 10 with “Core Temp”

Another free tool you can use to check the temperature of the CPU on your Windows 10 PC is “Core Temp”. Here are the steps to download, install and use the app.
It is very easy to check CPU temp Windows 10! I hope you found this Itechguide helpful. If you found it helpful, kindly vote Yes to the “Was this post Helpful” question below.
Alternatively, you could ask a question, leave a comment or provide feedback with the “Leave a Reply” form found towards the end of this page.
Finally, for more Windows 10 Itechguides, visit our Windows 10 How–To page.
Источник
How To Check CPU Temperature on Windows 10 PC
It’s always a healthy activity to check CPU temperature on your Windows 10 PC. This comes in handy when you need to check your PC temperature when it gets too hot. Especially when your PC abruptly shuts down due to high CPU temp and locks up, or act really sluggish when performing intensive tasks.
Another benefit of checking CPU temp on Windows 10 is to overcome computer overheating problems. In case you have overclocked your PC processor then it becomes more crucial to check CPU temperature on Windows 10.
You don’t want to accidentally push the CPU performance pedal too far. This is why here we have explained how to check CPU temperature on Windows 10 with the best CPU temperature monitor.
What’s a Bad CPU Temperature?
It’s not possible to explain bad or normal CPU temperature because each CPU model has a different temperature range.
If you see idle CPU temperature and noticed that it is at 30 C, is that a good CPU temperature or bad idle CPU temperature? What about 40, 50, 60, or 70 C? That’s a debatable issue!
If you want to know what the max CPU temperature is, search the Web for the product page of your specific CPU, then find where it lists the max ideal CPU temperature for your processor.
If the CPU temperature is listed under something similar to “Maximum Operating Temperature” or “T Case.”
Then that’s the CPU temperature which you should strive to keep your processor under most of the time.
If it says “T Junction” (like above), the general advice is to keep CPU temperature at least 30 C under this stated temperature.
(For the above example we’ll be striving to stay under 70 C.) Either way, if your PC is under this CPU temp for most (or, ideally, all!) of the time, you’re doing fine.
Now that we know what is the best CPU temperature range, it’s time to explore how to check CPU temperature on Windows 10.
How to Check CPU Temperature on Windows 10 Using BIOS
Unfortunately, there’s no such option to check CPU temperature on Windows 10. Because Windows 10 doesn’t offer any way to check the computer’s CPU temperature.
You could dive into your system’s BIOS to get information about CPU temp. But Checking CPU temp using BIOS involves a lot of hassle to find simple sensor reading.
Microsoft doesn’t consider BIOS to be the best way to check CPU temperature on Windows 10. Because
Modifying BIOS/ complementary metal-oxide-semiconductor (CMOS) settings incorrectly can cause serious problems that may prevent your computer from booting properly. Microsoft cannot guarantee that any problems resulting from the configuring of BIOS/CMOS settings can be solved. Modifications of the settings are at your own risk.
Fortunately, there exist several free programs called CPU temperature monitors, which make it easy to check CPU temperature on Windows 10.
How To Check CPU Temperature on Windows 10 Using Third-Party Application
The easiest and fastest way to check CPU temperature on Windows 10 is the aptly named Core Temp. Be careful during Core temp download and installation.
Because as a free program it tries to install bloatware, so you must uncheck some unwanted boxes during the Core Temp installation setup.
Once you’ve download Core Temp and installed it. On opening core temp, it displays readings of current CPU temperature on Windows 10.
Core temp also displays the average CPU temperature reading at the bottom of the window.
If you want even more detail on PC temperature, click on the Show hidden icons button in the system tray located at the right edge of your Windows 10 taskbar. You’ll see a computer temperature listing for every individual CPU core in your computer.
With core temp, you can easily check CPU temperature on Windows 10.
The Settings menu of this CPU temp monitor allows you to tweak exactly what you’ll see in the system tray, and how you’ll see it, but the default configuration makes it dead-simple to see if your CPU is overheating or performing as expected.
Core Temp isn’t the only computer temperature monitor for Windows 10. You can also try the HWInfo temperature monitor.
The HWInfo is an in-depth system monitoring tool that provides deep details about every piece of your PC’s hardware.
If you choose to run it in sensors-only mode, scrolling down to the CPU section, the dedicated section, not the CPU temperature portion of the motherboard listing—reveals current CPU temps and other nitty-gritty details.
The HWInfo is available in two versions called HWInfo32 and HWInfo64. The HWInfo portable version is also there which doesn’t require installation.
NZXT’s Cam software is another popular option to check CPU temperature on Windows 10. The NZXT Cam temperature monitor is equipped with diverse skillsets.
Its slick interface is easier to read at a glance than those on most other CPU temp monitoring tools.
This CPU heat monitoring program shows all sorts of useful info about your CPU, graphics card(GPU temperature), memory, and storage.
NZXT Cam also includes an in-game FPS overlay and overclocking tools, among other features.
You can also download NZXT Cam mobile apps to check CPU temperature on mobile phones. The NZXT cam software keeps tabs on your PC temp when you’re away from your system.
With NZXT cam software installed in your system, you shouldn’t worry that how hot should my CPU be?
However, Open Hardware Monitor and SpeedFan are other well-regarded CPU temperature monitoring tools that are reliable to check the real-time temp of your CPU on Windows 10.
They can quickly track your system information. Now you’ve got plenty of options! But to simply check the computer’s CPU temperatures, Core Temp’s straightforward focus can’t be beaten.
How To Lower Your CPU Temperature Which Is Too Hot?
If after downloading the above CPU temperature monitor you feel that you have quite Hot CPU. Then don’t panic.
There are many DIY solutions to lower CPU temperatures. You can use these free methods to make your processor temperature down to a more reasonable level.
We have also published an article about 11 Ways to Prevent Computer Overheating. So read it and apply them. They will help bring your CPU temperature down to a more manageable heat.
Источник
How to See the CPU Temperature in Windows 10
The Central Processing Unit (CPU) essentially implements the instructions received from software and hardware. This causes the CPU to warm up and if it becomes too hot for a sustained period, hardware problems can transpire. As part of regular computer maintenance, an occasional CPU temperature check will help to protect your PC’s internal components.

We’ll show you how to monitor your CPU temperature using a selection of third-party tools best for Windows 10. Also, our FAQs include tips on how to reduce the CPU temperature.
What Is a Normal CPU Temperature?
Get to know the “normal value” or tolerance range of your computer. External conditions such as your computer’s location or the room temperature may affect the CPU temperature.
Since the normal temperature depends on the computer’s processor type, the following is a ballpark guide for estimation:
How to See the CPU Temperature in Windows 10 Using ThrottleStop
ThrottleStop is an application designed to monitor and fix the three main types of CPU throttling: Thermal, Power Limit, and Processor Power Module. To have ThrottleStop launch automatically on Startup and have your CPU temperature displayed on your taskbar:
Alternatively, if the “Startup” option isn’t in “Settings”:
To display the temperature in your taskbar notification area when launched:
How to See the CPU Temperature in Windows 10 Using HWmonitor
HWMonitor will monitor your hardware. It reads the PC’s main health sensors: temperatures, voltages, fan speeds, and new CPUs on-die core thermal sensors. To use HWMonitor to check your CPU temperature:
How to See the CPU Temperature in Windows 10 Using MSI Afterburner
The MSI Afterburner tool was designed to cater to gamers. It supports monitoring in-game graphics performance, benchmarking, overclocking, and video capture. It doubles up as an excellent tool for observing computer temperatures. To find out your CPU temperature using MSI Afterburner:
How to See the CPU Temperature in Windows 10 Using Open Hardware Monitor
The free open-source software, Open Hardware Monitor, observes a PC’s fan speeds, temperature sensors, voltages, and load and clock speeds. Making it an excellent all-around tool for monitoring your PC’s temperatures.
To check the CPU temperature:
How to See the CPU Temperature in Windows 10 Using Core Temp
Core Temp is a lightweight and powerful processor, and other essential information, monitoring tool. Like some of the other tools we’ve looked at so far, it displays the temperature for each core processor. It also shows real-time fluctuations with changing workloads.
To see your CPUs temperature in Core Temp:
How to See the CPU Temperature in Windows 10 Using Speccy
Speccy provides comprehensive stats on all your computer’s hardware, including CPU, Graphics Cards, Hard Disks, and more. The temperatures for each hardware component are displayed; therefore, highlighting any potential problems.
Additional FAQs
What’s a a good temperature for my Windows 10 CPU?
Many third-party hardware component monitoring tools will identify what the maximum temperature for your specific processor is and let you know if your CPU is nearing or has exceeded it.
Because a normal temperature can vary per processor, the following is a rough guide for estimation:
• Minimal processor usage (typical processing): approximately 30 to 50 °C (86 to 122 °F).
• Intense processor usage: up to 95 °C (up to 203 °F).
• Whenever possible, the temperature should not exceed 100 °C (212 °F) – especially for a prolonged time.
What are consequences of running hot for too long?
An overheated CPU, especially for a prolonged period, can have the following consequences:
• The PC responds slowly to inputs or completely freezes
• Random characters and symbols appearing on the screen
• “Screen of death” or the dreaded blue screen appears
• Spontaneous rebooting or shutting down
• The motherboard’s voltage regulator module and surrounding components may be adversely affected
• The hard disk drive may have difficulty reading and, in extreme cases, need replacing
• In some cases, the CPU or further down the line the motherboard may need replacing
How do I lower my CPU temperature?
The following are tips for reducing your CPUs temperature and keeping it low:
• Allow for better internal airflow. The aim is to get more air into your PC’s box and less air out. You can achieve this by having more intake fans as opposed to exhaust fans or vice-versa
• Ensure your fan blades are dust and debris-free. You can do this by either blowing the dust away or using a can of compressed air
• Keeping the cables tidy and in place also helps to encourage airflow
• Ensure your computer is placed in a well-ventilated area
• Keep the case on to prevent dust and debris from clinging to the components.
• Depending on your usage, consider investing in a better CPU cooler.
• Consider setting higher fan speeds in Windows 10 via Control Panel’s “Hardware and Sound,” and “Power Options.”
Helping Your CPU to Keep Its Cool
The CPU of your computer processes millions of transactions, essentially to return information to your monitor. All this work causes it to warm up. By keeping an eye on its temperature, you can ensure it doesn’t warm up too much for too long and potentially causes major problems for all components.
Now that you know how to check the CPUs temperature and how to keep it at a reasonable level, did you use any of the third-party tools discussed to monitor it? If so, which one did you use, and how was your experience using it? Let us know in the comments section below.
Источник