“
В этом уроке поговорим о том, как можно визуализировать информацию с помощью графиков. Для этого будем использовать приложение WPF и элементы Windows Forms.
Для успешного освоения материала рекомендуем вам изучить следующие понятия:
DB (Database), БД. Организованная структура, предназначенная для хранения, изменения и обработки взаимосвязанной информации, преимущественно больших объемов
Framework. Программная платформа, определяющая структуру программной системы; программное обеспечение, облегчающее разработку и объединение разных компонентов большого программного проекта
Windows Presentation Foundation. Аналог WinForms, система для построения клиентских приложений Windows с визуально привлекательными возможностями взаимодействия с пользователем, графическая (презентационная) подсистема в составе .NET Framework (начиная с версии 3.0), использующая язык XAML
Демонстрация работы с графиками в Windows Forms
На данном занятии будет разработано простое приложение Windows Forms для визуализации расходов пользователей. Пользователи распределяют затраты по разным категориям и хранят их в общей базе данных. Итогом работы приложения будет служить работающая форма, в которой для каждого пользователя можно построить диаграммы различных типов для визуализации их расходов по категориям. Основные шаги построения приложения:
- Разработка интерфейса приложения
- Настройка взаимодействия с базой данных
- Реализация обработки данных

Важно
В рамках примера используется готовая база данных с информацией о пользователях, их платежах и категориях расходов
Разработка интерфейса приложения
1. Устанавливаем структуру формы

Важно
Интерфейс приложения будет состоять из двух основных частей: области построения и области настройки параметров просмотра
2. Добавляем элементы настройки параметров просмотра

Важно
Элементами настройки параметров просмотра будут являться выпадающие списки, позволяющие выбрать пользователя и тип диаграммы
3. Подключаем библиотеки для просмотра диаграмм

Важно
Диаграмма будет визуализироваться с помощью элемента Chart из WindowsForms. Воспользоваться данным элементом можно после подключения библиотеки System.Windows.Forms.DataVisualization, расположенного во вкладке Assemblies (сборки)
4. Добавляем элементы управления диаграммой

Важно
Диаграмма будет располагаться внутри элемента WindowsFormsHost. Данный элемент добавляется из окна ToolBox простым перетаскиванием
5. Добавляем пространство имен для работы с элементом Chart

6. Добавляем дополнительные параметры просмотра

Важно
Дополнительными параметрами являются имя диаграммы, а также легенда
Настройка взаимодействия с базой данных
1. Реализуем взаимодействие с базой данных

Важно
Взаимодействие реализуется путем добавления элемента «ADO.NET Entity Data Model»
2. Настраиваем свойства подключения базы данных

3. Добавляем подключение к базе данных

Реализация обработки данных
1. Создаем область построения графиков

Важно
Сперва создается поле для контекста EntityFramework с инициализацией. Затем создается область построения диаграммы ChartArea и добавляется в соответствующую коллекцию в конструкторе MainWindow
2. Добавляем наборы данных

Важно
Для каждого набора данных (например, данные линии на графике) необходимо добавлять в коллекцию Series. В данном случае есть одна серия данных для отображения сумм платежей по категориям. Объект Series создается с указанием названия и необходимости отображения на диаграмме
3. Загружаем данные из базы

Важно
Данные о пользователях загружаются в выпадающий список. Также загружаются типы диаграммы из перечисления SeriesChartType
4. Реализуем адаптивное изменение интерфейса

Важно
При выборе другого значения в ComboBox будет вызываться метод UpdateChart()
5. Получаем выбранные значения в выпадающих списках

Важно
Значения получаются как currentUser и currentType
6. Обрабатываем данные диаграммы

Важно
Приведенный код описывает получение серии данных диаграммы из соответствующей коллекции Series, установку типа диаграммы и очистку предыдущих данных
7. Обрабатываем список категорий

Важно
Список категорий получается из базы данных. Далее, в цикле foreach для каждой категории значение точки диаграммы добавляется в Points. Координата X будет названием категории, а координата Y будет суммой платежа для выбранного пользователя в текущей категории
Результат работы программы

“
Вы познакомились с тем, как использовать основные элементы Windows Forms в приложении WPF. Теперь давайте перейдем от теории к практике!
Для закрепления полученных знаний пройдите тест
Для взаимодействия с базами данных используется технология
Для размещение элемента управления Windows Forms на странице WPF используется
WindowsFormsIntegration является
К сожалению, вы ответили неправильно
Прочитайте лекцию и посмотрите видео еще раз
Но можно лучше. Прочитайте лекцию и посмотрите видео еще раз
Вы отлично справились. Теперь можете ознакомиться с другими компетенциями
Example. Now we can use the Chart. In the next step, we will use the Form1_Load event handler to initialize the Chart we just added. To add Form1_Load, double-click on the Form window in Visual Studio.
Array: In Form1_Load, we assign an array of strings (Series) and an array of integers (Points).
For: In the for-loop, we add the strings to the Series collection and add the integers to the Points collections on those Series.
For
Tip: The loop results in two Series: a Cats series with a Point of 1, and a Dogs series with a Point of 2.
Info: These are reflected in a bar graph, which is shown in this page’s screenshot.
Example that sets Chart control up: C#
using System;
using System.Windows.Forms;
using System.Windows.Forms.DataVisualization.Charting;
namespace WindowsFormsApplication1
{
public partial class Form1 : Form
{
public Form1()
{
InitializeComponent();
}
private void Form1_Load(object sender, EventArgs e)
{
// Data arrays.
string[] seriesArray = { «Cats», «Dogs» };
int[] pointsArray = { 1, 2 };
// Set palette.
this.chart1.Palette = ChartColorPalette.SeaGreen;
// Set title.
this.chart1.Titles.Add(«Pets»);
// Add series.
for
(int i = 0; i < seriesArray.Length; i++)
{
// Add series.
Series series = this.chart1.Series.Add(seriesArray[i]);
// Add point.
series.Points.Add(pointsArray[i]);
}
}
}
}
The following example demonstrates how to add the ChartControl to a form. Note that the Chart Control can be added to your charting application at both design time and runtime.
Design Time
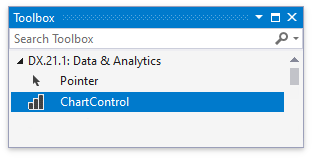
By default, the ChartControl item is added to the DX.22.2: Data & Analytics toolbox tab of the VS IDE. So, to add the Chart Control to your project, simply drag the corresponding toolbox item, and drop it onto the form.
Note
While adding the ChartControl, the Chart Wizard window may be invoked (in case its “Show wizard every time a new chart is added” option is enabled). Click Cancel if you don’t want to use it, or go through its steps to customize the initial look of your chart.
Runtime
To add a Chart Control to a form at runtime, don’t forget to include all necessary assemblies to the References list of your project.
- C#
- VB.NET
using System.Drawing;
using System.Windows.Forms;
using DevExpress.XtraCharts;
// ...

private void OnButtonClick(object sender, System.EventArgs e) {
    // Create a new Chart control.
    ChartControl chart = new ChartControl();

    // Set the chart's location.
    chart.Location = new Point(10, 10);

    // Perform any other initialization here.
    // ...
    // ...

    // Add the chart to the Form.
    this.Controls.AddRange(new Control[] {chart});
}
Create Chart/Graph include bar, line, pie chart with SQL Server database using C#
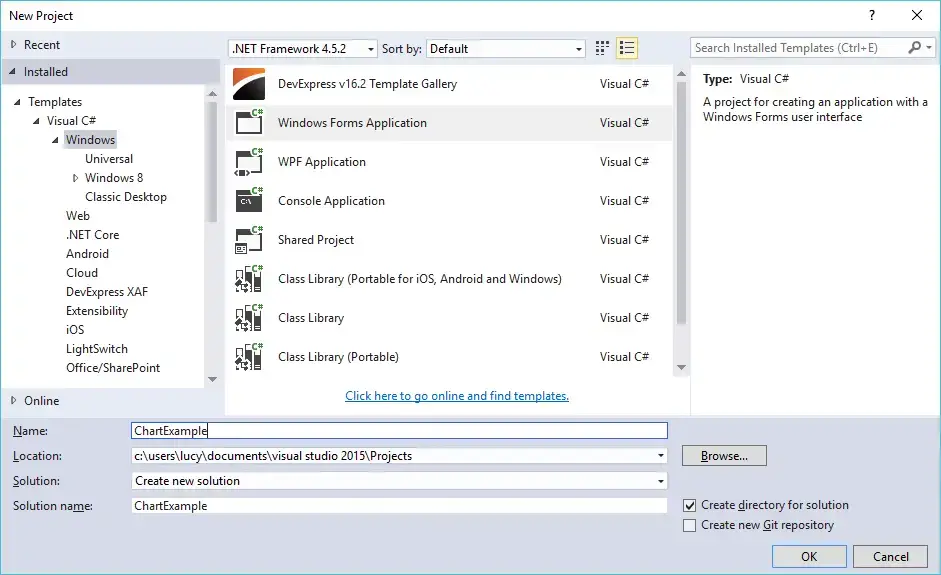
Step 1: Click New Project, then select Visual C# on the left, then Windows and then select Windows Forms Application. Name your project «ChartExample» and then click OK
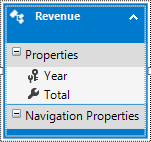
 Step 2: Create an Entity Framework Model First, then add the Revenue table to your Model
Step 3: Design your form as below

Step 4: Add code to handle your form as below
using System;
using System.Collections.Generic;
using System.ComponentModel;
using System.Data;
using System.Drawing;
using System.Linq;
using System.Text;
using System.Threading.Tasks;
using System.Windows.Forms;

namespace ChartExample
{
    public partial class Form1 : Form
    {
        public Form1()
        {
            InitializeComponent();
        }

        private void btnLoad_Click(object sender, EventArgs e)
        {
            using(ChartEntities db = new ChartEntities())
            {
                //Load data to chart control
                chartRevenue.DataSource = db.Revenues.ToList();
                chartRevenue.Series["Revenue"].XValueMember = "Year";
                chartRevenue.Series["Revenue"].XValueType = System.Windows.Forms.DataVisualization.Charting.ChartValueType.Int32;
                chartRevenue.Series["Revenue"].YValueMembers = "Total";
                chartRevenue.Series["Revenue"].YValueType = System.Windows.Forms.DataVisualization.Charting.ChartValueType.Double;
            }
        }

        private void Form1_Load(object sender, EventArgs e)
        {
            //chartSalary.Series["Salary"].Points.AddXY("Peter", 1000);
            //chartSalary.Series["Salary"].Points.AddXY("John", 5000);
            //chartSalary.Series["Salary"].Points.AddXY("Tan", 1500);
            //chartSalary.Series["Salary"].Points.AddXY("Lucy", 7000);
            chartSalary.Series["Salary"].Points.Add(1000);
            chartSalary.Series["Salary"].Points[0].Color = Color.Red;
            chartSalary.Series["Salary"].Points[0].AxisLabel = "Peter";
            chartSalary.Series["Salary"].Points[0].LegendText = "Peter";
            chartSalary.Series["Salary"].Points[0].Label = "1000";
            //Init data
            chartSalary.Series["Salary"].Points.Add(5000);
            chartSalary.Series["Salary"].Points[1].Color = Color.Green;
            chartSalary.Series["Salary"].Points[1].AxisLabel = "John";
            chartSalary.Series["Salary"].Points[1].LegendText = "John";
            chartSalary.Series["Salary"].Points[1].Label = "5000";
            //
            chartSalary.Series["Salary"].Points.Add(1500);
            chartSalary.Series["Salary"].Points[2].Color = Color.Yellow;
            chartSalary.Series["Salary"].Points[2].AxisLabel = "Tan";
            chartSalary.Series["Salary"].Points[2].LegendText = "Tan";
            chartSalary.Series["Salary"].Points[2].Label = "1500";
            //
            chartSalary.Series["Salary"].Points.Add(7000);
            chartSalary.Series["Salary"].Points[3].Color = Color.Blue;
            chartSalary.Series["Salary"].Points[3].AxisLabel = "Lucy";
            chartSalary.Series["Salary"].Points[3].LegendText = "Lucy";
            chartSalary.Series["Salary"].Points[3].Label = "7000";
        }
    }
}
VIDEO TUTORIALS
Related Posts
- Windows Forms: Create CPU and RAM Monitor with Real time Charts in C#
- Windows Forms: Live Charts in C#
- Windows Forms: How to Create a Geo Chart using LiveCharts in C#
VS2022 — VS2019 .NET CHARTING COMPONENT Winforms 4.8 Framework C# Walk Through
ProEssentials WinForms interfaces are used when creating stand-alone Desktop or Embedded EXEs to be distributed royalty-free and ran on an end-users machine. This VS2022 — VS2019 C# Charting Walk-through includes instructions for Net4.8 Framework VS2022 and VS2019. If you prefer Net60 Nuget: Click here for Net60 Nuget Charting or if you prefer Visual Basic: Click here for VB.NET Charting or for C# in an earlier VS: Click here for VS2015-VS2012
See the demo…
- If you haven’t seen the v9 canned demo? it’s only 17M and does not require an install, just run it.
- Download our Winforms C# Chart Demo + WPF Demo + 100% native MFC Demo.
- Only Experience equals Knowledge: Size, Shape, Right Click, Export, Zoom (especially date and log scales), Pan, and Rotate.
- Watch 100 Million points continuously updated v9-v10 Performance Preview.


Hello World — Walk Through — Tutorial
The WinForm interfaces support adapting to changes in the parent form’s font and background color. They are designed so that the grid number text size (grid numbers are the grid line labels such as 70, 80, 90 along y axis) matches that of the other standard controls such as TextBox, Radio Button, and Labels. As long as you don’t explicitly change the font and background color for the chart, you will be able to change the form’s font size and backcolor and all other controls on the form will adapt to match. Note that the default form text size of 8 points is fairly small. You may want to increase it to 9 or 10 points depending on your needs. This feature results in a clean looking user interface where the charting control appears to be a true sibling of the other standard controls.
You will have to write a little code (see below) to develop your graphing solutions. In the end, you’ll prefer our .NET (property, method, event) interface. 99% of your code will set simple properties.
Creating a new project…
1) Start Visual Studio.NET and create a new project targeting [C#] [Windows] [Desktop] and [WinForms .Net Framework]. Accept the default name of [WindowsFormsApp1]. Note, Do not select Windows Forms .NET (without the Framework) as the Framework is required and we recommend .Net 4.8 for this tutorial. We optionally have assemblies for Net60 (Windows) but these are installed via Nuget package via Package Manager and adjusting Package Source to [ Gigasoft (Local) ] or searching for «Gigasoft» if installing from Nuget.org.

2) When the new project opens, you will be presented the design view of «Form1.cs».
Adding designer controls to your Toolbox…
3) Installing WinForms interfaces into Visual Studio.NET
VS2022 Instructions
- Note 1. For VS2022 we recommend our x64 assembly in our DotNet48x64 folder else the first time our AnyCpu assembly is added to the Toolbar and a chart is placed on a form, VS2022 should be running with Admin privileges. Subsequent use will not require privileges.
- 1. With the Designer window having focus, Click the [Toolbox] vertical tab,
- 2. Right Click the area below the [General] tab,
- 3. Select [Add Tab],
- 4. Enter [Gigasoft] for the tab’s name,
- 5. Right Click the area below new [Gigasoft] tab,
- 6. Select [Choose Items…],
- 7. If not selected, left click the [.NET Framework Components] tab,
- 8. Left click the [Browse…] button and find the file «Gigasoft.ProEssentials.dll» found in our DotNet48x64 subfolder where you installed ProEssentials. By default, this should be located at «C:ProEssentials9DotNet48x64»,
- 9. Select the file «Gigasoft.ProEssentials.dll» and close the [Open File] dialog,
- 10. The [Choose Toolbox Items] dialog should now show 5 highlighted controls: Pe3do, Pego, Pepco, Pepso, and Pesgo.
- 11. Close dialog and 5 ProEssentials components will show within the Gigasoft tab as shown in the bottom right image.
- Note 2. Attemping to add our x86 assembly to the VS2022 toolbox will result in an error as the VS2022 designer is 64 bit.
- Note 3. When deploying your finished project and prefer to support AnyCpu or pure x86, close the Designer window, in Solution Explorer remove Reference and replace with any of our other References. The project will now support compiling as AnyCpu, x64, or x86 that matches the Reference added. To again add our charts to a form via the Designer, change Reference to our x64 assembly.

VS2019 Instructions
- Note 1. The first time our AnyCpu assembly is added to the Toolbar, VS2019 should be running with Admin privileges. Subsequent use will not require privileges. You may optionally install our assembly within the DotNet48x86 subfolder which does not require first time Admin privileges however adjust the Project Build setting Platform/CPU Target to x86.
- 1. With the Designer window having focus, Click the [Toolbox] vertical tab,
- 2. Right Click the area below the [General] tab,
- 3. Select [Add Tab],
- 4. Enter [Gigasoft] for the tab’s name,
- 5. Right Click the area below new [Gigasoft] tab,
- 6. Select [Choose Items…],
- 7. If not selected, left click the [.NET Framework Components] tab,
- 8. Left click the [Browse…] button and find the file «Gigasoft.ProEssentials.dll» found in our DotNet48AnyCpu subfolder where you installed ProEssentials. By default, this should be located at «C:ProEssentials9DotNet48AnyCpu»,
- 9. Select the file «Gigasoft.ProEssentials.dll» and close the [Open File] dialog,
- 10. The [Choose Toolbox Items] dialog should now show 5 highlighted controls: Pe3do, Pego, Pepco, Pepso, and Pesgo.
- 11. Close dialog and 5 ProEssentials components will show within the Gigasoft tab as shown in the bottom right image.
- Note 2. Attemping to add our x64 assembly located to VS2019 and earlier toolbox will result in an error as the VS2019 designer is 32 bit.
- Note 3. When deploying your finished project and prefer to change the target to pure x64 or pure x86, close the Designer window, in Solution Explorer remove our Reference and replace with any of our other References. The project will now support compiling as x64, x86, or AnyCpu that matches the Reference added. To again add our charts to a form via the Designer, change Reference to our AnyCpu assembly.

Adding ProEssentials to the Form…
4) Double click the [Pego] tool within the toolbox. This places an instance of the Pego component within «Form1.cs».
Left click bottom-right corner of control and drag down-right to fill up client area of Form1. The adjacent image shows what you see.

This represents the default state of a ProEssentials Graph. The default state has one subset with four data points. In the course of constructing your own charts, you’ll set the properties PeData.Subsets and PeData.Points which define the quantity of data your chart will hold. You’ll then pass data via the PeData.Y[subset, point] two dimensional property array.
ProEssentials uses the terms Subsets and Points but you can think of these as Rows and Columns. Passing data is as simple as filling each Subset with Points worth of data.
To enable the chart to match the size of it’s container, let us change the chart’s Dock setting.
Left click the pego control within Form1 to give it the focus.
From the main menu select [View] and [Properties Window]
Within the [Properties Window], scroll and locate the Layout section and then the Dock item.
Modify the Dock setting by clicking the center section or ‘Fill’ mode.

Adjusting design time settings…
5) We recommend setting the parent Form’s versions of back color, font, etc properties as ProEssentials will use the parent form’s settings to help facilitate a uniform look among sibling controls.
We also recommend coding your property settings as this creates a record for you and others as to what settings are being used. And you might be able to re-use this code in other areas for other charts.
If new to C#, the (Name) property is probably the most fundamental property as its name is reflected in all code. For example: pego1.PeData.Subsets = 1; is a line of code, and it shows how the (Name) property (pego1) starts the line.

Form1.cs [Code]…
6) Double click Form1’s Title/Caption Bar to open the code view for «Form1.cs» with default Form1_Load event initialized.
The cursor will be within the Form1_Load code section, enter the following code into this section.
You can copy and paste, but hand-typing a few lines of this code will help familiarize yourself with the Gigasoft.ProEssentials namespace.
Note: adding the following using declaration at the top of «Form1.cs» will shorten enumeration syntax.
using Gigasoft.ProEssentials.Enums;
// Simple to code = simple to implement and maintain //
pego1.PeString.MainTitle = «Hello World»;
pego1.PeString.SubTitle = «»;
pego1.PeData.Subsets = 2; // Subsets = Rows //
pego1.PeData.Points = 6; // Points = Columns //
pego1.PeData.Y[0, 0] = 10; pego1.PeData.Y[0, 1] = 30;
pego1.PeData.Y[0, 2] = 20; pego1.PeData.Y[0, 3] = 40;
pego1.PeData.Y[0, 4] = 30; pego1.PeData.Y[0, 5] = 50;
pego1.PeData.Y[1, 0] = 15; pego1.PeData.Y[1, 1] = 63;
pego1.PeData.Y[1, 2] = 74; pego1.PeData.Y[1, 3] = 54;
pego1.PeData.Y[1, 4] = 25; pego1.PeData.Y[1, 5] = 34;
pego1.PeString.PointLabels[0] = «Jan»;
pego1.PeString.PointLabels[1] = «Feb»;
pego1.PeString.PointLabels[2] = «Mar»;
pego1.PeString.PointLabels[3] = «Apr»;
pego1.PeString.PointLabels[4] = «May»;
pego1.PeString.PointLabels[5] = «June»;
pego1.PeString.SubsetLabels[0] = «For .Net Framework»;
pego1.PeString.SubsetLabels[1] = «or MFC, ActiveX, VCL»;
pego1.PeString.YAxisLabel = «Simple Quality Rendering»;
pego1.PeColor.SubsetColors[0] = Color.FromArgb(60, 0, 180, 0);
pego1.PeColor.SubsetColors[1] = Color.FromArgb(180, 0, 0, 130);
pego1.PeColor.BitmapGradientMode = false;
pego1.PeColor.QuickStyle = Gigasoft.ProEssentials.Enums.QuickStyle.LightShadow;
pego1.PeTable.Show = Gigasoft.ProEssentials.Enums.GraphPlusTable.Both;
pego1.PeData.Precision = Gigasoft.ProEssentials.Enums.DataPrecision.NoDecimals;
pego1.PeFont.Label.Bold = true;
pego1.PePlot.Method = Gigasoft.ProEssentials.Enums.GraphPlottingMethod.Bar;
pego1.PePlot.Option.GradientBars = 8;
pego1.PePlot.Option.BarGlassEffect = true;
pego1.PeLegend.Location = Gigasoft.ProEssentials.Enums.LegendLocation.Left;
pego1.PePlot.DataShadows = Gigasoft.ProEssentials.Enums.DataShadows.ThreeDimensional;
pego1.PeFont.FontSize = Gigasoft.ProEssentials.Enums.FontSize.Large;
pego1.PePlot.SubsetLineTypes[0] = Gigasoft.ProEssentials.Enums.LineType.MediumSolid;
pego1.PePlot.SubsetLineTypes[1] = Gigasoft.ProEssentials.Enums.LineType.MediumDash;
// This enables data hot spots, But we need to define code in the HotSpot event //
pego1.PeUserInterface.HotSpot.Data = true;
// These settings will be used for all charts //
pego1.PeConfigure.RenderEngine = Gigasoft.ProEssentials.Enums.RenderEngine.Direct2D;
pego1.PeConfigure.PrepareImages = true;
pego1.PeConfigure.CacheBmp = true;
pego1.PeConfigure.AntiAliasGraphics = true;
pego1.PeConfigure.AntiAliasText = true;
// Call this at end of setting properties //
pego1.PeFunction.ReinitializeResetImage();
pego1.Refresh(); // call standard .NET Refresh method to force paint
Your project code should look similar to…

Adding a DataHotSpot event…
7) The code above enabled the DataHotSpot event, so we should place some appropriate code in the DataHotSpot event.
Left click the pego control within Form1 to give it the focus.
From the main menu select [View] and [Properties Window]
Within the [Properties Window], click the event icon.
Within the available events, double-click PeDataHotSpot
This opens the code view of «Form1.cs» with cursor within the pego1.PeDataHotSpot event handler.

Add the following code to the pego1.PeDataHotSpot event.
System.Windows.Forms.MessageBox.Show(«Subset » + e.SubsetIndex.ToString() +
«, Point » + e.PointIndex.ToString() + » with a value of » +
pego1.PeData.Y[e.SubsetIndex, e.PointIndex].ToString());
Success!!!
 Save and run the project. Your project will show an image as follows. Move the mouse over a bar and click to trigger the DataHotSpot event.
This completes this walkthrough.
Please read the remaining sections within Chapter 2 and review the demo code and documentation that’s installed with the eval/product.
Once installed, the demo program can be accessed via shortcut…
Start / ProEssentials v9 / PeDemo
Note that our main charting demo is replicated in WPF and Winform C#.NET, VB.NET, VC++ MFC, Delphi, Builder all accessible from where you installed ProEssentials. These are great for modifying an existing demo to test potential modifications before implementing within your applications.
