- Install
Matplotlibin PyCharm - Manually Install
Matplotlibin PyCharm - Types of Plots With
Matplotlib - Conclusion

Matplotlib is a Python script module used to make 2D graphs and plots. With features to control line styles, font attributes, formatting axes, and other features.
It offers various graphs and plots, including error charts, bar charts, power spectra, and histograms.
Matplotlib is a multi-platform data visualization package created to deal with the larger SciPy stack and is based on NumPy arrays. One of the visualization’s biggest advantages is that it gives us visual access to vast volumes of data in forms that are simple to understand.
Install Matplotlib in PyCharm
To install the Matplotlib module in PyCharm IDE, run the following code in the IDE’s terminal.
C:UsersYour Name>pip install matplotlib
Then import the Matplotlib module into your program in PyCharm IDE using the import keyword.
Manually Install Matplotlib in PyCharm
To manually install the famous data visualization library matplotlib in your PyCharm IDE, follow the following steps.
-
Go to PyCharm IDE.
-
Create a Python project.
-
Go to
Fileon the top bar and selectProjectfromSettings. -
Click on the
Python Interpreterto reach the package section. -
Click on the
+symbol which indicates that install a new package or library. -
Clicking on the
+symbol will open a new window, now search formatplotliband click on the suggested one. -
Click
Install Package. -
Once installed, you will get the message
package matplotlib installed successfully. -
Now you can import it into your current project using the
importkeyword.
Types of Plots With Matplotlib
As we mentioned above, you can make many different plots and graphs with the help of the Matplotlib library. So, here we are going to discuss some of them.
Line Plot With Matplotlib
As its name describes, the line plot forms a straight line on the x and y-axis. You need to insert the parameters in an array form that will create a straight 2D line.
import sys
import matplotlib
%matplotlib inline

import matplotlib.pyplot as plt
import numpy as np

xpoints = np.array([2, 6])
ypoints = np.array([5, 12])

plt.plot(xpoints, ypoints)
plt.show()
Output:
Matplotlib Marker
A unique method of managing markers in Matplotlib graphs is called Matplotlib Marker. Graphs can be customized using marker functions because they come with various markers and other indicating icons.
The following are a few of the most commonly used markers.
| Markers | Description |
|---|---|
. |
point |
, |
pixel |
o |
circle |
Let’s understand all these with the help of examples.
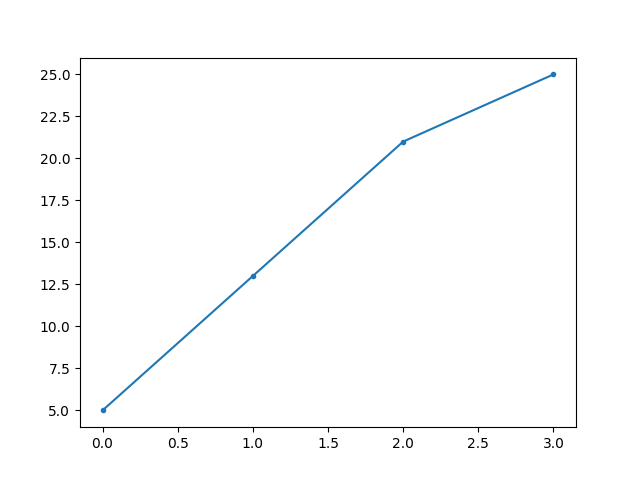
for Point Marker
To form this, we use . here is the code:
import sys
import matplotlib
%matplotlib inline

import matplotlib.pyplot as plt
import numpy as np

ypoints = np.array([5, 13, 21, 25])

# for point marker

plt.plot(ypoints, marker = '.')
plt.show()
Output:
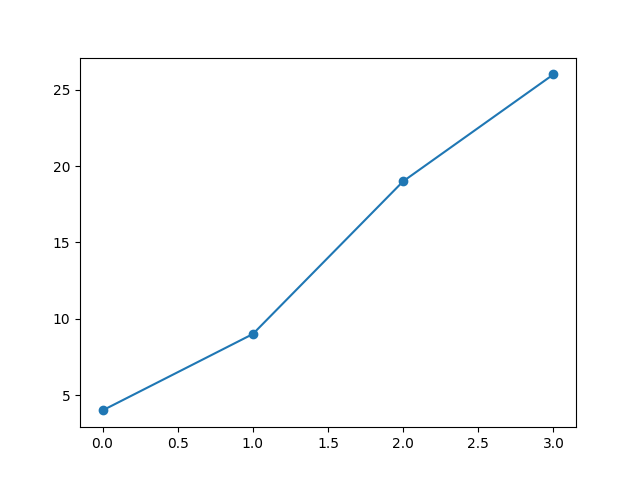
for Circle Marker
Use the following code to make a o (circle) marker:
import sys
import matplotlib
%matplotlib inline

import matplotlib.pyplot as plt
import numpy as np

ypoints = np.array([4, 9, 19, 26])

# for circle
plt.plot(ypoints, marker = 'o')
plt.show()
Output:
Matplotlib Grid
The grid inside the graphic can be shown or hidden using the axes object’s grid() function.
Following is the code for the Matplotlib grid:
import sys
import matplotlib
%matplotlib inline

import numpy as np
import matplotlib.pyplot as plt

x = np.array([60, 65, 70, 75, 80, 85, 90, 95, 100, 105])
y = np.array([140, 150, 160, 170, 180, 190, 200, 210, 220, 230])

plt.plot(x, y)

plt.grid()

plt.show()
Output:

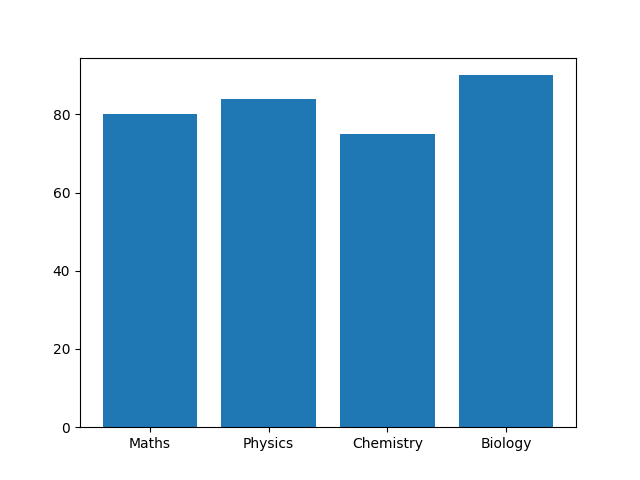
Matplotlib Bar
To show the progress of values of different categories, you can use the bar() function.
import sys
import matplotlib
%matplotlib inline

import matplotlib.pyplot as plt
import numpy as np

x = np.array(["Maths", "Physics", "Chemistry", "Biology"])
y = np.array([80, 84, 75, 90])

plt.bar(x,y)
plt.show()
Output:
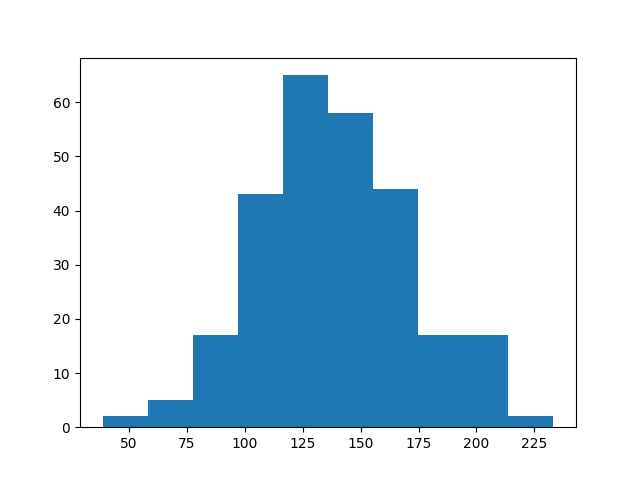
Matplotlib Histogram
The histogram graph explains the frequency distribution in a given interval.
import sys
import matplotlib
%matplotlib inline

import matplotlib.pyplot as plt
import numpy as np

x = np.random.normal(140, 30, 270)

plt.hist(x)
plt.show()
Output:
Conclusion
Matplotlib creates a 2D graph to visualize the inserted information. In this article, we tried to cover all the main graphs that can be plotted with the help of the Matplotlib module.
The compatibility of Matplotlib with a wide range of operating systems and graphics backends is one of its key advantages. You can rely on Matplotlib to function no matter what operating system you use or the output format you prefer.
In this tutorial, you operate in Scientific Mode and use Matplotlib and NumPy packages to run and debug a Python code with data visualization.
Before you start, make sure that Conda is installed.
Creating a Scientific project
Create a PyCharm project with the scientific settings predefined
-
Open the New Project wizard (File | New | Project).
-
Choose Scientific project type.
-
In the project settings dialog window, specify a project name, ensure that Conda is selected as the new environment, and alter the default data folder (if needed), then click Create.
-
Open the main.py file and add the following code sample:
import numpy as np
import matplotlib.pyplot as plt
N = 50
x = np.random.rand(N)
y = np.random.rand(N)
colors = np.random.rand(N)
area = np.pi * (15 * np.random.rand(N))**2 # 0 to 15 point radii
plt.scatter(x, y, s=area, c=colors, alpha=0.5)
plt.show()X = np.linspace(-np.pi, np.pi, 256,endpoint=True)
C,S = np.cos(X), np.sin(X)plt.plot(X, C, color=»blue», linewidth=2.5, linestyle=»-«)
plt.plot(X, S, color=»red», linewidth=2.5, linestyle=»-«)plt.xlim(X.min()*1.1, X.max()*1.1)
plt.xticks([-np.pi, -np.pi/2, 0, np.pi/2, np.pi],
[r’$-pi$’, r’$-pi/2$’, r’$0$’, r’$+pi/2$’, r’$+pi$’])plt.ylim(C.min()*1.1,C.max()*1.1)
plt.yticks([-1, 0, +1],
[r’$-1$’, r’$0$’, r’$+1$’])plt.show()
-
Process warnings shown for the
numpyandmatplotlibimports and enable the packages in the project.
Running
Run your scientific project Shift+F10. The code is executed and shows two graphs in the SciView. Clicking the preview thumbnail displays the respective graph:

You can modify the project code to plot only one graph at a time. In the scientific mode, you can execute fragments of your code by creating code cells.
To execute code cells:
-
Modify the main.py file by adding the «#%%» lines.

-
In the gutter, click the icon
 Ctrl+Enter on line with the scatter plot cell mark. Only the scatter graph will be built.
 -
Now click the icon
or press Ctrl+Enter on the line with the y versus x plot cell mark. The corresponding graph should appear.

Debugging
Let’s put a breakpoint at the line:
plt.show()
This line appears twice in our example code, and so there will be two breakpoints.
Right-click the editor background and from the context menu choose Debug ‘main’.
You see the Debug tool window and the grey characters in the editor. This is the result of the inline debugging, which is enabled.
The line with the first breakpoint is blue highlighted. It means that the debugger has stopped at the line with the breakpoint, but has not yet executed it. If we execute this line (for example, by clicking the  button on the stepping toolbar of the Debug tool window), we’ll see the graph:

Next, look at the Variables tab of the Debug tool window. If you click the View as Array link nearby the area array, the Data tab in the SciView window opens:

When you process excessive amount of data, you might experience degradation of debugging performance if the debugger loads variable’s values synchronously or asynchronously. It is recommended to switch to the On demand mode by selecting the corresponding loading policy. See Managing Variables Loading Policy for more information.
Mind the only row of figures in the Data tab in the SciView — it’s explained by the fact that the area array is one-dimensional.
Running in console
Right-click the editor background and choose the Run File in Console command:

This command corresponds to running a run/debug configuration for the main.py file with the Run with Python console checkbox selected:

When this command is run, the >>> prompt appears after the output in the Run tool window, and you can execute your own commands.
Summary
So, what has been done with the help of PyCharm?
-
The file main.py was created and opened for editing.
-
The source code has been entered (note the powerful PyCharm’s code completion!)
-
The source code has been run and debugged.
-
Finally, we ran the file in console.
Last modified: 18 November 2022
Matplotlib is the most important Python library for data visualization and plotting. Every data scientist, machine learning engineer, and financial analyst working with Python needs it!
Problem Formulation: Given a PyCharm project. How to install the Matplotlib library in your project within a virtual environment or globally?
Here’s a solution that always works:
- Open
File > Settings > Projectfrom the PyCharm menu. - Select your current project.
- Click the
Python Interpretertab within your project tab. - Click the small
+symbol to add a new library to the project. - Now type in the library to be installed, in your example
"matplotlib"without quotes, and clickInstall Package. - Wait for the installation to terminate and close all popup windows.
Here’s the installation process as a short animated video—it works analogously for Matplotlib, just type in “matplotlib” in the search field instead:
Make sure to select only “matplotlib” because there are many other packages that are not required but also contain the term “matplotlib” (False positives):

Alternatively, you can run the pip install matplotlib command in your PyCharm “Terminal” view:
$ pip install matplotlib

Feel free to check out the following free email academy with Python cheat sheets to boost your coding skills!
To become a PyCharm master, check out our full course on the Finxter Computer Science Academy available for free for all Finxter Premium Members:


While working as a researcher in distributed systems, Dr. Christian Mayer found his love for teaching computer science students.
To help students reach higher levels of Python success, he founded the programming education website Finxter.com. He’s author of the popular programming book Python One-Liners (NoStarch 2020), coauthor of the Coffee Break Python series of self-published books, computer science enthusiast, freelancer, and owner of one of the top 10 largest Python blogs worldwide.
His passions are writing, reading, and coding. But his greatest passion is to serve aspiring coders through Finxter and help them to boost their skills. You can join his free email academy here.
Вы также можете попробовать установить PyCharm на шаге 5, может быть быстрее.
1. Сочетание клавиш WIN + R, введите CMD, чтобы открыть командную окно DOS.
2. Хотя у меня есть PIP во время загрузки Python, я обновить PIP, введите обновленную команду PIP:
python -m pip install --upgrade pip
3. Использование PIP для загрузки Matplotlib:
Если вы используете команду непосредственно:pip install matplotlibТрудно добиться успеха.
Укажите внутреннее зеркальное отображение при установке модуля:
Pip Install Package - I http://pypi.douban.com/simple/ --trusted-host pypi.douban.comНапример, я установил Matplotlib следующим образом:
C:UsersBlessing Lee>pip install matplotlib -i http://pypi.douban.com/simple/ --trusted-host pypi.douban.com
Looking in indexes: http://pypi.douban.com/simple/
Collecting matplotlib
  Downloading http://pypi.doubanio.com/packages/f7/5f/6983747ae9ca4c731ef16630a8729aaa81fe29f7cc2a5ac4b0b572b8252d/matplotlib-3.2.2-cp38-cp38-win_amd64.whl (9.2 MB)
     |████████████████████████████████| 9.2 MB 3.3 MB/s
Collecting cycler>=0.10
  Downloading http://pypi.doubanio.com/packages/f7/d2/e07d3ebb2bd7af696440ce7e754c59dd546ffe1bbe732c8ab68b9c834e61/cycler-0.10.0-py2.py3-none-any.whl (6.5 kB)
Collecting numpy>=1.11
  Downloading http://pypi.doubanio.com/packages/df/f3/3fdea08ad680100b5e7abf810a154ce142a63266df1abfdca5cb0f66cca1/numpy-1.19.0-cp38-cp38-win_amd64.whl (13.0 MB)
     |████████████████████████████████| 13.0 MB 6.8 MB/s
Collecting pyparsing!=2.0.4,!=2.1.2,!=2.1.6,>=2.0.1
  Downloading http://pypi.doubanio.com/packages/8a/bb/488841f56197b13700afd5658fc279a2025a39e22449b7cf29864669b15d/pyparsing-2.4.7-py2.py3-none-any.whl (67 kB)
     |████████████████████████████████| 67 kB 3.0 MB/s
Collecting python-dateutil>=2.1
  Downloading http://pypi.doubanio.com/packages/d4/70/d60450c3dd48ef87586924207ae8907090de0b306af2bce5d134d78615cb/python_dateutil-2.8.1-py2.py3-none-any.whl (227 kB)
     |████████████████████████████████| 227 kB 6.4 MB/s
Collecting kiwisolver>=1.0.1
  Downloading http://pypi.doubanio.com/packages/37/97/cec83ff97d2c5190094e1331e32900b3c51623abbb1d8de229c119588375/kiwisolver-1.2.0-cp38-none-win_amd64.whl (58 kB)
     |████████████████████████████████| 58 kB 1.6 MB/s
Collecting six
  Downloading http://pypi.doubanio.com/packages/ee/ff/48bde5c0f013094d729fe4b0316ba2a24774b3ff1c52d924a8a4cb04078a/six-1.15.0-py2.py3-none-any.whl (10 kB)
Installing collected packages: six, cycler, numpy, pyparsing, python-dateutil, kiwisolver, matplotlib
Successfully installed cycler-0.10.0 kiwisolver-1.2.0 matplotlib-3.2.2 numpy-1.19.0 pyparsing-2.4.7 python-dateutil-2.8.1 six-1.15.0
4. Введите список PIP, чтобы увидеть, какие пакеты вы установили
C:UsersBlessing Lee>pip list
Package         Version
--------------- -------
cycler          0.10.0
kiwisolver      1.2.0
matplotlib      3.2.2
numpy           1.19.0
pip             20.1.1
pyparsing       2.4.7
python-dateutil 2.8.1
setuptools      41.2.0
six             1.15.0

C:UsersBlessing Lee>
В это время простоя должен быть в состоянии использовать его непосредственно. Вы можете проверить это с помощью метода конечных испытаний.
5. PPLOTLIB в PyCharm:
Открыть PyCharm, выберите Файл-Настройки (File — Set), а затем нажмите на Porject (как показано ниже)

Если у вас есть пакет, который вы установите под пакет, вы можете использовать его. Но если нет, то вы можете скачать его здесь:
6. Скачать Matplotlib прямо в PyCharm:
Нажмите на маленькую сторону с правой стороны верхней части.+ После:

Настройте путь загрузки:
http://pi.douban.com/simple/ # путь такой же, как и раньше Я попробовал оригинальный путь загрузки и Alibaba Cloud путь загрузки ошибка, и нет никаких проблем с Douban.

После настройки пути, выберите Нажмите для загрузки, вы можете. (Сконфигурированной, в основном не проблема)
7. Тест: Использование PyCharm или Идель запустить Netizen код:
import numpy as np
import matplotlib.pyplot as plt
t = np.arange(0., 4., 0.1)
plt.plot(t, t, t, t+2, t, t**2)
plt.show()
#      , контент завершен
В результате ОК следующим образом:
Scientific mode tutorial
In this tutorial, you operate in Scientific Mode and use Matplotlib and NumPy packages to run and debug a Python code with data visualization.
Before you start, ensure the following is installed:
Creating a Scientific project
Create a PyCharm project with the scientific settings predefined
Open the New Project wizard ( File | New | Project ).
Choose Scientific project type.
In the project settings dialog window, specify a project name, ensure the Conda is selected as the new environment, and alter the default data folder (if needed), then click Create .
Open the main.py file and add the following code sample:
Process warnings shown for the numpy and matplotlib imports and enable the packages in the project.
Running
Run your scientific project Shift+F10 . The code is executed and shows two graphs in the SciView. Clicking the preview thumbnail displays the respective graph:

You can modify the project code to plot only one graph at a time. In the scientific mode, you can execute fragments of your code by creating code cells.
To execute code cells:
Modify the main.py file by adding the «#%%» lines.
In the gutter, click the icon Ctrl+Enter on line with the scatter plot cell mark. Only the scatter graph will be built.
Now click the icon or press Ctrl+Enter on the line with the y versus x plot cell mark. The corresponding graph should appear.
Debugging
Let’s put a breakpoint at the line:
This line appears twice in our example code, and so there will be two breakpoints.
Right-click the editor background and from the context menu choose Debug ‘main’ .
You see the Debug tool window and the grey characters in the editor. This is the result of the inline debugging, which is enabled.
The line with the first breakpoint is blue highlighted. It means that the debugger has stopped at the line with the breakpoint, but has not yet executed it. If we execute this line (for example, by clicking the button on the stepping toolbar of the Debug tool window), we’ll see the graph:

Next, look at the Variables tab of the Debug tool window. If you click the View as Array link nearby the area array, the Data tab in the SciView window opens:

When you process excessive amount of data, you might experience degradation of debugging performance if the debugger loads variable’s values synchronously or asynchronously . It is recommended to switch to the On demand mode by selecting the corresponding loading policy. See Managing Variables Loading Policy for more information.
Mind the only row of figures in the Data tab in the SciView — it’s explained by the fact that the area array is one-dimensional.
Running in console
Right-click the editor background and choose the Run File in Console command:

This command corresponds to running a run/debug configuration for the main.py file with the Run with Python console checkbox selected:

When this command is run, the >>> prompt appears after the output in the Run tool window, and you can execute your own commands.
Summary
So, what has been done with the help of PyCharm?
The file main.py was created and opened for editing.
The source code has been entered (note the powerful PyCharm’s code completion!)
Can’t install matplotlib to pycharm
I have recently started to learn python programming using Python Crash Course. I am stuck as I can’t get matplotlib to work in pycharm.
I have pip installed. I have installed matplotlib using pip via command prompt.
Now, when I open pycharm and go file->settings->project interpreter->download packages and find and press install for matplotlib, I get an error: Command «python setup.py egg_info» failed with error code 1 in C:UsersTonyAppDataLocalTemppip-install-f2h0rvbbmatplotlib . When installing on pycharm it says its using cached file from website I didn’t download my matplotlib from.
I have tried «pip install matplotlib» from pycharm terminal and get the same error.
I have tried typing «pip install matplotlib» from cmd and it does so and says its already satisfied.
Any help or guidance would be appreciated, thanks.
3 Answers 3
Managed to get it to work by typing into pycharm terminal:
pip install updates
Then I went to file->settings->project interpreter-> then found pip via search and updated it again to be more sure. Once pip version on left hand side of column in file->settings->project interpreter showed the version to be the newest 20.0.2 which was == to the right hand side(latest version) column it was 100% updated. This can be done also by pressing the upgrade button just above the ‘show early releases’ button which looks like an eye just to the right of the right hand side column when you have already clicked on the package.
To finish I went file->settings->project interpreter-> found matplotlib and installed package successfully.
Русские Блоги
Как установить Matplotlib в Python и использовать в PyCharm или IDLE
Вы также можете попробовать установить PyCharm на шаге 5, может быть быстрее.
1. Сочетание клавиш WIN + R, введите CMD, чтобы открыть командную окно DOS.
2. Хотя у меня есть PIP во время загрузки Python, я обновить PIP, введите обновленную команду PIP:
3. Использование PIP для загрузки Matplotlib:
Если вы используете команду непосредственно:pip install matplotlibТрудно добиться успеха.
Укажите внутреннее зеркальное отображение при установке модуля:
Например, я установил Matplotlib следующим образом:
4. Введите список PIP, чтобы увидеть, какие пакеты вы установили
В это время простоя должен быть в состоянии использовать его непосредственно. Вы можете проверить это с помощью метода конечных испытаний.
5. PPLOTLIB в PyCharm:
Открыть PyCharm, выберите Файл-Настройки (File — Set), а затем нажмите на Porject (как показано ниже)
Если у вас есть пакет, который вы установите под пакет, вы можете использовать его. Но если нет, то вы можете скачать его здесь:
6. Скачать Matplotlib прямо в PyCharm:
Нажмите на маленькую сторону с правой стороны верхней части. + После:
Настройте путь загрузки:
Я попробовал оригинальный путь загрузки и Alibaba Cloud путь загрузки ошибка, и нет никаких проблем с Douban.
После настройки пути, выберите Нажмите для загрузки, вы можете. (Сконфигурированной, в основном не проблема)
7. Тест: Использование PyCharm или Идель запустить Netizen код:
В результате ОК следующим образом:
Из песочницы, Программирование, Python
Рекомендация: подборка платных и бесплатных курсов создания сайтов — https://katalog-kursov.ru/
Язык программирования Python считается достаточно простым. На нем легче и быстрее пишутся программы, по сравнению с компилируемыми языками программирования. Для Python существует множество библиотек, позволяющих решать практически любые задачи. Есть, конечно, и минусы и другие нюансы, но это отдельная тема.
Довольно часто я вижу, как мои знакомые и друзья начинают изучать Python и сталкиваются с проблемой установки и использования сторонних библиотек. Они могут несколько часов потратить на установку библиотеки, и даже, могут не справиться с этим и забить на неё. В то время как, в большинстве случаев, это можно было сделать за несколько минут.
Статья начинается с базовых вещей: с установки Python 3, инструментов разработки Pip и Virtualenv и среды разработки PyCharm в Windows и в Ubuntu. Для многих это не представляет трудностей и возможно, что уже всё установлено.
После чего будет то, ради чего задумывалась статья, я покажу как в PyCharm создавать и использовать виртуальные окружения и устанавливать в них библиотеки с помощью Pip.
Установка Python и Pip
Pip является менеджером пакетов для Python. Именно с помощью него обычно устанавливаются модули/библиотеки для разработки в виде пакетов. В Windows Pip можно установить через стандартный установщик Python. В Ubuntu Pip ставится отдельно.
Установка Python и Pip в Windows
Для windows заходим на официальную страницу загрузки, где затем переходим на страницу загрузки определенной версии Python. У меня используется Python 3.6.8, из-за того, что LLVM 9 требует установленного Python 3.6.
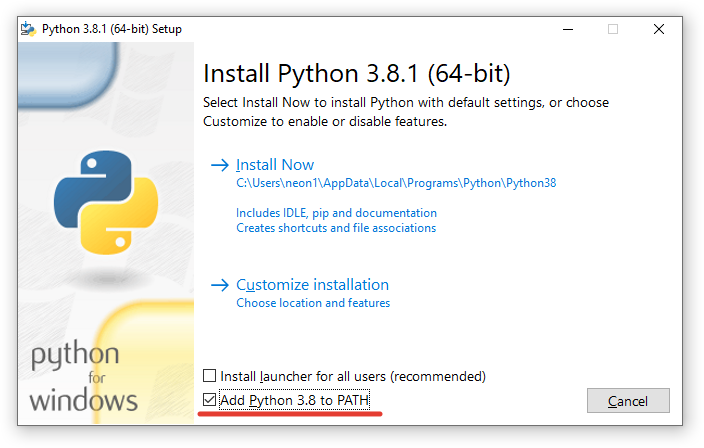
Далее в таблице с файлами выбираем «Windows x86-64 executable installer» для 64-битной системы или «Windows x86 executable installer» для 32-битной. И запускаем скачанный установщик, например, для версии Python 3.8.1 он называется python-3.8.1-amd64.exe.
Во время установки ставим галочку возле Add Python 3.x to PATH и нажимаем Install Now:
Установка Python и Pip в Ubuntu
В Ubuntu установить Python 3 можно через терминал. Запускаем его и вводим команду установки. Вторая команда выводит версию Python.
sudo apt install python3-minimal
python3 -V
Далее устанавливаем Pip и обновляем его. После обновления необходимо перезапустить текущую сессию (или перезагрузить компьютер), иначе возникнет ошибка во время вызова Pip.
sudo apt install python3-pip
pip3 install --user --upgrade pip
Основные команды Pip
Рассмотрим основные команды при работе с Pip в командой строке Windows и в терминале Ubuntu.
Если виртуальные окружения не используются, то во время установки пакета(ов) полезно использовать дополнительно ключ --user, устанавливая пакет(ы) локально только для текущего пользователя.
Установка VirtualEnv и VirtualEnvWrapper
VirtualEnv используется для создания виртуальных окружений для Python программ. Это необходимо для избежания конфликтов, позволяя установить одну версию библиотеки для одной программы, и другу для второй. Всё удобство использования VirtualEnv постигается на практике.
Установка VirtualEnv и VirtualEnvWrapper в Windows
В командной строке выполняем команды:
pip install virtualenv
pip install virtualenvwrapper-win
Установка VirtualEnv и VirtualEnvWrapper в Ubuntu
Для Ubuntu команда установки будет следующей:
pip3 install --user virtualenv virtualenvwrapperПосле которой в конец ~/.bashrc добавляем:
export VIRTUALENVWRAPPER_PYTHON=/usr/bin/python3
source ~/.local/bin/virtualenvwrapper.sh
При новом запуске терминала должны будут появиться сообщения, начинающиеся на virtualenvwrapper.user_scripts creating, что говорит об успешном завершении установки.
Работа с виртуальным окружением VirtualEnv
Рассмотрим основные команды при работе с VirtualEnv в командой строке Windows и в терминале Ubuntu.
Находясь в одном из окружений, можно ставить пакеты через Pip, как обычно и нет необходимости добавлять ключ --user:
pip3 install markdownДля Windows можно указать в переменных среды WORKON_HOME для переопределения пути, где хранятся виртуальные окружения. По умолчанию, используется путь %USERPROFILE%Envs.
Установка PyCharm
PyCharm — интегрированная среда разработки для языка программирования Python. Обладает всеми базовыми вещами необходимых для разработки. В нашем случае огромное значение имеет хорошее взаимодействие PyCharm с VirtualEnv и Pip, чем мы и будем пользоваться.
Установка PyCharm в Windows
Скачиваем установщик PyCharm Community для Windows с официального сайта JetBrains. Если умеете проверять контрольные суммы у скаченных файлов, то не забываем это сделать.
В самой установке ничего особенного нету. По сути только нажимаем на кнопки next, и в завершение на кнопку Install. Единственно, можно убрать версию из имени папки установки, т.к. PyCharm постоянно обновляется и указанная версия в будущем станет не правильной.
Установка PyCharm в Ubuntu
Скачиваем установщик PyCharm Community для Linux с официального сайта JetBrains. Очень хорошей практикой является проверка контрольных сумм, так что если умеете, не ленитесь с проверкой.
Распаковываем архив с PyCharm и переименовываем папку с программой в pycharm-community, убрав версию из названия.
Теперь в директории ~/.local (Ctrl + H — Показ скрытый файлов), создаем папку opt, куда и перемещаем pycharm-community. В результате по пути /.local/opt/pycharm-community должны размещаться папки bin, help и т.д. Таким образом PyCharm будет находится в своём скромном месте и никому не будет мешать.
Далее выполняем команды в терминале:
cd /home/maksim/.local/opt/pycharm-community/bin
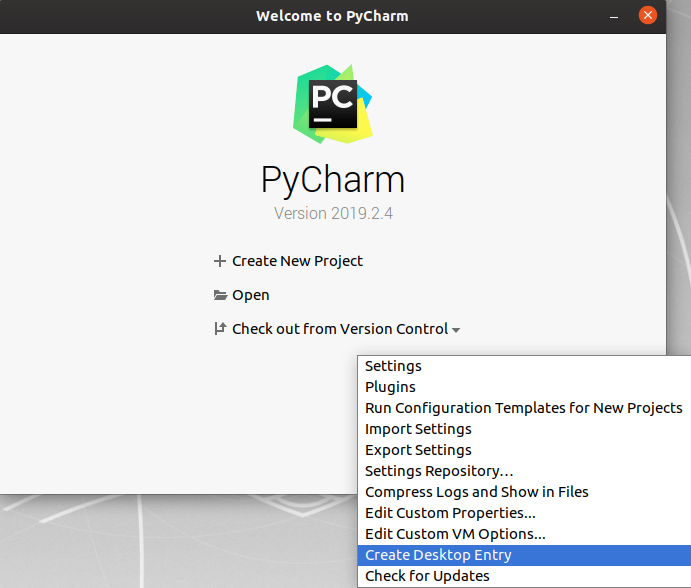
sh ./pycharm.shПроизводим установку. И очень важно в конце не забыть создать desktop файл для запуска PyCharm. Для этого в Окне приветствия в нижнем правом углу нажимаем на Configure > Create Desktop Entry.
Установка PyCharm в Ubuntu из snap-пакета
PyCharm теперь можно устанавливать из snap-пакета. Если вы используете Ubuntu 16.04 или более позднюю версию, можете установить PyCharm из командной строки.
sudo snap install pycharm-community --classicИспользование VirtualEnv и Pip в PyCharm
Поддержка Pip и Virtualenv в PyCharm появилась уже довольно давно. Иногда конечно возникают проблемы, но взаимодействие работает в основном стабильно.
Рассмотрим два варианта работы с виртуальными окружениями:
- Создаём проект со своим собственным виртуальным окружением, куда затем будут устанавливаться необходимые библиотеки;
- Предварительно создаём виртуальное окружение, куда установим нужные библиотеки. И затем при создании проекта в PyCharm можно будет его выбирать, т.е. использовать для нескольких проектов.
Первый пример: использование собственного виртуального окружения для проекта
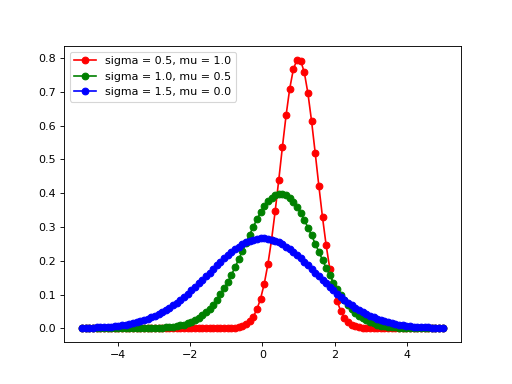
Создадим программу, генерирующую изображение с тремя графиками нормального распределения Гаусса Для этого будут использоваться библиотеки matplotlib и numpy, которые будут установлены в специальное созданное виртуальное окружение для программы.
Запускаем PyCharm и окне приветствия выбираем Create New Project.
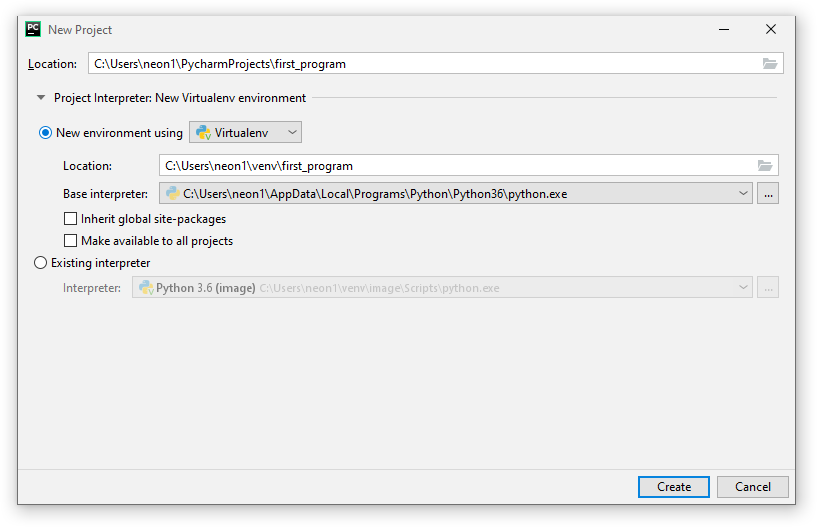
В мастере создания проекта, указываем в поле Location путь расположения создаваемого проекта. Имя конечной директории также является именем проекта. В примере директория называется ‘first_program’.
Далее разворачиваем параметры окружения, щелкая по Project Interpreter. И выбираем New environment using Virtualenv. Путь расположения окружения генерируется автоматически. В Windows можно поменять в пути папку venv на Envs, чтобы команда workon находила создаваемые в PyCharm окружения. Ставить дополнительно галочки — нет необходимости. И нажимаем на Create.
Теперь установим библиотеки, которые будем использовать в программе. С помощью главного меню переходим в настройки File > Settings. Где переходим в Project: project_name > Project Interpreter.

Здесь мы видим таблицу со списком установленных пакетов. В начале установлено только два пакета: pip и setuptools.
Справа от таблицы имеется панель управления с четырьмя кнопками:
- Кнопка с плюсом добавляет пакет в окружение;
- Кнопка с минусом удаляет пакет из окружения;
- Кнопка с треугольником обновляет пакет;
- Кнопка с глазом включает отображение ранних релизов для пакетов.
Для добавления (установки) библиотеки в окружение нажимаем на плюс. В поле поиска вводим название библиотеки. В данном примере будем устанавливать matplotlib. Дополнительно, через Specify version можно указать версию устанавливаемого пакета и через Options указать параметры. Сейчас для matplotlib нет необходимости в дополнительных параметрах. Для установки нажимаем Install Package.

После установки закрываем окно добавления пакетов в проект и видим, что в окружение проекта добавился пакет matplotlib с его зависимостями. В том, числе был установлен пакет с библиотекой numpy. Выходим из настроек.
Теперь мы можем создать файл с кодом в проекте, например, first.py. Код программы имеет следующий вид:
import matplotlib.pyplot as plt
import numpy as np

x = np.linspace(-5, 5, 100)

def gauss(sigma, mu):
    return 1/(sigma * (2*np.pi)**.5) * np.e ** (-(x-mu)**2/(2 * sigma**2))

dpi = 80
fig = plt.figure(dpi=dpi, figsize=(512 / dpi, 384 / dpi))

plt.plot(x, gauss(0.5, 1.0), 'ro-')
plt.plot(x, gauss(1.0, 0.5), 'go-')
plt.plot(x, gauss(1.5, 0.0), 'bo-')

plt.legend(['sigma = 0.5, mu = 1.0',
            'sigma = 1.0, mu = 0.5',
            'sigma = 1.5, mu = 0.0'], loc='upper left')

fig.savefig('gauss.png')
Для запуска программы, необходимо создать профиль с конфигурацией. Для этого в верхнем правом углу нажимаем на кнопку Add Configuration…. Откроется окно Run/Debug Configurations, где нажимаем на кнопку с плюсом (Add New Configuration) в правом верхнем углу и выбираем Python.
Далее указываем в поле Name имя конфигурации и в поле Script path расположение Python файла с кодом программы. Остальные параметры не трогаем. В завершение нажимаем на Apply, затем на OK.

Теперь можно выполнить программу и в директории с программой появится файл gauss.png:
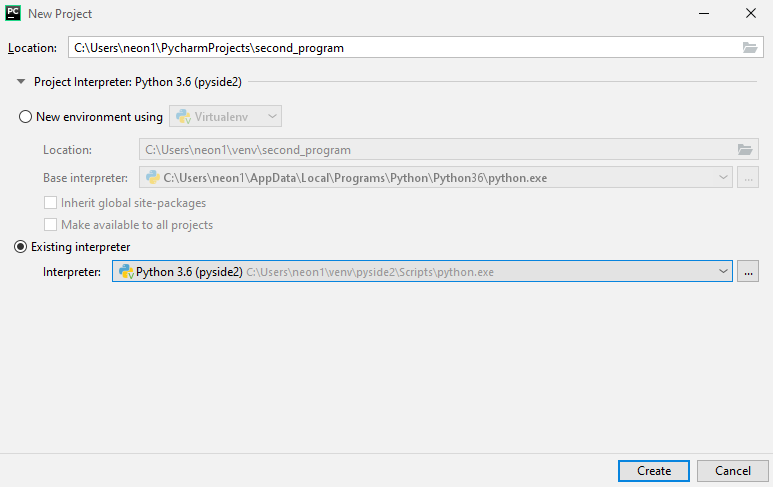
Второй пример: использование предварительно созданного виртуального окружения
Данный пример можно использовать во время изучения работы с библиотекой. Например, изучаем PySide2 и нам придется создать множество проектов. Создание для каждого проекта отдельного окружения довольно накладно. Это нужно каждый раз скачивать пакеты, также свободное место на локальных дисках ограничено.
Более практично заранее подготовить окружение с установленными нужными библиотеками. И во время создания проектов использовать это окружение.
В этом примере мы создадим виртуальное окружения PySide2, куда установим данную библиотеку. Затем создадим программу, использующую библиотеку PySide2 из предварительно созданного виртуального окружения. Программа будет показывать метку, отображающую версию установленной библиотеки PySide2.
Начнем с экран приветствия PyCharm. Для этого нужно выйти из текущего проекта. На экране приветствия в нижнем правом углу через Configure > Settings переходим в настройки. Затем переходим в раздел Project Interpreter. В верхнем правом углу есть кнопка с шестерёнкой, нажимаем на неё и выбираем Add…, создавая новое окружение. И указываем расположение для нового окружения. Имя конечной директории будет также именем самого окружения, в данном примере — pyside2. В Windows можно поменять в пути папку venv на Envs, чтобы команда workon находила создаваемые в PyCharm окружения. Нажимаем на ОК.

Далее в созданном окружении устанавливаем пакет с библиотекой PySide2, также как мы устанавливали matplotlib. И выходим из настроек.
Теперь мы можем создавать новый проект использующий библиотеку PySide2. В окне приветствия выбираем Create New Project.
В мастере создания проекта, указываем имя расположения проекта в поле Location. Разворачиваем параметры окружения, щелкая по Project Interpreter, где выбираем Existing interpreter и указываем нужное нам окружение pyside2.
Для проверки работы библиотеки создаем файл second.py со следующий кодом:
import sys

from PySide2.QtWidgets import QApplication, QLabel
from PySide2 import QtCore

if __name__ == "__main__":
    app = QApplication(sys.argv)

    label = QLabel(QtCore.qVersion())
    label.show()

    QtCore.qVersion()

    sys.exit(app.exec_())
Далее создаем конфигурацию запуска программы, также как создавали для первого примера. После чего можно выполнить программу.
Заключение
У меня нет богатого опыта программирования на Python. И я не знаком с другими IDE для Python. Поэтому, возможно, данные IDE также умеют работать с Pip и Virtualenv. Использовать Pip и Virtualenv можно в командой строке или в терминале. Установка библиотеки через Pip может завершиться ошибкой. Есть способы установки библиотек без Pip. Также создавать виртуальные окружения можно не только с помощью Virtualenv.
В общем, я лишь поделился небольшой частью опыта из данной области. Но, если не вдаваться в глубокие дебри, то этого вполне достаточно знать, чтобы писать простые программы на Python с использованием сторонних библиотек.