 Visual Syslog Сервер для Windows
 Visual Syslog Сервер для Windows
Visual Syslog Сервер для Windows это программа для получения и просмотра сообщений syslog.
Программа бесплатная с открытым исходным кодом. Лицензия GPL V2.
Visual Syslog Сервер удобен для настройки серверов, маршрутизаторов и встраиваемых систем на базе Unix/Linux.
Все что надо сделать — это перенаправить поток сообщений syslog на компьютер с установленным Visual Syslog Сервером.
Установка Visual Syslog выполняется за 1 минуту, настройка не требуется.

Возможности
- Получение сообщений от различных источников по протоколу UDP или TCP (в соответствии со стандартом RFC 3164)
- Полученные сообщения отображаются немедленно
- Сохранение сообщений в текстовых файлах на диске
- Возможность сохранять разные сообщения в разные файлы
- Разбивка сохраненных файлов на части по достижении указанного размера или по времени накопления
- Фильтрация отображаемых сообщения по коду, приоритету, наименованию узла, адресу источника, тэгу или содержимому сообщения
- Настраиваемое цветовое выделение сообщений
- Формирование различных извещений в зависимости от содержимого сообщения:
- Показ окна с предупреждением
- Проигрывание звукового файла
- Отправка электронной почты на указанный адрес
- Немедленная доставка извещений на мобильные устройства Android / iPhone:
Поддержка отправки электронной почты через SMTP сервера Gmail и iCloud с авторизацией SSL / TLS.
При приходе почтового сообщения в ящик Gmail или iCloud, немедленное извещение поступит на мобильное устройство. - Настраиваемый формат извещений
- Выполнение действий в зависимости от содержимого сообщения:
- Выполнение выбранной программы с параметрами
- Сохранение сообщения в выбранный файл
- Высокая скорость работы
- Выполняется как обычное приложение Windows с показом значка в панели задач
- Поддерживает операционные системы Windows XP/Vista/7/8/8.1, Windows Server 2003/2008/2012
- Загрузка истории сообщений после запуска программы
- Поддержка кодировки UTF8 в тексте сообщения
- Просмотр сообщений syslog из файла на диске
Получение программы
Последняя версия 1.6.4
Последняя стабильная версия 1.6.4
Установка
После установки Visual Syslog Сервер для Windows сразу готов к работе: настройка не требуется.
По умолчанию ожидает сообщений на портах 514 UDP и 514 TCP.
Программа установки добавляет исключения брандмауэра для Visual Syslog Сервер.
Компиляция из исходного кода
Для компиляции Syslog Сервера из исходных кодов используйте CodeGear RAD Studio C++Builder 2007
Файл проекта visualsyslog.cbproj
Требуются дополнительные компоненты: Indy.Sockets (VCL) version 10
Для компиляции программы установки используйте Inno Setup Compiler 5.5.1(a)
Файл проекта программы установки visualsyslog.iss
Поддержка
Ваши вопросы и предложения по улучшению программы шлите по адресу 
Планы на будущее
- Статистика полученных сообщений: сколько, с какого адреса и т.д.
Снимки экрана
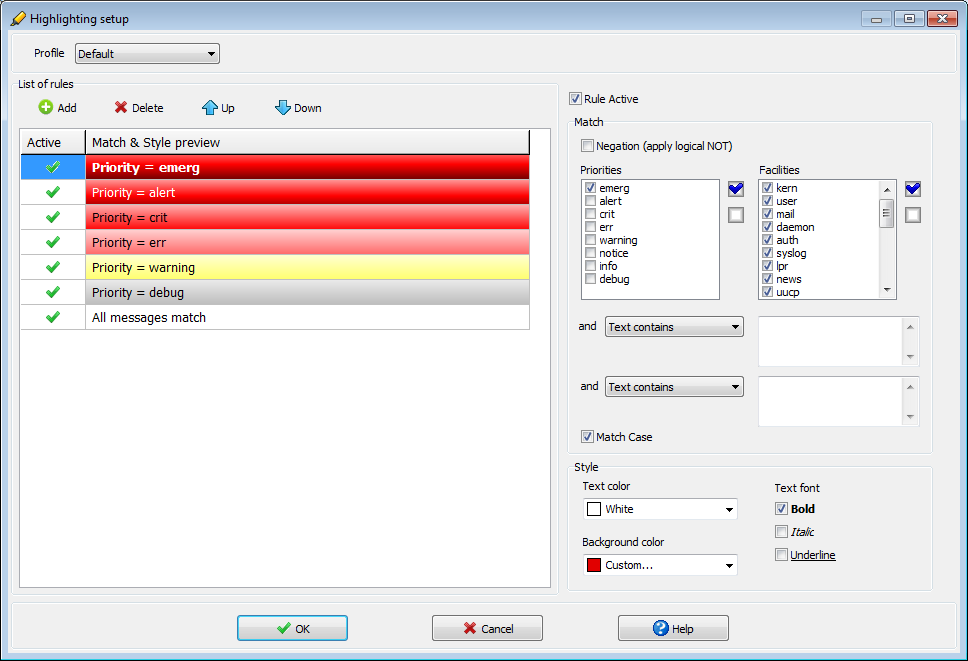
Настройка цветового выделения сообщений

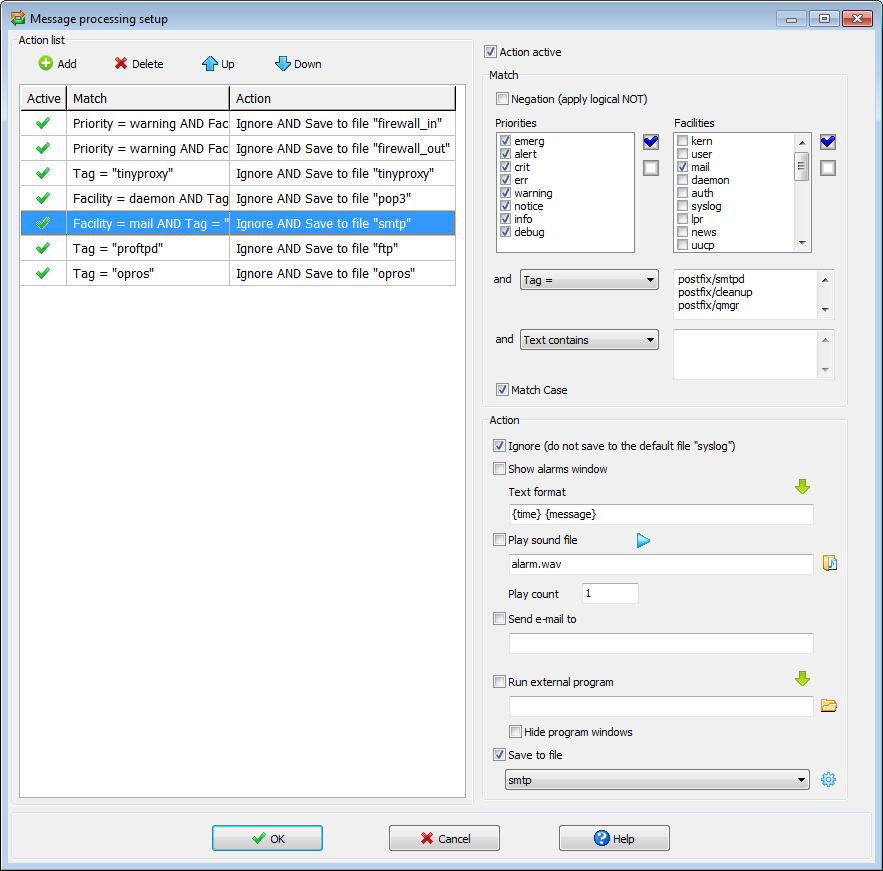
Обработка сообщений

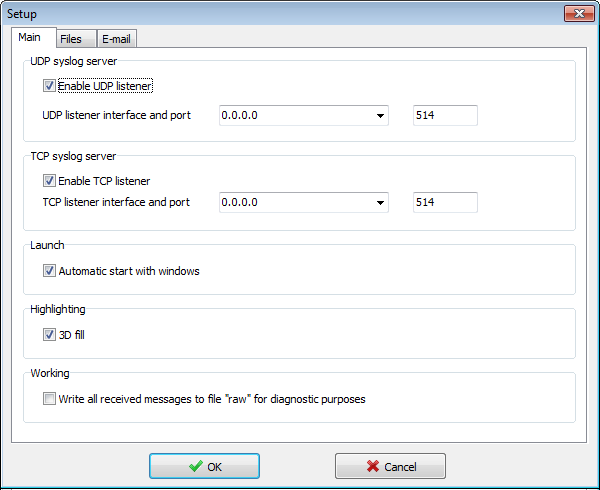
Основные параметры настройки

Настройка файлов для сохранения сообщений и разбивка их на части

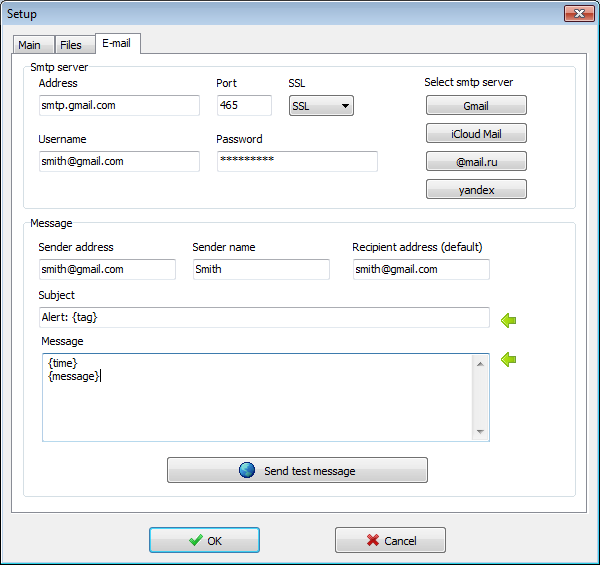
Отправка сообщений электронной почты через SMTP сервер

Configures a Syslog Server service. Multiple protocols (IPv4/IPv6
and UDP/TCP) can be configured and are supported.
When configuring Syslog Services, the functionality can be checked
using the Test Syslog Server button. It will open the Syslog Test
Message function from the configuration client.
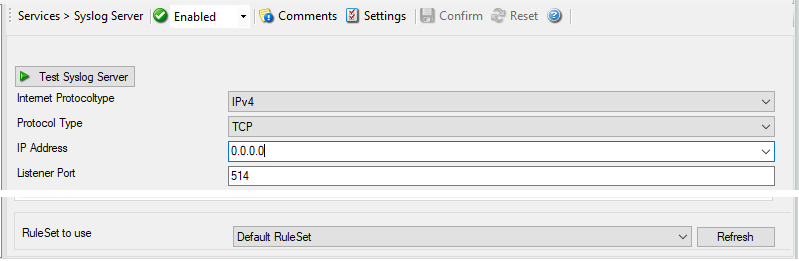
Service — Syslog Server Global Properties
Internet Protocoltype
- File Configuration field:
- nInetType
- Description:
- Select the desired protocol type. IPv4 and IPv6 are available. The
IPv6 protocol needs to be properly installed in order to be used.
Note that one Service can only handle IPv4 or IPv6, so if you want
to use both protocols, you will need to create two separate services.
Protocol Type
- File Configuration field:
- nProtocolType
- Description:
- Syslog messages can be received via UDP, TCP or
RFC 3195 RAW. One
listener can only listen to one of the protocols. Typically, Syslog
messages are received via UDP protocol, which is the default. The
syslog server also can receive Syslog messages via TCP and reliable
Syslog messages via TCP using the RFC 3195 RAW standard.
Depending on which protocol type you choose, you get different option
tabs. General and encoding are the same for everyone.
IP Address
- File Configuration field:
- szMyIPAddress
- Description:
- The Syslog Server can now be bound to a specific IP Adress. You can
either use an IPv4, an IPv6 Address, or a Hostname that resolves to an
IPv4 or IPv6 Address. This feature is useful for multihome environments
where you want to run different Syslog Servers on different IP Addresses.
Please note that the default IPaddress 0.0.0.0means ANY IP Address.
Listener Port
- File Configuration field:
- nListenPort
- Description:
- The port the Syslog server listens on. The typical (standard) value
is 514. This should be changed only if there is a definite need for
it. Such a need typically arises from security concerns. If the port
is changed, all reporting devices (routers, printers …) must also be
configured to use the non-standard port.
RuleSet to use
- File Configuration field:
- szRuleSetName
- Description:
- Name of the rule set to be used for this service. The Rule Set name
must be a valid Rule Set.
General Options
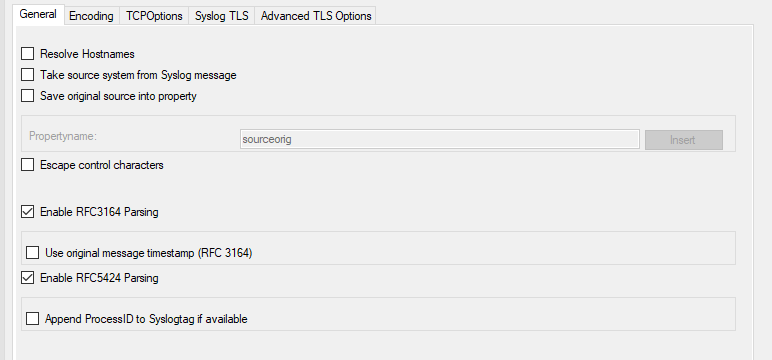
Service — Syslog Server General Tab
Resolve Hostnames
- File Configuration field:
- nResolveNames
- Description:
-
If this box is checked, the name of the source system is retrieved
via DNS reserve name resolution. If unchecked, the IP address itself
is used as the name.Please note that this setting does have any effect if the “Take
source system from Syslog message” setting is checked. In this case,
the message is always
taken from the Syslog message itself.
Take source system from Syslog message
- File Configuration field:
- nTakeSourceSysFromSyslogMsg
- Description:
-
If this box is checked, the name or IP address of the source system is
retrieved from the Syslog message itself (according to RFC 3164).
If left unchecked, it is generated based on the address, the message was
received from.Please note that there are many devices, which do NOT generate
RFC 3164 compliant messages. If you check this option here, you might
see a very strange value as the event source!
Save original source into property
- File Configuration field:
- nSaveSourceIntoProperty
- Descriptions:
- When this options is enabled, the original network source will be
stored into the custom defined property (%sourceorig% by default). In
case the original network source is needed for filtering for example.
Escape Control Characters
- File Configuration field:
- nEscapeControlCharacters
- Description:
-
Control characters are special characters. They are used e.g. for
tabulation, generating beeps and other non-printable uses. Typically,
syslog messages should not contain control characters. If they do,
control characters could eventually affect your logging. However, it
might also be that control characters are needed.With this setting, you can specify how control characters received
should be handled. When checked, control characters are replaced by a
5-byte sequence with the ASCII character ID. For example, a beep is the
ASCII BEL character. BEL is assigned the numerical code 7. So if a BEL
is received, it would be converted to “<007>” inside your syslog message.
When the box is left unchecked, no conversion takes place.In any case, ASCII NULs are converted to “<000>” to prevent
security issues in the log files.Please note: if you used double-byte character sets, control
character escaping can cause your message to become clobbered. So be
sure to leave it unchecked in that case.
Enable RFC3164 Parsing
- File Configuration field:
- nRFC3164Parsing
- Description:
- If this box is checked, RFC 3164 compliant message parsing is enabled.
If unchecked, “traditional” Adiscon message parsing is selected. If you
experience trouble with the sender host name or the timestamp, we suggest
that you turn off RFC 3164 compliant message parsing. Many existing devices do
not fully comply with RFC 3164 and this can cause those issues.
Use Original Message Timestamp
- File Configuration field:
- nParseSyslogDate
- Description:
- If this box is checked, the timestamp is retrieved from the Syslog
message itself (according to RFC 3164). If left unchecked, the
timestamp is generated based on the local system time. The Syslog
message timestamp does not contain time zone information. Thus, we
strongly recommend unchecking this box if messages from devices in
multiple time zones are to be received
Enable RFC5424 Parsing
- File Configuration field:
- nRFC5424Parsing
- Description:
- If this box is checked, RFC 5424 compliant message parsing is enabled for
Syslog RFC5424 Header detection and decoding. This also involves new useable
Syslog properties.
If unchecked, “traditional” Adiscon message parsing is selected. If you
experience trouble with the sender host name or the timestamp, we suggest
that you turn off RFC 5424 compliant message parsing. Many existing devices
do not fully comply with RFC 5424 and this can cause those issues.
Append ProcessID to SyslogTag if available
- File Configuration field:
- nRFC5424AddProcID2SyslogTag
- Description:
- This option is related to RFC5424 header parsing and was default in previous
versions. However the default now is off in order to separate the Syslogtag
from the ProcessID.
Encoding Options
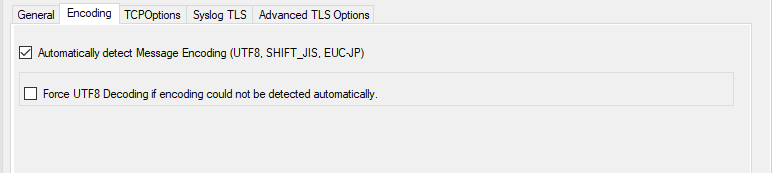
Service — Syslog Server Encoding Tab
Automatically detect Message Encoding (UTF8, SHIFT_JIS, EUCJP)
- File Configuration field:
- nTryDetectMessageEncoding
- Description:
- If enabled, the message will be checked for different encodings.
This is important if you have syslog messages with multibyte characters.
Once an encoding is detected, it will automatically be converted into UTF16
internally.
Force UTF8 Decoding
- File Configuration field:
- nForceUTF8Decoding
- Description:
- This option forces UTF8 Decoding of all incoming messages. This is also
useful for syslog messages encoded in UTF8 but missing the BOM withing the
Syslog message.
UDP Options
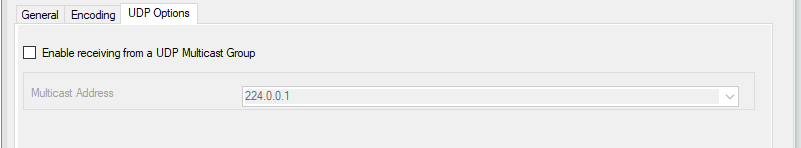
Service — Syslog Server UDP Options Tab
Enable receiving from a UDP Multicast Group
- File Configuration field:
- nEnableMultiCastGroup
- Description:
- This option supports receiving Syslog messages via multicast IP Addresses
like224.0.0.1for example.
TCP Specific Options
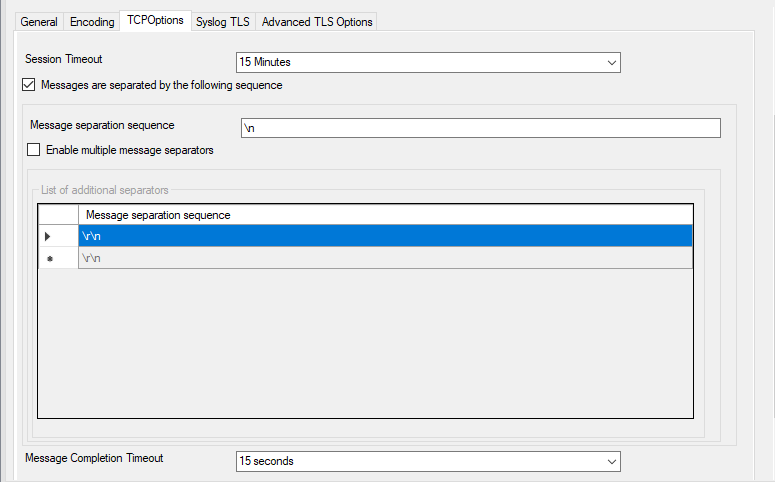
Service — Syslog Server TCP Options Tab
Session Timeout
- File Configuration field:
- nTimeOutSession
- Description:
- One of the TCP-specific options is the session timeout. This value declares,
how long a TCP session may be kept open, after the last package of data has
been sent. You can by default set values between 1 second and 1 day or you
can use a custom value with a maximum of 2147483646 milliseconds.
If you wish to disable the session timeout, you can use a custom value of 0
milliseconds to disable it.
Messages are separated by the following sequence
- File Configuration field:
- szMsgSep_[n]
- Description:
- If this option is checked, you can use multiple messages in the same
transmission and the following options are enabled: Message seperation
sequenze and Message Completion Timeout.
Message separation sequence
- File Configuration field:
- nEnableTCPMsgSep
- Description:
- Determines, how you want to separate the messages. By default “rn” is the
value for this, as most times a message ends with a carriage return and/or a
line feed. But, you can choose your own separation sequence here as well.
Enable multiple message separators
- File Configuration field:
- nEnableMultiTCPMsgSep
- Description:
- If you choose the checkbox you can use more than one message separator.
Message Completion Timeout
- File Configuration field:
- nTimeOutMsg
- Description:
- Here you can set the time that is allowed to complete a message. Is the time
exceeded, but the message not yet completed, the rest will be treated as a
new message. The counter is resetted each time, a new message begins.
You can choose from multiple values between 1 second and 1 day, or choose a
custom value in milliseconds (0 = disable, maximum = 2147483646)
Syslog TLS
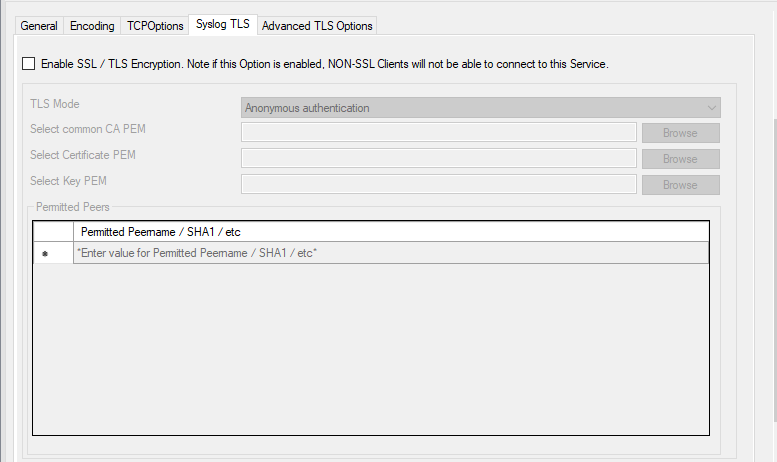
Service — Syslog Server Syslog TLS Tab
Enable SSL / TLS Encryption
- File Configuration field:
- nUseSSL
- Description:
- This option enables SSL / TLS encryption for your syslog server.
Please note, that with this option enabled, the server only accepts SSL / TLS
enabled senders.
TLS Mode
- File Configuration field:
- nTLSMode
- Description:
-
The TLS mode can be set to the following:
Anonymous authentication
Default option, which means any client certificate will be accepted, or even
none.x509/name (certificate validation and name authentication)
When this mode is selected, the subject within the client certificate will be
checked against der permitted peers list. This means the Syslog Server will
only accept the secured connection if it finds the permitted peer in the
subject.509/fingerprint (certificate fingerprint authentication)
This mode creates a SHA1 Fingerprint from the client certificate it receives,
and compares it to fingerprints from the permitted peers list. You can use
the debuglog to see fingerprints of client certificates which were not
permitted.x509/certvalid (certificate validation only)
A Syslog Sender is accepted when the client certificate is valid.
No further checks are done.
Select common CA PEM
- File Configuration field:
- szTLSCAFile
- Description:
- Select the certificate from the common Certificate Authority (CA), the syslog
receiver should use the same CA.
Select Certificate PEM
- File Configuration field:
- szTLSCertFile
- Description:
- Select the client certificate (PEM Format).
Select Key PEM
- File Configuration field:
- szTLSKeyFile
- Description:
- Select the keyfile for the client certificate (PEM Format).
Permitted Peers
Permitted Peername / SHA1 / etc.
- File Configuration field:
- szIP_[n]
- Description:
- This list contains all permitted peers. If x509/name is used, this can
contain parts of the client certificate subject. For example if you have
CN = secure.syslog.msg in the certificate subject, you can add
“secure.syslog.msg” as permitted peer. When using x509/fingerprint, this
list holds a list of permitted SHA1 fingerprints. The fingerprints can
either be generated with OpenSSL Tools or grabbed from the debug logfile.
The format is like described in RFC 5425, for example:
SHA1:2C:CA:F9:19:B8:F5:6C:37:BF:30:59:64:D5:9A:8A:B2:79:9D:77:A0.
Advanced TLS
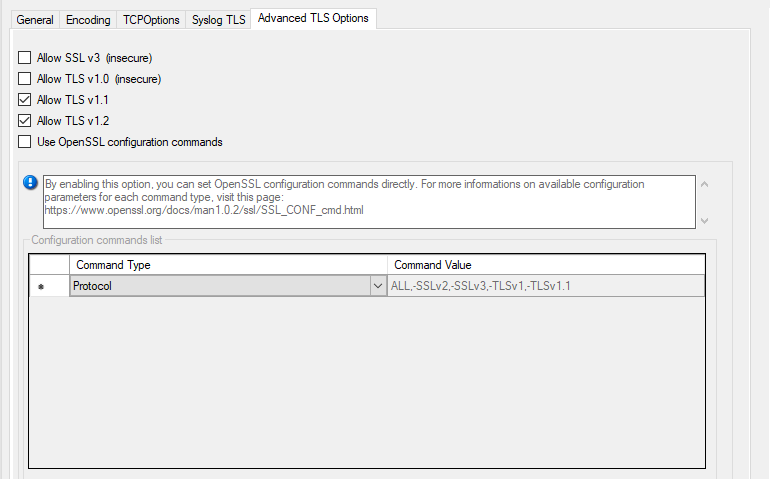
Service — Syslog Server Advanced TLS Options Tab
Allow SSL v3
- File Configuration field:
- nTLSAllowSSLv3
- Description:
- This option enables insecure protocol method SSLv3. We recommend NOT enabling
this option as SSLv3 is considered broken.
Allow SSL v1.0
- File Configuration field:
- nTLSAllowTLS10
- Description:
- This option enables insecure protocol method TLSv1. We recommend NOT enabling
this option as TLSv1 is considered broken.
Allow SSL v1.1
- File Configuration field:
- nTLSAllowTLS11
- Description:
- This option enables protocol method TLS1.1 which is enabled by default.
Allow SSL v1.2
- File Configuration field:
- nTLSAllowTLS12
- Description:
- This option enables protocol method TLS1.2 which is enabled by default.
Use OpenSSL configuration commands
- File Configuration field:
- nTLSUseConfigurationCommands
- Description:
-
By enabling this option, you can set OpenSSL configuration commands
directly. For more information’s on available configuration parameters
for each command type, visit this page:
https://www.openssl.org/docs/man1.0.2/ssl/SSL_CONF_cmd.htmlWe allow to the set the following OpenSSL configuration commands in the
configuration commands list.- CipherString: Sets the allowed/dissallowed used Ciphers. Setting this
value will OVERWRITE the internal default ciphers. - SignatureAlgorithms: This sets the supported signature algorithms
for TLS v1.2. - Curves: This sets the supported elliptic curves.
- Protocol: Sets the supported versions of the SSL or TLS protocol. This
will OVERWRITE the Allow SSL options from above! - Options: The value argument is a comma separated list of various
flags to set.
When setting advanced configuration commands, we highly recommend to enable
debug logging and review it after changes have been made. An error will be
logged in the debug logfile if a configuration command cannot be processed
successfully. - CipherString: Sets the allowed/dissallowed used Ciphers. Setting this
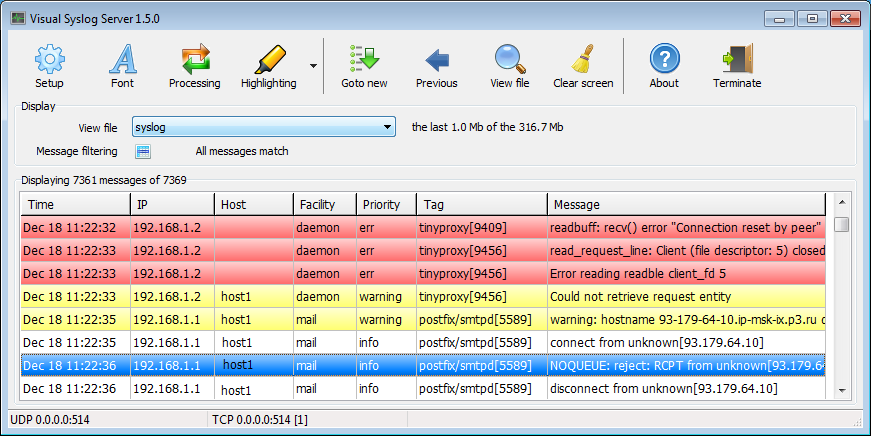
Visual Syslog Server for Windows is a free open source program to receive and view syslog messages.
Useful when setting up routers and systems based on Unix/Linux.
Visual Syslog Server for Windows has a live messages view: switches to a new received message. Helpful color highlighting.
Useful message filtering. Customizable notification and actions.
Read in Russian / Читать на русском языке
Features
- Receive messages from various devices via UDP or TCP protocol (compliant to RFC 3164)
- Syslog messages are displayed in real-time
- Stores messages in files on disk
- Log file rotation by size or by date
- Filter displayed syslog messages based on facility, priority, host, source address, tag or message contents
- Customizable color highlighting with nice 3D design
- Generating notifications depending on the content of the received message:
- Show alarms windows
- Play sound file
- Send e-mail notifications via smtp server
- Customizable notices format
- Performs actions depending on the content of the received message:
- Run external program with params
- Saving message to the specified file
- Support for sending mail via SMTP server with authentication SSL / TLS
(Support Gmail and iCloud mail smtp servers. You can use the push notifications on your mobile device for instant delivery of alarms.) - Lightweight and very fast
- Run as a Windows application
- Minimize to system tray
- Support Windows XP/Vista/7/8/8.1, Windows Server 2003/2008/2012
- Easy to install: adjustment is not required
- Import historical syslog messages after the start of the program
- View syslog messages from the file
- The ability to receive messages encoded in UTF8
- Free open source software, licensed under the GPL V2
Download
Visual Syslog Server for Windows download installer:
Last developper snapshot 1.6.2
Latest stable release 1.6.2
Installation
After installation Visual Syslog Server for Windows works immediately: adjustment is not required.
Waiting for messages on the UDP and TCP port 514 (default setting).
Visual Syslog Server is an Windows application (installing a system service is not required).
Installer adds firewall exception.
Building from sources
To build Windows Syslog Server from sources use CodeGear RAD Studio C++Builder 2007
Main project file visualsyslog.cbproj
Required components: Indy.Sockets (VCL) version 10
To build the installer, use Inno Setup Compiler 5.5.1(a)
Installer project file visualsyslog.iss
Support
Your questions and suggestions please send to 
Future plans
- Message statistics
If you need these or other functions let me know.
Screenshots
Color highlighting setup
Message processing setup
Main setup
Files rotation setup

Smtp server setup to send e-mail messages
Логи — это важно. Если устройств много, в целях удобства и резервного копирования хорошим решением является создание некоего log-сервера, на который серверы и оборудование будут свои логи по сети пересылать.
Далее речь пойдет о задаче сбора syslog-сообщений от unix-серверов и активного оборудования (cisco ios) на windows-сервере. В процессе разработки решения были найдены два opensource-продукта — syslog for windows и nxlog. Первый более прост в освоении и подходит для случаев, когда источников или немного, или не стоит задачи сортировки входящих сообщений. Второй продукт более «развесист», при его развертывании не обойтись без чтения документации, однако эта «развестистость» дает очевидно большую гибкость в решении задач сбора и сортировки входящих логов.
Теперь чуть более подробно.
Syslog for windows — это форк классического unix-демона syslog. Собранный для работы в Windows, умеет регистрироваться и работать как системная служба (конечно, возможен и «ручной» запуск). Также имеется возможность работы в режиме «multi-instance» — регистрируются несколько служб с уникальными названиями. Документация по настройке довольно куцая, однако ее вполне достаточно для написания собственного конфиг-файла, ибо софт написан под выполнение конкретной задачи сбора и хранения логов и умеет только это. Но умеет хорошо.
Для тех, кто знаком с внешниим видом юниксового syslog.conf, многое покажется знакомым — разница лишь в том, что все они пишутся в xml-«обертке». Логика файла проста — в простейшем случае должны быть описаны три сущности: источник (source), назначение (destination) и путь (logpath). У каждой из сущностей есть свой набор настроек, с помощью которых задается их поведение.
Для решения задачи сортировки входящих логов должна быть определена директива filter, работа которой основана на понятиях facility и priority. У каждого отправляемого удаленным syslog-сервером сообщения определен уровень того и другого: facility может иметь численное значение в диапазоне 0..23 или буквенное kern…debug (полный список смотрим в документации); prority, аналогично, задается или численно в диапазоне 0..7, или буквенно — emerg..debug. Таким образом, общая идея сортировки входящих сообщений — группировка по источнику (используем разные уровни facility для разных устройств) или по важности сообщений (по уровню proirity). Количество описанных фильтров и назначений не ограничено (разве что уровней facility всего 24, а удобных для работы уровней local — и того меньше, 8), главное, чтобы в каждом logpath было по одному того и другого.
В итоге может получиться такой кофигурационный файл:
<?xml version="1.0"?>
<!--
syslog.conf    Configuration file for syslogd.
        Based on Debian's syslog.conf.
-->
<conf>

<options logdir="log"/>
<source name="src_udp_0" type="udp" port="514"/>
<source name="src_udp_1" type="udp" port="515"/>

<!-- cisco switches -->
<destination name="cisco_switches" file="cisco_switches.log" rotate="monthly" backlogs="12"/>
<filter name="cisco_switches">
    <facility name="local3"/>
    <priority name="emerg"/>
    <priority name="alert"/>
    <priority name="crit"/>
    <priority name="error"/>
    <priority name="warning"/>
    <priority name="notice"/>
    <priority name="info"/>
    <priority name="debug"/>
</filter>
<logpath source="src_udp_0" filter="cisco_switches" destination="cisco_switches"/>

<!-- cisco inet routers -->
<destination name="inet_routers" file="inet_routers.log" rotate="monthly" backlogs="12"/>
<filter name="inet_routers">
    <facility name="local4"/>
    <priority name="emerg"/>
    <priority name="alert"/>
    <priority name="crit"/>
    <priority name="error"/>
    <priority name="warning"/>
    <priority name="notice"/>
    <priority name="info"/>
    <priority name="debug"/>
</filter>
<logpath source="src_udp_0" filter="inet_routers" destination="inet_routers"/>

<!-- linux firewalls -->
<destination name="linux_fw" file="linux_fw.log" rotate="daily" backlogs="30"/>
<filter name="linux_fw">
    <facility name="local1"/>
    <priority name="emerg"/>
    <priority name="alert"/>
    <priority name="crit"/>
    <priority name="error"/>
    <priority name="warning"/>
    <priority name="notice"/>
    <priority name="info"/>
    <priority name="debug"/>
</filter>
<logpath source="src_udp_1" filter="linux_fw" destination="linux_fw"/>

<!-- linux servers -->
<destination name="linux_srv" file="linux_srv.log" rotate="weekly" backlogs="10"/>
<filter name="linux_wrk">
    <facility name="local2"/>
    <priority name="emerg"/>
    <priority name="alert"/>
    <priority name="crit"/>
    <priority name="error"/>
    <priority name="warning"/>
    <priority name="notice"/>
    <priority name="info"/>
    <priority name="debug"/>
</filter>
<logpath source="src_udp_1" filter="linux_srv" destination="linux_srv"/>

<!--Сборная солянка - все логи за текущий день-->
<destination name="default" file="default.log" rotate="daily" backlogs="7"/>
<destination name="default1" file="default1.log" rotate="daily" backlogs="7"/>
<filter name="default">
    <facility name="kern"/>
    <facility name="user"/>
    <facility name="mail"/>
    <facility name="daemon"/>
    <facility name="syslog"/>
    <facility name="lpr"/>
    <facility name="news"/>
    <facility name="uucp"/>
    <facility name="cron"/>
    <facility name="ftp"/>
    <facility name="local0"/>
    <facility name="local1"/>
    <facility name="local2"/>
    <facility name="local3"/>
    <facility name="local4"/>
    <facility name="local5"/>
    <facility name="local6"/>
    <facility name="local7"/>
    <priority name="emerg"/>
    <priority name="alert"/>
    <priority name="crit"/>
    <priority name="error"/>
    <priority name="warning"/>
    <priority name="notice"/>
    <priority name="info"/>
    <priority name="debug"/>
</filter>

<logpath source="src_udp_0" filter="default" destination="default"/>
<logpath source="src_udp_1" filter="default" destination="default1"/>
Пара пояснений по ходу. С таким конфиг-файлом мы можем запустить две службы syslogd:
syslogd —install —instance cisco
syslogd —install —instance linux
одна из них зарегистрируется как syslogd_cisco и будет слушать 514/udp, другая — как syslogd_linux на порту 515/udp.
Входящие сообщения с удаленных syslog-серверов (настроенных на передачу данных на заданный сервер) пишутся в разные файлы согласно назначенным уровням facility. Опцией logdir мы задаем каталог хранения логов. В данном случае указан относительный (от места установки syslogd) путь, однако можно указывать и абсолютный.
Прямо в описании destination можно задать и опции ротации — с какой периодичностью и глубиной хранить историю (filename переименовывается в filename.1 и так далее до величины backlogs).
Помимо этого, все сообщения (включая те, что не попали ни в один из фильтров) записываются в общие log-файлы default.log и default1.log.
Практическая эксплуатация показала надежность этого решения — службы работают стабильно, друг дружке не мешают, никаких подвисаний себе не позволяют. Однако стоит помнить, что при наличии проблем в сети, связанных как с загруженностью каналов, настройкой коммутаторов или с иными причинами, данные могут быть не доставлены — протокол udp не гарантирует доставку пакетов.
Please Note: This article is valid for EventReporter in addition to WinSyslog!
Windows NT/2000/XP/2003/Vista/2008/Windows 7 systems monitoring is really important for all small to large sized enviroments. MonitorWare line of products helps to accomplish this important task. This article is to help you establish a small setup to monitor your Windows systems.
This article is strictly task focused. It does not describe why the systems should be monitor nor does it provide any further background. Please see the respective backgrounders or each of the products documentation on this. This article is a step-by-step description of what you need to do in order to centrally monitor your Windows systems.
Centralized Event Reports
In this step-by-step guide, EventReporter is configured to work together with Adiscon’s WinSysLog and MoniLog to automatically generate event summaries for the monitored servers and other devices.
This guide focuses on a typical small to medium business topography with a single geographical location and 5 Windows clients and a central hub server. All systems are well connected via a local Ethernet. Event reports from all machines should be stored in a log file. The administrator shall receive daily consolidated event reports.
What you need
In this guide, I am focusing on building a solution with Adiscon’s EventReporter, WinSyslog and MoniLog. This combination allows you to centralize all your event logs and report events from them. Free 30 day trial versions are available at the respective product sites (links below), so you can try the system without the need to buy anything.
You need to run the following products:
- one EventReporter for each system that is to be monitored. In our scenario, this means 6 copies, one for each client and one for the central hub server to be monitored. (if you want to monitor the hub server as well.)
- one WinSyslog to receive and store event reports from the EventReporter monitoring agents.
- one MoniLog to automatically generate consolidated reports based on the gathered log data in a file.
Note: Please note that to deliver MoniLog reports, you need a local web server (for example Microsoft’s IIS or Apache) and a mail server capable of talking SMTP (most modern servers support this). Make sure that you log on to each machine with a sufficiently privileged user account.
MonitorWare Console
MonitorWare Console can also be used with EventReporter and WinSyslog. MonitorWare Console is a very strong and comprehensive tool that will help you out in carrying out sophisticated analysis of your system. For more information about MonitorWare Console, please refer to its manual and to have a clear idea about Monilog and MonitorWare Console reporting features, please visit Comparision of Monilog Report and System Status Report of MonitorWare Console.
Step 1 – Download Software
Please check the web sites for new versions of respective products if you downloaded your copies a while ago. Security and monitoring is a short lived business, and new product versions can appear quickly.
Please visit www.eventreporter.com/en/download and www.winsyslog.com/en/download to download the latest versions of EventReporter and WinSyslog respectively. In addition to these, you also need the MoniLog product. A free, full-featured 30 day trial is available at www.monilog.com/en/download/.
Step 2 – Install WinSyslog
Identify the system on which WinSyslog (and probably MoniLog) should run on. Take a note of its IP address or host name. You’ll need this value when configuring the EventReporter clients. For our example, I assume this system has an IP address of 192.168.1.0.
Run the WinSyslog setup with default parameters. When setup has finished, WinSyslog automatically is configured to operate as a simple Syslog server. However, it does not yet use file logging as we need that. We’ll later setup WinSyslog to write data into a file and also to configure Syslog server service, if you do not have it.
Step 3 – Install EventReporter
Run the EventReporter setup program on all systems that should be monitored. This means you need to run it on all 5 clients and the central hub server.
For larger installations (with many more servers) there are ways to set it up in a simpler fashion, but in a scenario like ours, it is faster to install it on each machine manually. You can install it with the default settings. When setup has finished, the program automatically is configured to operate as a simple EventReporter. However, it does not yet forwards the log to Syslog server. So we will go ahead and change this on each of the machines or by launching it on one machine and remotely connecting to the others. It is your choice. In this sample, I use the EventReporter on each machine (it is easier to follow). We will also see configuring an event log monitor service, if you do not have it.
Step 4 – Install Monilog
A standard setup program installs the application. The install set (the ZIP file you downloaded) contains a standard setup program and it’s necessary helper files. Please unzip the archive to any directory you like. After unzipping, simply double-click “setup.exe” and follow the onscreen instructions.
There are also self extracting exe files available for download. If you downloaded these versions, there is no need to separately unzip the program. The self extracting version might also start the setup process automatically. If you have Windows Installer already present on the target system, you can also setup the product by simply double clicking the .MSI file. Windows Installer is present on all Windows 2000 systems.
Step 5 – Create a RuleSet to Forward by Syslog (EventReporter)
Please note that delete the previous services or rules sets to follow or save those to registry file not binary for later use. To save your settings follow the link and just dont zip & send that file to us.
The steps to configure the EventReporters are as follows (repeat this on each of the 5 client machines). This step needs not to be done on the central hub server as well!:
1. Start EventReporter.
2. Select your language – in this example, I use English, so it might be a good idea to choose English even if that is not your preference. You can change it any time later, but using English makes it much easier to follow this guide here.
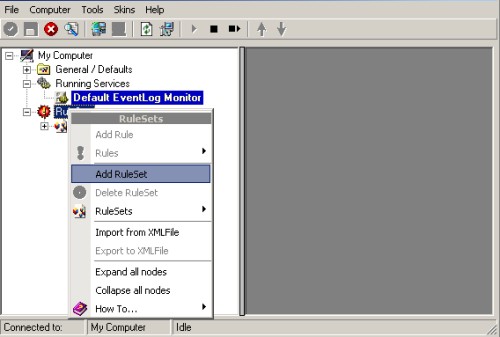
3. Then define a new rule set, right click “RuleSets”. A pop up menu appears. Select “Add RuleSet” from this menu as shown below:
4. Then, a wizard starts. Change the name of the rule to whatever name you like. We will use “Forward Syslog” in this example. The screen looks as follows:
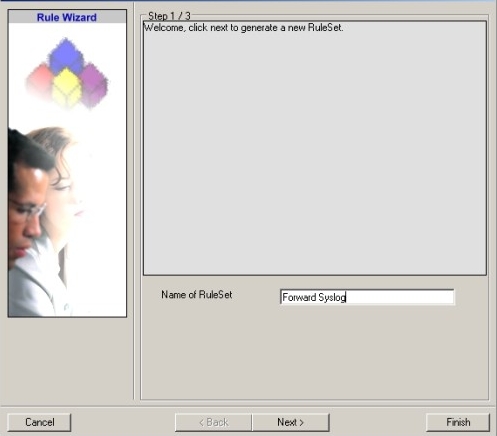
Click “Next”. A new wizard page appears.
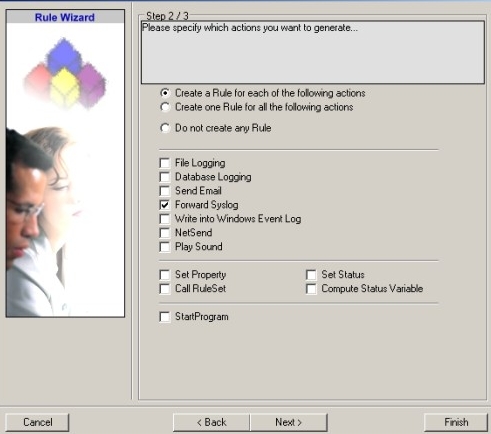
5. Select only Forward by Syslog. Do not select any other options for this example. Also, leave the “Create a Rule for each of the following actions” setting selected. Click “Next”. You will see a confirmation page. Click “Finish” to create the rule set.
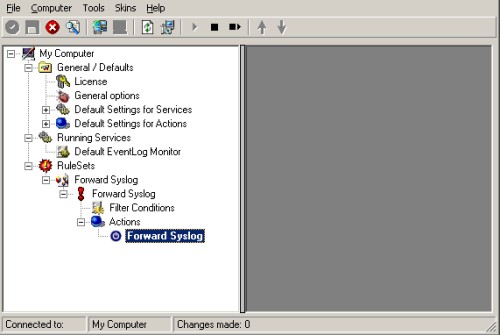
6. As you can see, the new Rule Set “Forward Syslog” is present. Please expand it in the tree view until the action level of the “Forward Syslog” Rule and select the “Forward by Syslog” action to configure.
7. Replace the message format from the original syslogformat to MoniLog format. To do so, click on “Insert” and then “Replace with MoniLog Format”. Also, please uncheck “Add Syslog Source when forwarding to other Syslog servers” Option and type the IP address or host name of our central hub server in the “Syslog Server” field:
8. Make sure you press the “Save” button – otherwise your changes will not be applied.
Step 6 – Create an EventLog Monitor to get all the Events from the Machine (EventReporter)
1. First, please rightclick on “Running Services” node in the left treeview (TOC). Select “Add Service” and then “Event Log Monitor” in the opened popup menu:
2. A wizard should open up, which looks like the screenshot below. Here type the name of the “Event Log Monitor” (In our case we will name it “My EventLog Monitor”). Then click on “Finish”:
3. Now the properties tab of the newly created “EventLog Monitor” will open up. Please leave it at default settings and still change the “Rule Set to use” to our above created “Forward Syslog” RuleSet. Please do not forget to save the changes.
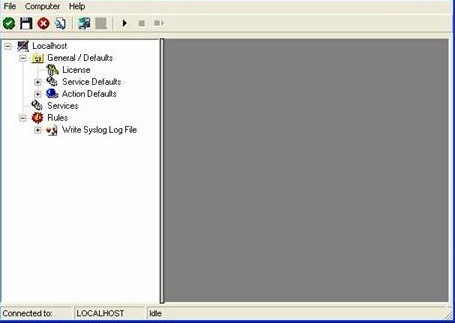
Step 7 – Create a simple Syslog server on WinSyslog
Please note that delete the previous services or rules sets to follow or save those to registry file not binary for later use. To save your settings follow the link and just dont zip & send that file to us.
The Syslog server will operate as a standard Syslog server on the default port of 514/UDP. All incoming data will be written to a single text file.
Step 8 – Defining a Rule Set for File Logging
The rule set specifies what action to carry out. You might be tempted to define the service first, but starting with the rule set makes things easier as it will be already present when the service is defined later and needs to be bound to a rule set.
To define a new rule set, right click “Rules”. A pop up menu will appear. Select “Add Rule Set” from this menu. On screen, it looks as follows:
Then,a wizard starts. Change the name of the rule set to whatever name you like. We will use “Write Syslog Log File” in this example. The screen looks as follows:
Click”Next”. A new wizard page appears:
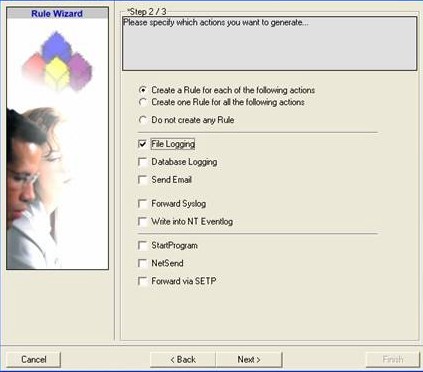
There,select file logging. Do not select any other options for this example. Also, leave the “Create a Rule for each of the following actions” setting selected. Click “Next”.
This is just a confirmation page. Click “Finish” to create the rule set.
The wizard closes and the client shows a newly created rule set.
As you can see, the “Write Syslog Log File” rule set is now present. Please expand it in the tree view until you have the following screen contents:
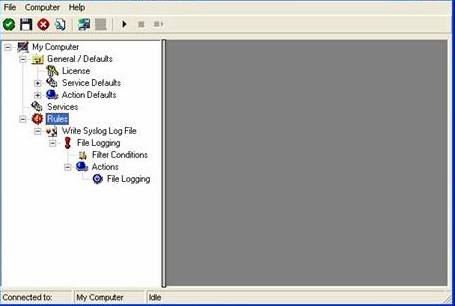
As you can see, we have a “File Logging” action configured. We will review the settings just for your information. Click on “Filter Conditions”:
As you can see, none of the filter conditions are enabled. This means that all information units (incoming messages) will be matched by these filter conditions. As such, the rules for the “File Logging” action will always be carried out.
Please note that this also means that all Syslog priorities and facilities will be written to the same file.
Now let us check the “File Logging” action itself. Please select it in the tree view:
Please enter a “File Base Name”. In our case we will name it “EventReporter”, cause all the Data comes from EventReporter’s. Its also important to make sure that the directory you specify exists! If it does not yet exist, please create it before you start the service. If the directory does not exist, the service is not able to store any files, last but not the least, do not forget to save the changes you do.
Note:Do NOT change anything else in the “WriteToFile-Action Configuration”!
Now you have a workable rule set for logging incoming messages to a text file.
Step 9 – Create a Syslog Server Service
Now we need to define a Syslog server service. A Syslog server is also sometimes called a “Syslog daemon”, “Syslogd” or “Syslog listener”. It is the process that receives incoming messages.
To define it, right click on “Services”, then select “Add Service” and the “Syslog Server”:
Once you have done so, a new wizard starts:
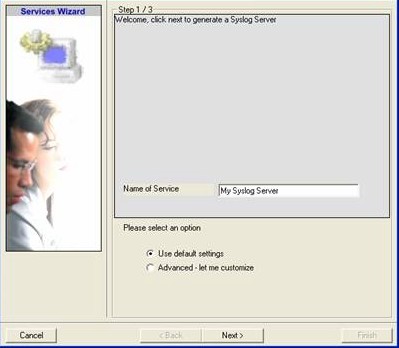
Again, you can use either the default name or any one you like. We will use “My Syslog Server” in this example. Leave the “Use default settings” selected and press “Next”:
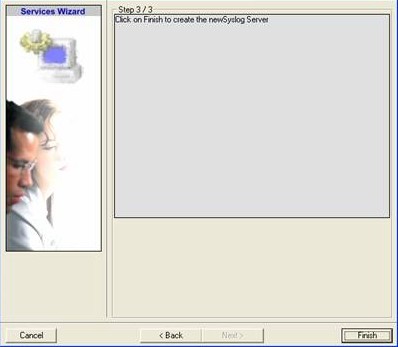
As we have used the default, the wizard will immediately proceed with step 3, the confirmation page. Press “Finish” to create the service. The wizard completes and returns to the configuration client. There, you will see the newly created service beneath the “Services” part of the tree view:
To check its parameters, select it:
As you can see, the service has been created with the default parameters. As such, it operates as a RFC compliant standard Syslog server.
Please note that the “Write Syslog Log File” has been automatically assigned as the rule set to use. This is the case because we already created it and it is the only rule set. By default, the wizard will always assign the first rule set visible in the tree view to new services. If another one is to be used, you need to change it to the correct one here in the service definition.
Also, note that the wizard uses the default properties from the “Service Defaults”. Obviously, if these are changed, the default properties for new services will differ.
This procedure completes the configuration of the Syslog server. Please do not forget to click save button and changes will start working after application restarts.
Monilog for Reporting
To deliver MoniLog reports, you need a local web server (for example Microsoft’s IIS or Apache) and a mail server capable of talking SMTP (most modern servers support this). Please make sure you log on with a sufficiently privileged user account.
Preparing Web Server for MoniLog
MoniLog publishes its reports through the local web server (central hub server).
To avoid confusion, we recommend creating a separate directory on the web server for MoniLog. Let us assume you use Microsoft Internet Information Server and run it in the default configuration. Then, you web pages are stored in the c:inetpubwwwroot directory. Create a subdirectory “monilog” directly beneath this directory.
Configuring Monilog
When setup has finished, start MoniLog, select your language (I have used English for this tutorial) and perform the following steps:
1. First, switch to the “General” tab.
2. “Logs Location” expects the DSN or Location where logs are dumped. You specify the location for your log file. Here we specify location of log file.
3. Select your “Select Syslog server type”.
4. Change the “Log prefix/Log name label” to the prefix you defined in your “WriteToFile” action in WinSyslog. In our case we named it “EventReporter”.
5. Next is to check the “Process Non-Windows Syslog messages” box. Leave all other options by default. Now it should look as follow:
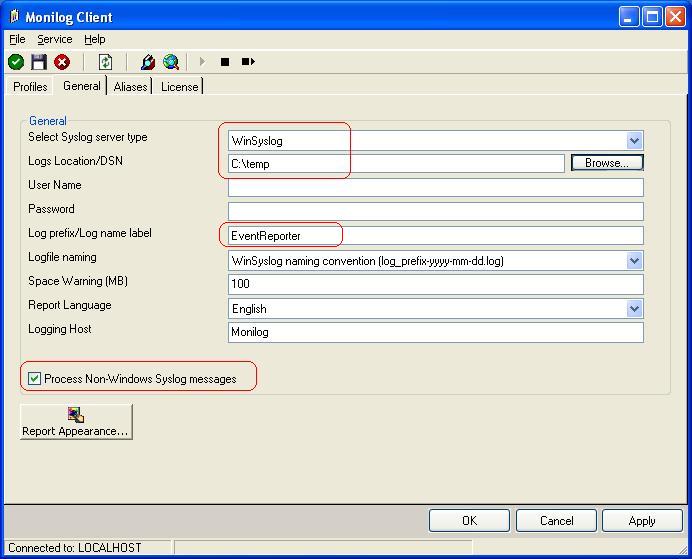
Figure 1: General Tab Settings Form – For Log Files
Click “Apply” after making your changes!
5. This has already enabled MoniLog reporting. Now, we can verify the installation. To do so, switch back to the “Profiles” tab. Click the “New Profile” button and enter a name. In this example I use the name “Profile 1”.
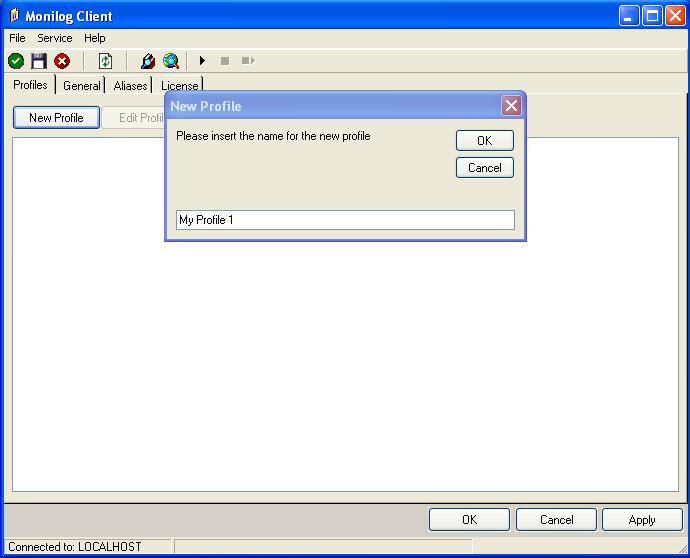
Figure 2: Creating New Profile
Click “OK” button to create a new profile.
6. Under “Reports Location”, enter the directory where MoniLog reports should be stored. In our sample, we use “c:inetpubwwwroot”. Leave all other settings as default. The tab should look like this one:
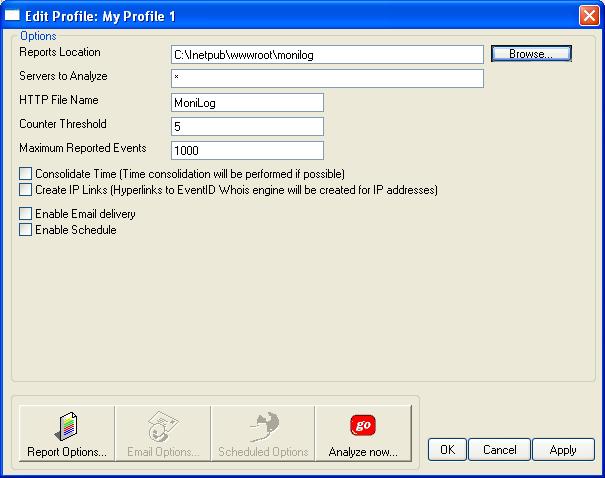
Figure 3: Configuring Reports Location
Click “Apply” to save your changes!
7. Next step is to set your report options. To do so, click “Report Options”. A new window opens. Check Success Audit and Information. Now it should looks like this one:
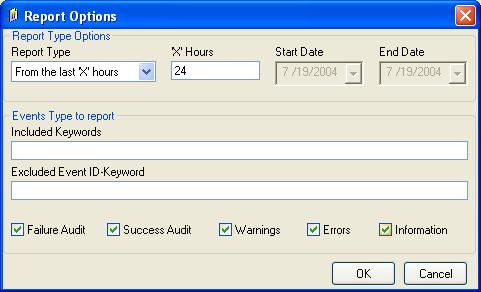
Figure 4: Report Options Form
Click on “OK” to close the windows by using default options.
8. Click “Analyze now” to test it. After a short while, a browser window with a MoniLog report will appear. The actual content of this report varies greatly. It depends on which events have been forwarded while setting up the agents. Probably, your report will be empty. This simply indicates that there was not yet any data to be analyzed. Immediately after setup, this is OK. If you don’t receive any data after some hours then of course there is something wrong. If that is the case, check the steps done before. A typical report looks like follows:
Figure 5: A typical Monilog report
9. Now we have verified the system is working. Next, we can schedule the automatic report. To do so, we need to check “Enable Schedule” and also “Enable Email delivery”. A quick reminder: we would like to receive a pointer to the report via email each working day. We first need to set the web directory the reports are to be stored to and enable email delivery. It is all done in the following screenshot:
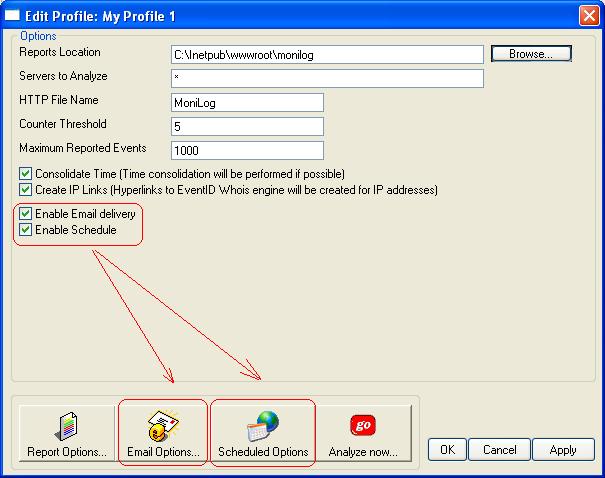
Figure 6: Enabling Email delivery and report scheduling options
The “Email Options” and “Scheduled Options” become colored and are now available.
10. Now we need to configure the email options. Click “Email Options…”. We assume the web server (192.168.0.1) is also acting as a mail server. The emails should be sent to “admins@sample.adiscon.com”. With that, the dialog looks like follows:
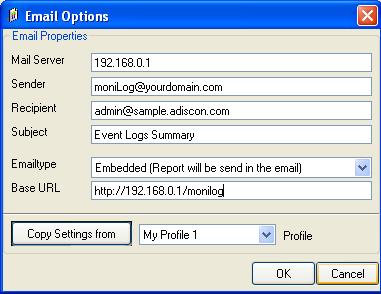
Figure 7: Configuring Email notification settings
Important: make sure the values match your configuration! This is vitally important because otherwise MoniLog is incapable of sending email correctly. Click “OK” to apply the new settings.
11. Next, click the “Report Options…” button. As we schedule reports only on working days, we need to tell MoniLog that it should include all those events occurred since its last run into the reports. We cannot leave the default of 24 hours, as this would exclude the weekend’s events. So change the “Report Type” option to “From last run till now” as seen below.
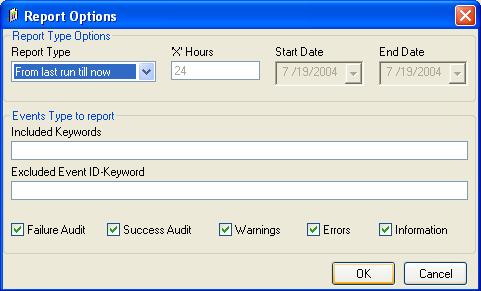
Figure 8: Setting Report Options form
Click “OK” to apply the setting.
12. Lastly, click on “Schedule Options” to set a schedule. As long as no schedule is set, no reports will be generated automatically. In our sample, we let MoniLog generate reports each working day at 8:00 in the morning. Weekends are not enabled. The dialog looks like this:
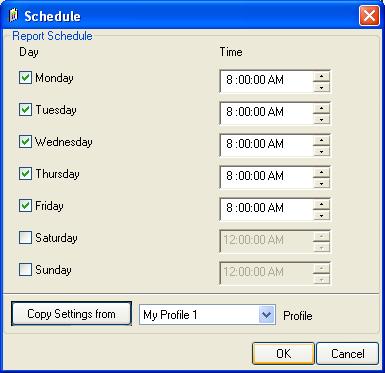
Figure 9: Configuring report generation schedule
13. Click on “OK” to apply the settings.The MoniLog service has not yet been started. It generates the scheduled reports (so you don’t need to run the client in foreground).
14. To conclude your configuration of MoniLog, start the service. To do so, select “Service”, then “Start Service” from the menu. This will start the service. During setup, the service is set to start automatically with system startup. So there is no need to manually restart the service after a reboot.
MoniLog is now completely configured. You will not immediately receive reports, because they will only be generated at 8 am each working day. So you need to wait for the next morning. If you would like to change the schedule to have an immediate feedback, please go to “Schedule” and change the time to be a few minutes in the future. Then click “OK” and restart the service. This can be done via the “Service” menu. A restart is necessary because the service reads changed parameters at startup, only.
Please Note: The only difference between configuring your reports to be generated either from Log Files or on underlying database is Step 2. From Step 3 onwards settings are the same.
You are done!
Well, this is all you need to do to configure the basic operations. Once you are comfortable with the basic setup, you can enhance the system with local pre-filtering of event, enhanced logging and alerting (with EventReporter and WinSyslog ) and changing report options (with MoniLog / MonitorWare Console).
What is recommended setting for MoniLog and Why?
Let’s quote Rainer Gerhards, design lead for the overall MonitorWare line of products, here:
Typically, MoniLog should work with Log Files, and not with the database. As using files is the recommended way with MoniLog. Why is it recommended? Because it is much faster! Why do we support database, too? Because this allows easier integration e.g. with the Web Interface! Would I recommend MoniLog and database if a customer also needs to run the Web Interface? In most cases: No! From a performance point of view its better to create both text files and database content.
Introduction
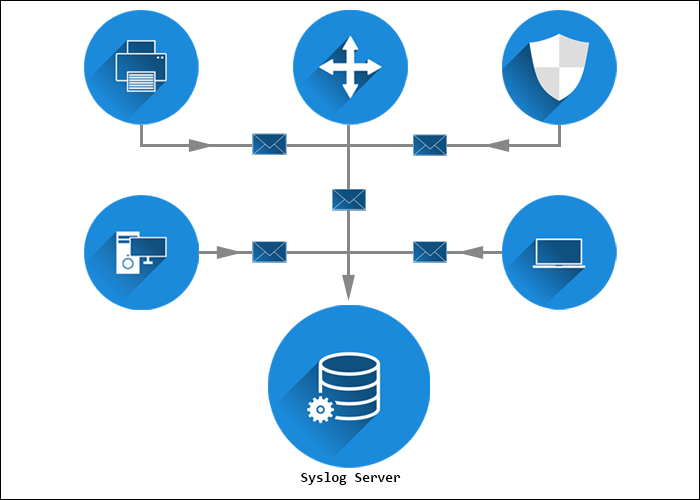
The syslog (system logging) protocol is used for monitoring network devices and sending log messages to a logging server (a syslog server).
The syslog server and syslog protocol work together to facilitate log tracking and management.
In this article, you will learn what a syslog server is, what it is used for, and see the best syslog servers available for Linux and Windows.
What Is a Syslog Server?
A syslog server collects syslog messages from all devices in a single location, whether it is a bare metal server, a virtual machine, or a software service. The syslog server usually consists of a syslog listener, which receives and interprets the incoming data, and a database for storing the data.
The server collects, filters, and displays the collected messages from all devices and operating systems. A syslog server can usually store the logs for a long time.
Advanced syslog servers provide automated notifications and tailored responses to detected issues — i.e., to run a script, filter and forward a message, create and deliver a report, etc.
With all the benefits and features of a syslog server, it is easy to optimize device performance and health after analyzing server data.
What Is a Syslog Server Used For?
A syslog server’s primary purpose is to collect log messages from the connected network devices and store them in a centralized location for monitoring purposes. The server keeps the logs in a consistent format, allowing users to spot performance irregularities easily.
Use a syslog server to improve network monitoring and management by inspecting network specifics and parameters. Automate actions by setting up automatic alerts about a variation in a device’s data log. Some syslog servers come with a message severity level indicator.
The benefits of using a syslog server and logging data are:
- Reduced number of alerts.
- Reduced downtime.
- Fewer business interruptions.
- Preventive troubleshooting.
Finally, syslog servers can store event logs for a long time, enabling access to historical events. Various syslog servers rotate logs and create new files periodically, thus keeping the data organized.
This section lists the most popular and feature-rich Linux and Windows syslog servers. For a comparison of supported platforms and free trial availability, refer to the table below:
| Syslog Server | Supported Platforms | Free Trial |
|---|---|---|
| Kiwi | Unix, Linux, Windows | 14 days |
| PRTG | Windows | 30 days |
| Syslog Watcher | Unix, Linux, Windows | Per request |
| The Dude | Linux, macOS, Windows | / |
| Visual Syslog Server | Unix, Linux | / |
| Datagram | Windows | Unlimited trial version |
| ManageEngine EventLog Analyzer | Linux, Windows | / |
| Icinga | Unix, Linux | / |
| GrayLog | Linux | / |
| WinSyslog | Windows | / |
| Nagios | Linux, Windows | 30 days |
| Splunkbase | Unix, Linux, Windows | 14 days |
| Progress WhatsUp Gold | Windows | 14 days |
| Logstash | Unix, Linux, Windows | 14 days |
| Loggly | Cloud-based | 30 days |
| Site24x7 | Cloud-based | 30 days |
Free Syslog Servers
The following section lists the best free syslog servers:
1. Kiwi Syslog Server
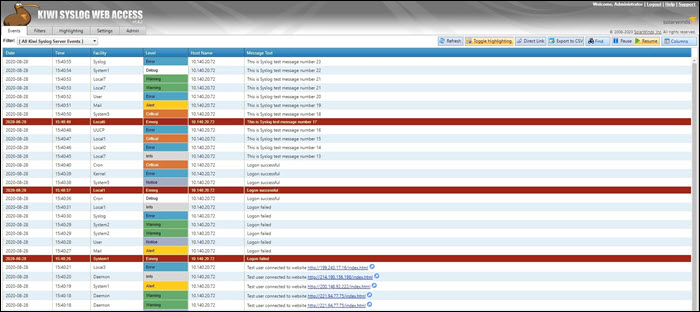
The Kiwi syslog server was created by SolarWinds. It is a comprehensive logging utility that collects syslog events and messages on Unix, Linux, and Windows and generates reports in plain text or HTML.
Kiwi’s GUI allows users to easily and efficiently manage logs in a single place. The tool can create network traffic graphics and, optionally, send daily summary emails.
The free edition collects syslog messages from up to five devices and provides an option to set up alerts for various events, including heavy traffic, login attempts, hardware failures, etc. Additionally, Kiwi offers the possibility of archiving syslog messages or forwarding them to a database. The free version comes with a trial of full functionalities lasting 14 days.
The full version costs $329 and offers automation, allowing you to set up actions that are automatically triggered by specific events and a web-based interface for remote management.
2. PRTG Syslog Server
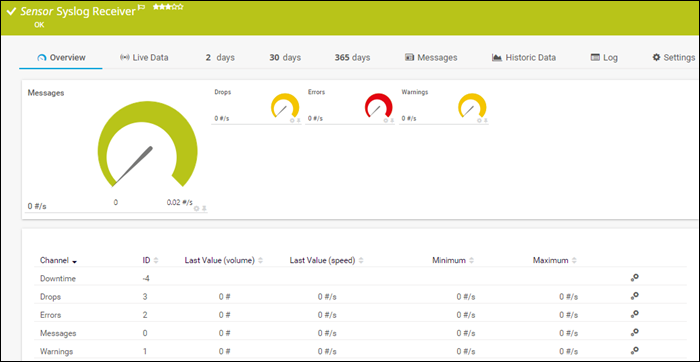
The PRTG syslog server is part of the PRTG Network Monitor application, and it is completely free for up to 100 sensors. The free trial allows users to use more sensors for 30 days but later reverts to the free version. The Syslog Receiver sensor for monitoring and analyzing network traffic doesn’t require additional software installations.
PRTG can receive and process up to 10,000 syslog messages per second from network devices and Windows environments. The number depends on the processing power, storage, and overall system configuration.
PRTG offers an intuitive web interface for viewing, analyzing, and filtering syslog messages by type, severity, etc. It also provides message categorization and further filtering to ensure only relevant messages are displayed.
The server offers automation by sending alerts triggered by errors, warnings, or a high number of messages.
3. Syslog Watcher
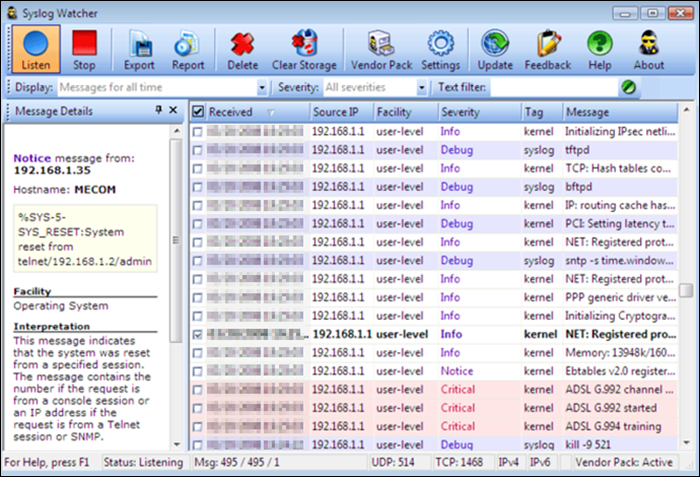
The SNMPSoft Syslog Watcher is a dedicated syslog server compatible with various devices and software that support syslog sending. The tool collects system log events from Unix, Windows or Linux servers.
The free version allows syslog message collection from five sources, while the professional version supports an unlimited number of sources. Depending on the configuration, Syslog Watcher can handle up to 5,000 syslog messages per second.
Syslog Watcher can collect messages over UDP and TCP and supports IPv4 and IPv6 networks. The utility also enables automation by sending email alerts for specific errors, events, or messages.
Message filtering, storing, and customization depend on filters, the message severity level, and the rules set by the user. Syslog Watcher also offers exporting messages to a database, manually or automatically.
4. The Dude
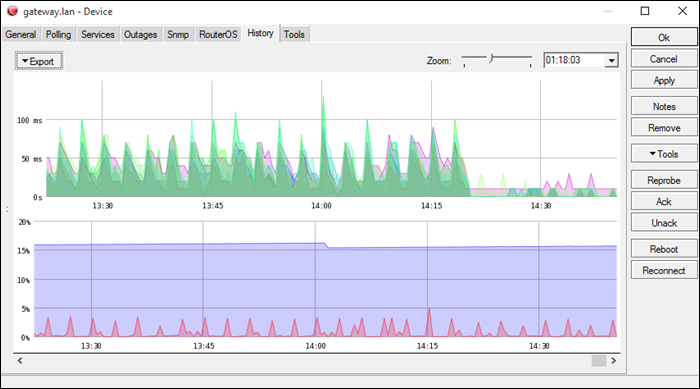
The Dude is a network management application developed by MicroTik, with a free built-in syslog server. The application offers general network management, while the syslog server captures syslog messages from your devices.
The Dude supports remote logging via RouterOS. It is compatible with Windows-based systems, while on Linux or macOS, it runs using Wine/Darwine.
The server automates maintenance by allowing users to create alerts for specific syslog events or messages and filters.
It includes an auto-discovery feature, automatically mapping nearby devices on the network, which facilitates network building.
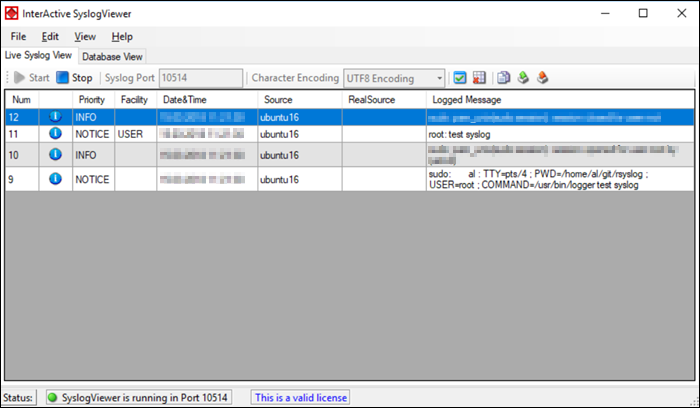
5. Visual Syslog Server
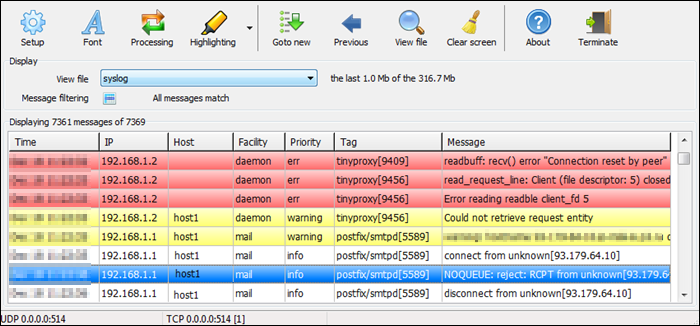
Visual Syslog Server is a free and lightweight Windows-based syslog server that monitors incoming data in real-time. It accepts messages via UDP and TCP and stores them on a disk. Previous syslog messages remain on the disk for future analysis as long as the user specifies.
Message filters include filtering based on the host, source address, priority, facility, or message content. Filtering makes it easy to find an issue when dealing with a large data volume.
Users can also configure thresholds for triggering the execution of scripts, programs, or email notifications. Thus, the tool automates problem-solving and reduces response time for pressing issues.
6. Datagram
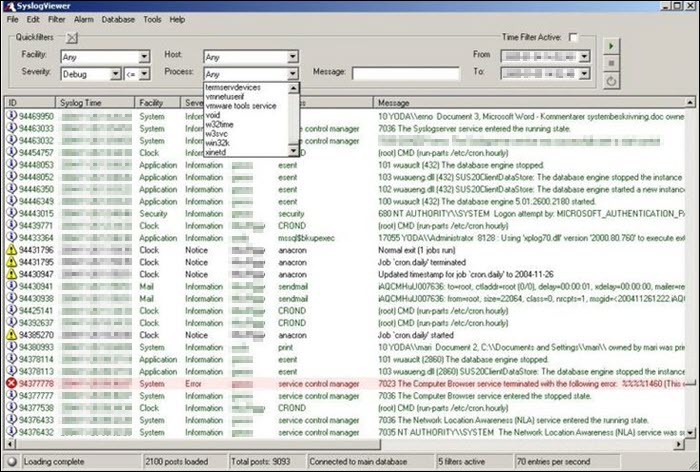
The Datagram Syslog Server is part of the Datagram SyslogServer Suite. Its Datagram SyslogAgent is installed as a service on Windows clients and servers, supporting Windows 2000 or newer systems.
The program provides enterprise-level functionality, capable of log collection, message filtering, alerts, database storage, and log viewing.
The GUI is intuitive and offers a live network view. The filters include the hostname, process, facility, issue severity, message, or even custom SQL queries.
The trial version is free, supports eight logging IP addresses, but supports the Microsoft Access database only. Entries cannot be backed up or deleted, and there are no email notifications. Users can create ten filters and set up to ten alarms.
On the other hand, the enterprise version costs $200 for 50 IP addresses, $500 for 500, and $900 for 5000 IP addresses. The enterprise version allows users to back up or delete entries, supports MSSQL databases, and sets no limit on creating filters or alarms. It also supports email notifications.
7. ManageEngine EventLog Analyzer

The ManageEngine EventLog Analyzer is a tool that allows the monitoring of up to five devices for free. It is compatible with Windows and Linux, while monitoring works for various devices running any operating system.
The EventLog Analyzer provides a GUI with a real-time log view and comparison, allowing for quick detection of suspicious messages and possible security threats. The functional dashboard enables users to create custom rules for alerts and notifications about security issues. There are also predefined rules for security event logs.
The auto-discovery feature finds devices on the network and facilitates log collection. Each message is labeled, making it clear which device it came from.
Compression and encryption of archived logs restrict data access to users without administrator privileges.
8. Icinga
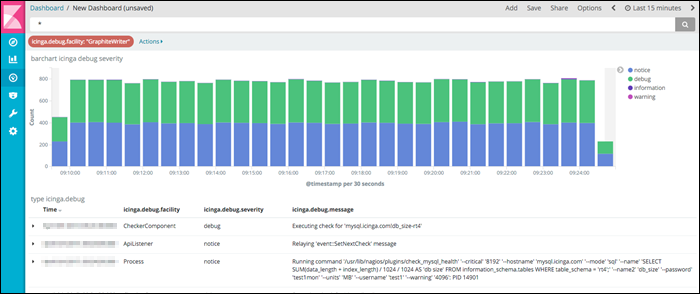
Icinga is an open-source tool that monitors and reports on device health. This syslog server accepts various modifications that enable it to fit any organization’s network monitoring needs.
The syslog tool collects, stores, and organizes data in a time-series database, showing earlier and current syslog data. It instantly notifies the user about any suspicious data, which helps prevent downtime and allows monitoring based on events.
Icinga’s web interface provides charts and graphs depicting device health and optimizing troubleshooting and debugging. Its integration with other devices facilitates real-time data collection, storage, and visualization of log metrics.
9. GrayLog
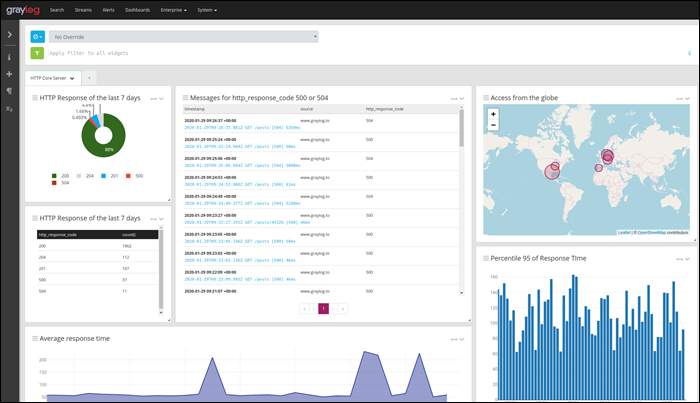
GrayLog is an open-source syslog server for Linux. The tool is free for 5 GB of data per day, making it an excellent choice for small networks, but it isn’t suitable for large organizations.
The server includes a query and search function with lots of filters that enable users to find a specific record quickly. The program interface consists of a fully customizable web GUI with graphs, charts, and changeable basic components for creating a custom day-to-day monitoring environment.
The server has prominent security features with automatic email notifications about failed logins, device faults, or security threats. With in-built automatic IP blocking, GrayLog can prevent an attack as soon as it recognizes one.
The app also offers fault tolerance features, audit logs, and role-based access control, further increasing security.
10. Windows Syslog Server
WinSyslog is a syslog server designed for Microsoft Windows. It supports syslog monitoring via UDP or TCP and it is free for displaying 60 messages at a time, with free troubleshooting support. Paid versions unlock additional features, provide greater security and unlimited device support.
WinSyslog is reliable, highly scalable, and collects syslog messages from any device compatible with the syslog protocol. It maintains device health using the Active Status Monitor feature, which pings the selected device and warns the admin if there is no response.
The server creates a daily log containing the received syslog messages, with customizable size and storage options. Store the file in a database or write it to the event log of Windows NT, 2000, or XP systems.
The program also features an automatic email notification in case of a security issue.
Paid Syslog Servers
The following is a list of the best paid syslog servers:
1. Nagios Log Server
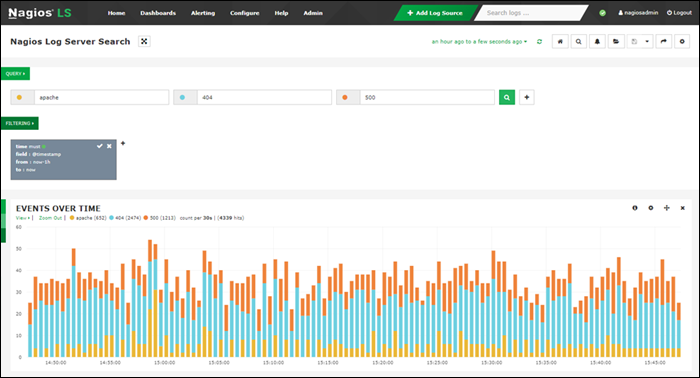
Nagios is a scalable syslog server that helps monitor systems, networks, and infrastructure. While it does offer a free plan, it is only 500 MB/day, making it unsuitable for medium and large businesses.
Other pricing plans are:
- Single Instance. For $1,995, it covers only one installation, which excludes failover. With this purchase, the data plan is unlimited.
- Two Instances. Costing $4,995, it covers two separate installations, which allow for redundant data with automatic failover.
- Four Instances. Costing $6,995, it allows four separate installations, further increasing redundancy and speeds.
- Ten Instances. At $14,995, it allows for ten installations with maximum redundancy and query speeds.
The server can receive logs from a wide variety of operating systems and devices, including Windows, Linux, mail servers, Web and application servers, SQL servers, etc. It is customizable, with configurable thresholds, email notifications, script execution, or alert forwarding.
The dashboard provides an overview of all logs over time, with customizable filters that include the timestamp, ID, host, message, severity, program, etc. The tool generates reports which are also customizable and that automatically update in real-time.
2. Splunkbase
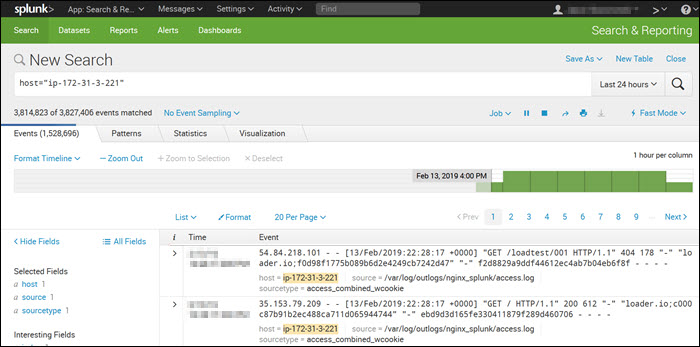
Splunk is a syslog server used for monitoring, querying, analyzing, and visualizing log data in real-time. It is a paid tool with a 60-day free trial that includes syslog features. The server is compatible with Linux and macOS.
Splunk costs $1,150 per GB of data for a yearly 15 GB license, including maintenance.
Splunk features an intuitive and user-friendly UI with real-time statistics and a customizable dashboard.
It includes powerful search functionalities and filters that narrow every search down to the messages the user needs, such as error messages or device-specific messages. Splunk allows users to perform Boolean, quoted string, and wildcard searches in real-time, time range, or transaction level.
3. Progress WhatsUp Gold Log Management
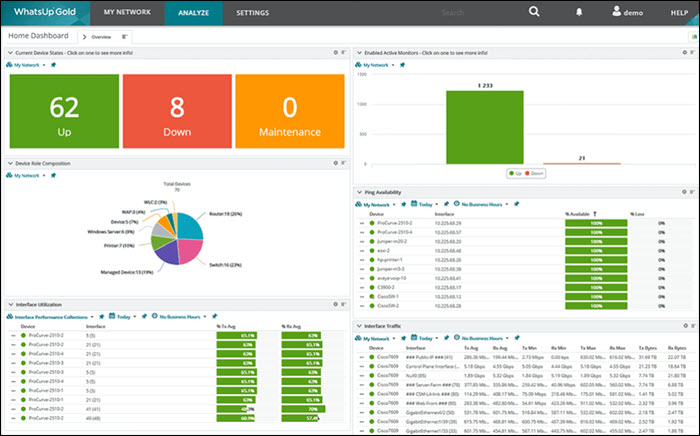
Progress WhatsUp Gold (formerly IPSwitch) is a paid syslog server that comes with a free 14-day trial. The syslog management tool is an add-on to the WhatsUp Gold monitoring tool for Windows Server, and it also receives Windows Events messages.
The price plans differ for a subscription and a perpetual license. For example, the pricing plans for a 1-year license include:
- 5 Servers — $1,325
- 10 Servers — $2,300
- 25 Servers — $5,250
The logging tool receives the log and Windows event messages and files them together. If there are sudden out-of-band increases or decreases, the tool creates an alert and notifies the user.
The customizable drag & drop dashboard shows messages in real-time as they arrive. Color-coded icons and graphs improve the visibility of each message’s severity, allowing the team to react immediately.
WhatsUp’s interactive interface shows each device’s availability and performance, both on-premise and in the cloud.
4. Logstash
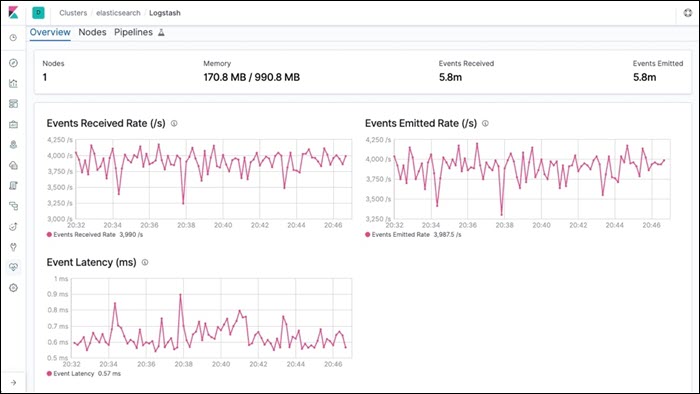
Logstash is part of a software suite called ELK stack that collects log messages. One part of the stack, Elasticsearch, sorts and filters the messages for analysis, while Kibana processes and displays the data. All technologies in the ELK stack are Linux-based, but work on macOS as well.
Logstash comes in four pricing plans:
- Standard. For $16 per month.
- Gold. Costs $19 per month.
- Platinum. Costs $22 per month.
- Enterprise. Contact the sales team for a quote.
Logstash listens on the network for messages coming from a wide variety of devices, but also supports collecting data from cloud services and applications. It collects logs via TCP or UDP, and it also supports TLS-encrypted messages.
Logstash can read messages from a file or database, get messages from mail servers, IRC or RSS feeds, and pick up SNMP messages. The filters allow users to find specific messages and quickly resolve any issues.
The front-end part of the ELK stack, Kibana, works well for any syslog server.
5. Loggly
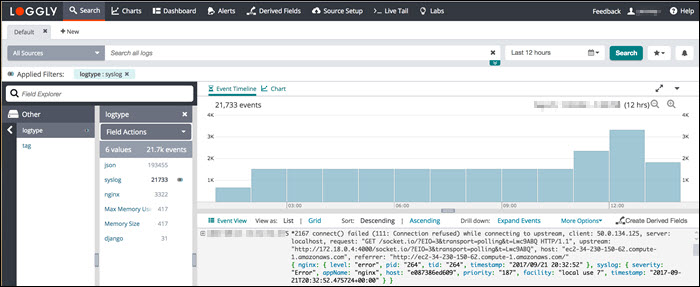
Loggly is a cloud-based syslog consolidator and analyzer. It doesn’t require software installations on-premises but requires setting up automated file transfer procedures that upload the logs to the Loggly server.
The utility comes in four pricing plans:
- Lite. Free, includes 200 MB/day, and retains data for seven days.
- Standard. Starting at $79/month, it limits data to 1 GB/day and retains data for 15 days.
- Pro. Starting at $159/month, data volume is up to 100GB/day, and retains data for up to 30 days.
- Enterprise. With a starting price of $279/month, it includes a custom data volume and retains the log data for up to 90 days.
Loggly standardizes and stores syslog messages from many sources, allowing users to access the data uniformly. Once the data is stored, it is accessible via the log analysis tools in the online service.
Loggly includes storage space with the software purchase, but since it stores data remotely and offsite, it is good to back up the log files on another site to improve system security. Data retention depends on the purchased package.
6. Site24x7 Server Monitoring
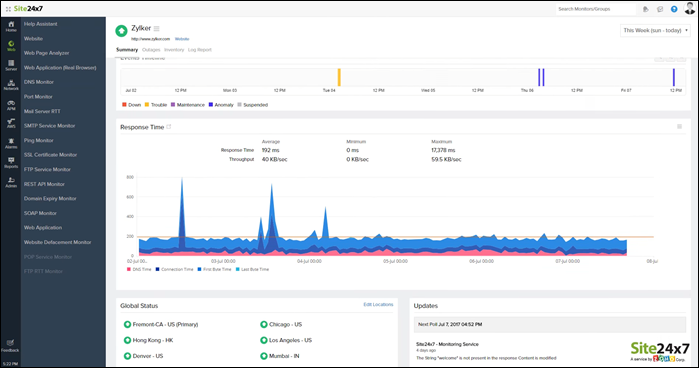
Site24x7 is a cloud-based monitoring and management software suite that includes the Log Manager. The Site 24×7 Infrastructure utilities offer a 30-day free trial. A monthly subscription comes with a 500 MB log processing allowance costing $9 with the following possible upgrades:
- 10 GB. Costs $10 per month.
- 100 GB. Costs $95 per month.
- 1 TB. Costs $900 per month.
Although the system is cloud-based, a Site24x7 agent must be installed on the monitored system for the Log Manager to work. The agent is compatible with Linux and Windows server.
When receiving syslog messages, the server standardizes them and files the messages in the same format. Message standardization allows users to analyze messages from different sources together.
The dashboard includes many data analysis options within the log file viewer tool, including log querying, sorting, filtering, and grouping messages.
How to Choose a Syslog Server?
There are several factors to consider when choosing a syslog server:
- Business Size. A paid syslog server is probably a better choice for a large enterprise due to the data volume and device number restrictions of free servers. On the other hand, a free syslog tool can provide the necessary functionalities for small businesses with low device numbers and a small data volume.
- Support. If your organization doesn’t have skilled IT staff or if you need help setting up the software, a paid tool usually includes support and troubleshooting assistance. Some free utilities also have basic documentation, but don’t offer round-the-clock support and troubleshooting.
- Storage. A better choice for businesses with their own storage capacities are syslog servers sold as a software suite, which are installed on-premises. An on-premises option improves security and lowers the chance of a data breach. On the other hand, some syslog tools are sold as a cloud-based syslog service, which is a good choice if you don’t have your own storage.
Conclusion
This article listed the 16 best syslog servers, their benefits, features, capabilities, and pricing. You should now be able to decide which syslog server is the most suitable for your organization.
Typically network devices store event messages on the device itself. However, you can configure it to send to a specific server. The server, henceforth, is called a Syslog server. The network sends all the event messages to the Syslog server specified where you can make certain rules for different types of messages. To be able to do this, we will be using the Kiwi Syslog Server tool from SolarWinds. SolarWinds has developed several software that can be used for managing systems, networks etc.
Installation of the Kiwi Syslog Server
To set up a syslog server, first, you will have to download the Kiwi Syslog Server tool from SolarWinds official site. The link to the tool can be found here or you can take a look at the best syslog servers here.. Once downloaded, run the installation file. During the installation, it will ask you to whether to install the utility as a service or as an application. You are going to want to install it as a service since it will allow the Kiwi Syslog to process messages even when the user is not logged in. The rest of the installation is straightforward and there’s nothing that needs explanation.
Setting up the Kiwi Syslog Server
Now, once you have installed the Kiwi Syslog Server on the system, you are going to need someone to walk you through the options available. Don’t worry, we are going to cover all the important features that are provided in the free edition of Kiwi Syslog Server. Follow the given instructions:
- Go to the Start Menu and open up the Kiwi Syslog Server.
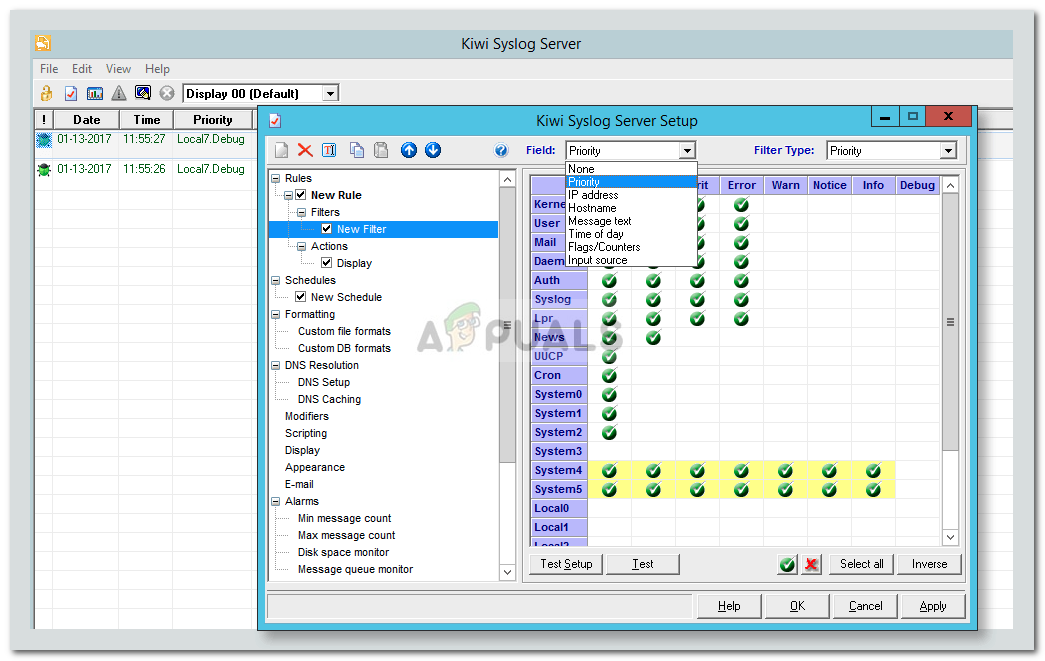
- Now, one of the first things you need to do when you install a syslog server is to set up filters and actions. Press Ctrl + P or simply click File > Setup to get the setup window.
- Basically, filters are used to decide what will happen when a message is received. With the tool, you can filter a message based upon priority, IP address range, the content of the message, the source of the message AKA hostname etc. You can set a filter by creating a new rule or in the rules created by Default. To create a new rule, right-click Rules and select Add rule. Then, highlight Filter, right-click and select Add filter.

Adding New Filter - You can rename the filter whatever you want, however, a name that suggests what the filter is for is recommended. You can set the filter type by choosing from the drop-down list in front of Field. As an example, we’ll select IP address.

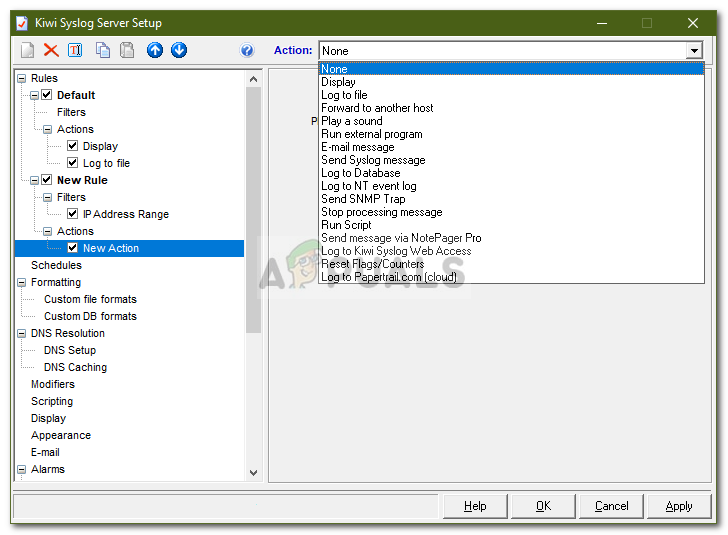
Choosing Filter Type - After that, you have Actions. Actions basically tell the server what to do when a specific Filter has been met. It can display the received messages, store them in a log file, play a sound etc. However, in the free edition, there are limitations to the actions that you can perform. To set an action, highlight Actions, right-click and select Add action.
- You can choose what it does by choosing from the drop-down menu in front of Action.
Choosing Action Type - There are tons of things that you can do with this utility. You can change how the messages are displaying by going to Display, set alarms when certain conditions are met etc.
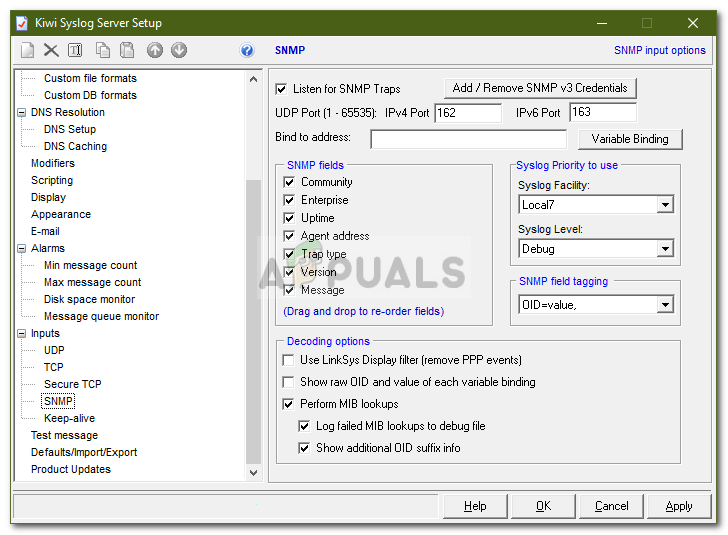
- With this utility, you can also receive traps. SNMP Traps are sort of similar to syslog in that they are real-time notifications that notify you when you have a network problem.
- You can make the utility listen for SNMP traps by going to SNMP under Inputs.
Listening to SNMP Traps - By default, the utility listens to all the messages sent to the server on the UDP port 514. You can also make it listen for TCP Syslog messages by enabling the feature.
Enabling Listen to TCP - Once done, all the messages sent to the server on the UDP port 514 or any other that you have configured will be displayed.
- If you want to save all the Rules, filters and actions that you have created, you can do so by going to Defaults/Import/Export. There, click on ‘Export Settings and Rules to INI file’.
Exporting Settings to INI File - Save the file anywhere you like.
- You can also reset all the Rules and settings by clicking ‘Load default Rules and Settings’.
Loading Default Settings


Kevin Arrows
Kevin is a dynamic and self-motivated information technology professional, with a Thorough knowledge of all facets pertaining to network infrastructure design, implementation and administration. Superior record of delivering simultaneous large-scale mission critical projects on time and under budget.
Back to top button
Syslog — это универсальный стандарт для системных сообщений.. Первоначально он был реализован утилитой Unix под названием Syslogd, но теперь он используется широким спектром ИТ-оборудования, поэтому почти каждый приобретенный вами компьютерный комплект сможет отправлять сообщения системного журнала. Вы можете направить эти сообщения в разные файлы журнала в соответствии с уровнем серьезности сообщения. Но если вы планируете максимально использовать информацию, эти данные действительно следует обработать или хотя бы прочитать.
Мы подробно расскажем о каждом инструменте, который мы выбрали для этого списка, но если вам просто нужна краткая сводка, вот список 16 лучших бесплатных серверов Syslog для Linux и Windows:
- Сервер Syslog для киви SolarWinds (СКАЧАТЬ БЕСПЛАТНО) — Платный инструмент, работающий в Windows, но бесплатный для мониторинга журналов с пяти устройств..
- Сетевой монитор Paessler PRTG (БЕСПЛАТНАЯ ПРОБНАЯ ВЕРСИЯ) — Комплексный монитор сети, сервера и приложений, который включает датчики для управления системным журналом. PRTG бесплатен, если вы активируете до 100 датчиков, чего более чем достаточно для доступа к мониторам системного журнала..
- Loggly (БЕСПЛАТНАЯ ПРОБНАЯ ВЕРСИЯ) — Облачный анализатор логов, который загружает все ваши данные логов на свои серверы. Эта услуга платная, но есть бесплатный пакет Lite.
- Анализатор журнала событий ManageEngine (БЕСПЛАТНАЯ ПРОБНАЯ ВЕРСИЯ) — Может быть установлен на Windows или Linux, работает как сервер Syslog и включает в себя очень интуитивно понятную и удобную панель инструментов.
- WhatsUp Syslog Server — Хранение, анализ и пересылка сообщений системного журнала, а также некоторые функции анализа — также из этого бесплатного инструмента для Windows.
- Syslog Watcher — Бесплатный сервер системного журнала для Windows, который записывает сообщения системного журнала в файлы или базу данных и включает функции сортировки и фильтрации записей..
- Fastvue Syslog — Бесплатный сервер системного журнала для Windows Server 2012 R2 и более поздних версий. Помимо записи сообщений в файлы журналов, он создает файлы проверки контрольной суммы, которые защищены шифрованием SHA-256..
- Чувак — Бесплатный инструмент сетевого анализа с интегрированным сервером Syslog для Windows, Linux и Mac OS..
- Nagios Log Server — Интегрирован в Nagios XI (платно) и Nagios Core (бесплатно) для Windows и Linux. Бесплатная версия ограничена пропускной способностью 500 МБ в день.
- Исинга 2 — Бесплатная система мониторинга сети для Linux с интегрированным сервером Syslog.
- Visual Syslog Server — Собирает сообщения системного журнала и сохраняет их в файл, а также отображает их на приборной панели. Программа бесплатна и работает на Windows и Windows Server.
- Syslog-NG — бесплатный сервер системного журнала для Linux, который также собирает события Windows по сети.
- NxLog — бесплатный сервер Syslog для Windows, Linux, Unix и Android.
- Logstash — Служба мониторинга системных сообщений для Linux, включающая хранение сообщений Syslog.
- Graylog — Система управления журналами для Linux, которую можно бесплатно использовать с объемами данных сообщений журнала до 5 ГБ в день.
- TFTPD32 — Легкий бесплатный системный регистратор сообщений для Windows, включающий мониторинг Syslog..
Contents
- 1 Syslog Серверы и Клиенты
- 2 Сообщения системного журнала
- 3 Номера портов системного журнала
- 4 Лучшие бесплатные серверы Syslog для Linux и Windows
- 4.1 1. Сервер Syslog для киви SolarWinds (СКАЧАТЬ БЕСПЛАТНО)
- 4.2 ВЫБОР РЕДАКТОРА
- 4.3 2. Сетевой монитор Paessler PRTG (БЕСПЛАТНАЯ ПРОБНАЯ ВЕРСИЯ)
- 4.4 3. Loggly (БЕСПЛАТНАЯ ПРОБНАЯ ВЕРСИЯ)
- 4.5 4. ManageEngine EventLog Analyzer (БЕСПЛАТНАЯ ПРОБНАЯ ВЕРСИЯ)
- 4.6 5. WhatsUp Syslog Server
- 4.7 6. Системный журнал Watcher
- 4.8 7. Системный журнал Fastvue
- 4.9 8. Чувак
- 4.10 9. Логос Nagios
- 4.11 10. Ицинга 2
- 4.12 11. Сервер визуальных системных журналов
- 4.13 12. Системный журнал-NG
- 4.14 13. Nxlog
- 4.15 14. Logstash
- 4.16 15. Graylog
- 4.17 16. TFTPD32 / 64
- 5 Серверы системного журнала по ОС
- 6 Выбор сервера системного журнала
Концепция «Сервер системного журналаДействительно относится к приложение, которое имеет дело с сообщениями системного журнала вместо предоставления выделенного компьютера для получения сообщений. Так что не заблуждайтесь этим словом «сервер» там.
Модель сервера / клиента также немного сложна в терминах системного журнала. Обычно клиент связывается с сервером, а сервер отвечает. В системном журнале, клиент системного журнала — это просто программа, которая передает сообщения об ошибках, предупреждениях и отладке. Клиент системного журнала не имеет прямого контакта с коллегой: он отправляет сообщения независимо от того, слушает ли их кто-нибудь или нет.. Syslogd — это демон. Это сборщик системного журнала, поэтому он считается сервером, даже если он никогда не отвечает отправителю сообщений. Демон может работать локально или может быть реализован как удаленный сервер системного журнала, подключаясь через Интернет..
Несмотря на то, что стандарт Syslog был кодифицирован специальной инженерной группой Internet, существует так много реализаций Syslog, что существует некоторая вариация в формате сообщения данных syslog. Со всеми различными типами сообщений вы могли бы извлечь выгоду из, вам нужно получить инструмент, чтобы разобраться во всех.
Определение стандарта Syslog свободно доступно для общественности, но его не рассматривают как «проект с открытым исходным кодом». Это связано с тем, что «открытый исходный код» относится к свободно доступному программному коду, а Syslog — это стандарт, а не программа. Однако существуют серверные реализации с открытым исходным кодом..
Сообщения системного журнала
Сообщения системного журнала можно рассматривать как эквивалент Linux / Unix журналов событий Windows. Таким образом, вы можете называть их «событиями системного журнала». Они предоставляют важную информацию и будут поддерживать ваши задачи системного администрирования посредством:
- Предупреждения об отказе оборудования — которые записываются в файл журнала
- Мониторинг исчерпания мощности — через предварительно установленные уровни предупреждений, которые вы устанавливаете сами
- Оповещения о неожиданных событиях — ненормальная активность может указывать на скомпрометированные учетные записи пользователей
- Обнаружение вторжения в сеть — обнаружение несанкционированных устройств и доступ к неожиданным местам в Интернете
Записи в ваших файлах системного журнала записаны там, потому что производители вашего программного обеспечения и устройств посчитали определенные события значимыми, поэтому было бы ошибкой игнорировать этот богатый источник системной активности и информации о состоянии. Поэтому скачайте сборщик Syslog и активируйте его.
Номера портов системного журнала
Системный журнал работает через UDP, поэтому ожидать активности на UDP-порту 514 ваших сетевых устройств. Это вызвано всеми этими сообщениями о событиях системного журнала, циркулирующими по вашей сети. UDP-порт 514 используется клиентами Syslog для отправки сообщений, а также серверами Syslog для прослушивания сообщений. Следовательно, это и порты источника и назначения на всех стандартных коммуникациях Syslog. Не закрывайте это. С подозрением на активность на TCP-порту 514. Известно, что этот порт используется червем ADM и не используется для системного журнала..
Есть безопасные реализации Syslog. Поскольку защищенным службам необходимо установить соединение, вы не можете использовать для них порт UDP.. Безопасная версия Syslog известна как Syslog поверх TLS и использует TCP-порт 6514.. Если вы хотите управлять удаленным сервером Syslog, подключенным к сети через Интернет, вам нужно пройти маршрут Syslog по TLS, поскольку незашифрованные события Syslog, отправляемые через Интернет, могут серьезно подорвать безопасность вашей сети..
Лучшие бесплатные серверы Syslog для Linux и Windows
Если у вас нет бюджета на инструменты или вы не думаете, что стоит потратить деньги только на просмотр сообщений журнала, ознакомьтесь с нашим списком бесплатных серверов системного журнала. Большинство обзорных сайтов предоставят вам список из пяти или 10 лучших серверов системного журнала, но мы прошли лишнюю милю и нашли 16 отличных серверов системного журнала, которые можно бесплатно использовать.
1. Сервер Syslog для киви SolarWinds (СКАЧАТЬ БЕСПЛАТНО)
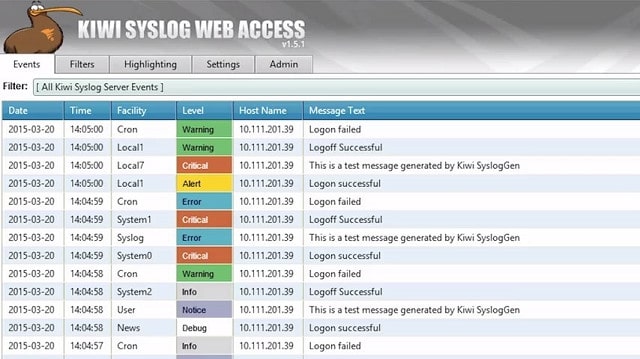
Kiwi — это утилита для системного журнала от SolarWinds. Пакет стоит $ 295, но есть бесплатная версия. Вы можете бесплатно использовать систему для мониторинга сообщений системного журнала с пяти устройств. Бесплатный пакет подойдет только для небольших сетей.
Простой протокол управления сетью основан на методологии системного журнала, поэтому Киви также может собирать сообщения SNMP. Аварийное сообщение от устройства называется «SNMP Trap». Trap — исключение из обычных процедур SNMP, когда агенты устройств отвечают статусами только при запросе программой менеджера. Таким образом, ловушки предназначены для обозначения условий высокого риска. Инструмент будет записывать сообщения в файл журнала, а также отображать их на панели инструментов программы. Kiwi будет собирать сообщения системного журнала от многих типов оборудования, включая маршрутизаторы, компьютеры и брандмауэры..
Система киви позволяет вам записывать журналы событий по IP-адресу, дате или по типу источника сообщений. Вы можете получать уведомления о высоких условиях трафика, отправленные на ваши уведомления по электронной почте. Тем не менее, если вы получаете платную версию, есть еще много условий, о которых вы можете выбрать, чтобы получать уведомления по электронной почте. Сервер системных журналов Kiwi доступен только для Windows. Его можно установить на Windows Server 2008 R2, Windows Server 2012, Windows 7 с пакетом обновления 1, Windows 8.1 и Windows 10.
ВЫБОР РЕДАКТОРА
Kiwi Syslog Server — лучший выбор для сбора, просмотра и архивирования сообщений системного журнала и ловушек SNMP. Благодаря множеству фильтров и окнам регистрации в реальном времени вы можете внимательно следить за своей сетью и отправлять ежедневные сводки по электронной почте. Бесплатная версия ограничена 5 устройствами, но полная версия, всего за $ 295 он гораздо эффективнее с такими действиями, как отправка электронной почты, запуск программ и отправка журналов в базу данных. Как для больших, так и для небольших сетей, это отличный выбор сервера Syslog.
Скачать: БЕСПЛАТНАЯ версия от SolarWinds.com
Официальный сайт: www.solarwinds.com/free-tools/kiwi-free-syslog-server/
ОПЕРАЦИОННЫЕ СИСТЕМЫ: Windows & Windows Server
2. Сетевой монитор Paessler PRTG (БЕСПЛАТНАЯ ПРОБНАЯ ВЕРСИЯ)
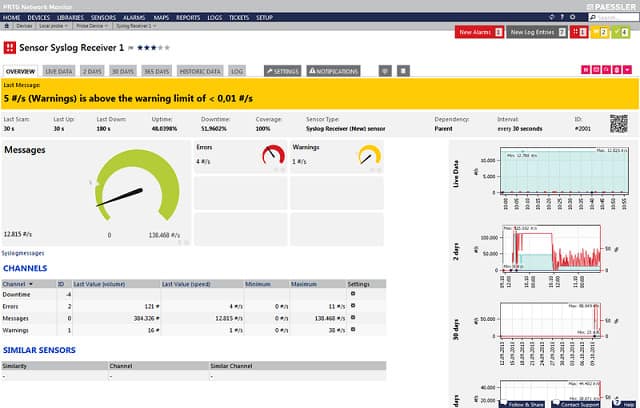
Paessler PRTG Сетевой монитор это очень комплексная система мониторинга сети. Тем не менее, вы можете использовать PRTG бесплатно если у вас небольшая сеть. Paessler взимает плату за «датчик». Датчик — это состояние или состояние в сети. Компания считает Syslog одним датчиком, и если вы контролируете 100 датчиков или меньше, система бесплатна. Таким образом, у вас будет 99 других условий сети, которые вы можете отслеживать, прежде чем платить.
Вы можете скачать программное обеспечение PRTG с веб-сайта Paessler и установить его на Windows. Для Linux нет версии. тем не мение, Вы можете выбрать доступ к программному обеспечению в качестве облачной службы, которая не зависит от системы.
Функция системного журнала в PRTG называется Syslog Receiver. Это позволит собрать все данные системного журнала, путешествующие по вашей сети, и записать их в базу данных. После того, как сообщения находятся в базе данных, последующее управление этими записями зависит от настроек, которые вы указываете для системы. Вы можете записывать их в файлы журналов, запрашивать их на панели инструментов PRTG и запускать действия при определенных условиях. Вы можете скачать и оценить бесплатную пробную версию здесь.
Сетевой монитор Paessler PRTGСкачать 30-дневную бесплатную пробную версию
3. Loggly (БЕСПЛАТНАЯ ПРОБНАЯ ВЕРСИЯ)
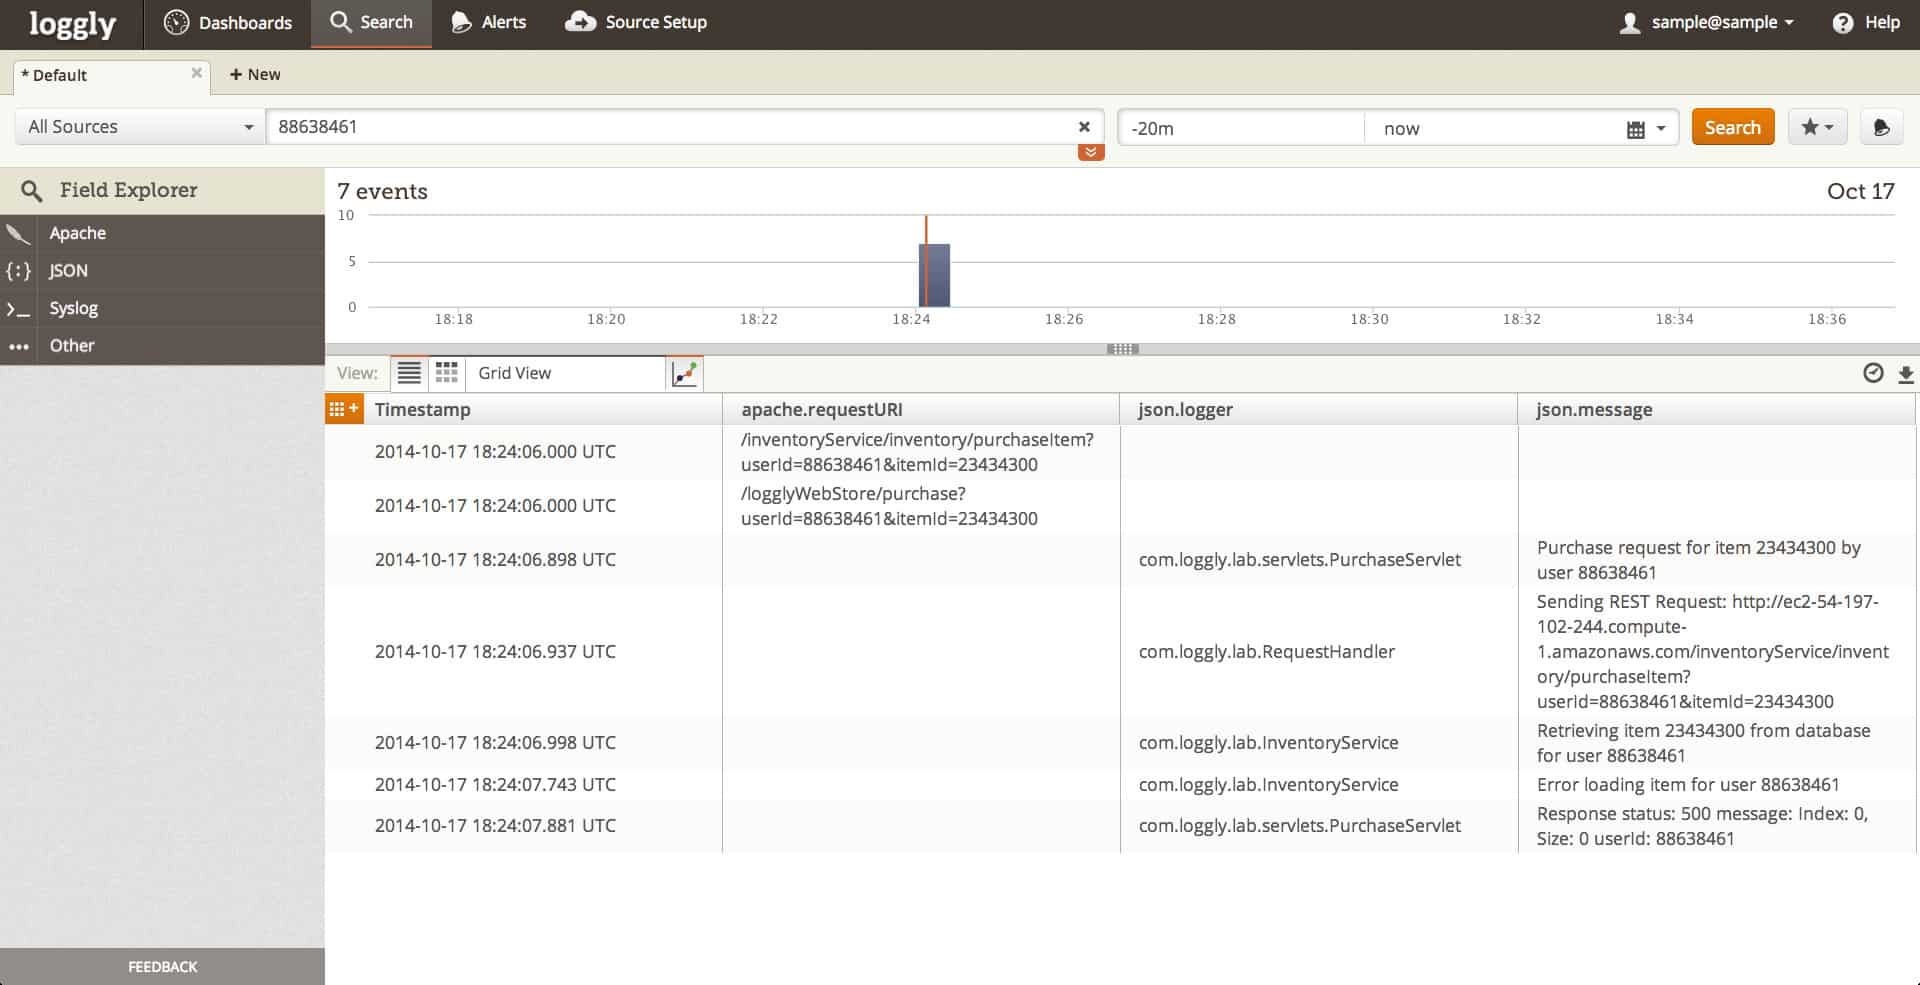
Loggly является облачный консолидатор и анализатор логов. Таким образом, вам не нужно устанавливать какое-либо программное обеспечение в вашем помещении, вам просто нужно настроить процедуры автоматической передачи файлов для загрузки журналов на сервер Loggly..
Система Loggly сохраняет ваши Сообщения системного журнала в стандартизированном формате. Он также будет принимать журналы от Amazon Web Services (AWS), Docker, Logstash и множества других систем захвата журналов. Все эти записи адаптированы таким образом, чтобы доступ к информации в них был единым образом. Как только ваши журналы будут в системе Loggly, вы сможете анализировать их с помощью инструментов онлайн-сервиса..
Большим преимуществом использования Loggly является то, что вы получаете место для хранения, включенное в сделку. Вам нужно сделать резервную копию всех ваших файлов журналов на другом сайте, отличном от вашего собственного сайта, чтобы убедиться, что активный хакер не проник в вашу систему и не удалил все записи о его действиях. Так что вам все равно придется искать решение облачного хранилища. Регистрация на сервис Loggly дает вам отскок к архивированию ваших журналов, делая данные доступными для анализа.
Время, в течение которого ваши данные журнала доступны в системе Loggly, зависит от того, на какой из четырех пакетов вы подписались. Lite Пакет постоянно бесплатен, но он сохраняет данные только в течение семи дней и позволяет использовать только одну учетную запись пользователя. стандарт Пакет позволяет вам передавать один ГБ данных в день и будет хранить ваши записи в течение месяца. профессионал Служба Loggly имеет метод с переменной ценой и позволяет вам передавать данные от трех до двадцати ГБ в день с периодом хранения от пятнадцати до девяноста дней. Верхняя упаковка называется предприятие и это специально для клиента отделом продаж.
Все услуги оплачиваются по подписке, и вы можете выбрать оплату ежегодно или ежемесячно. Вы можете попробовать платную учетную запись Loggly на 14-дневная бесплатная пробная версия — вам не нужно предоставлять какие-либо платежные реквизиты при регистрации в пробной версии. Ваша учетная запись будет просто уменьшена до Lite пакет, если вы решите не переходить на платную услугу в конце четырнадцати дней.
Loggly Log ManagementЗагрузить 14-дневную бесплатную пробную версию
4. ManageEngine EventLog Analyzer (БЕСПЛАТНАЯ ПРОБНАЯ ВЕРСИЯ)
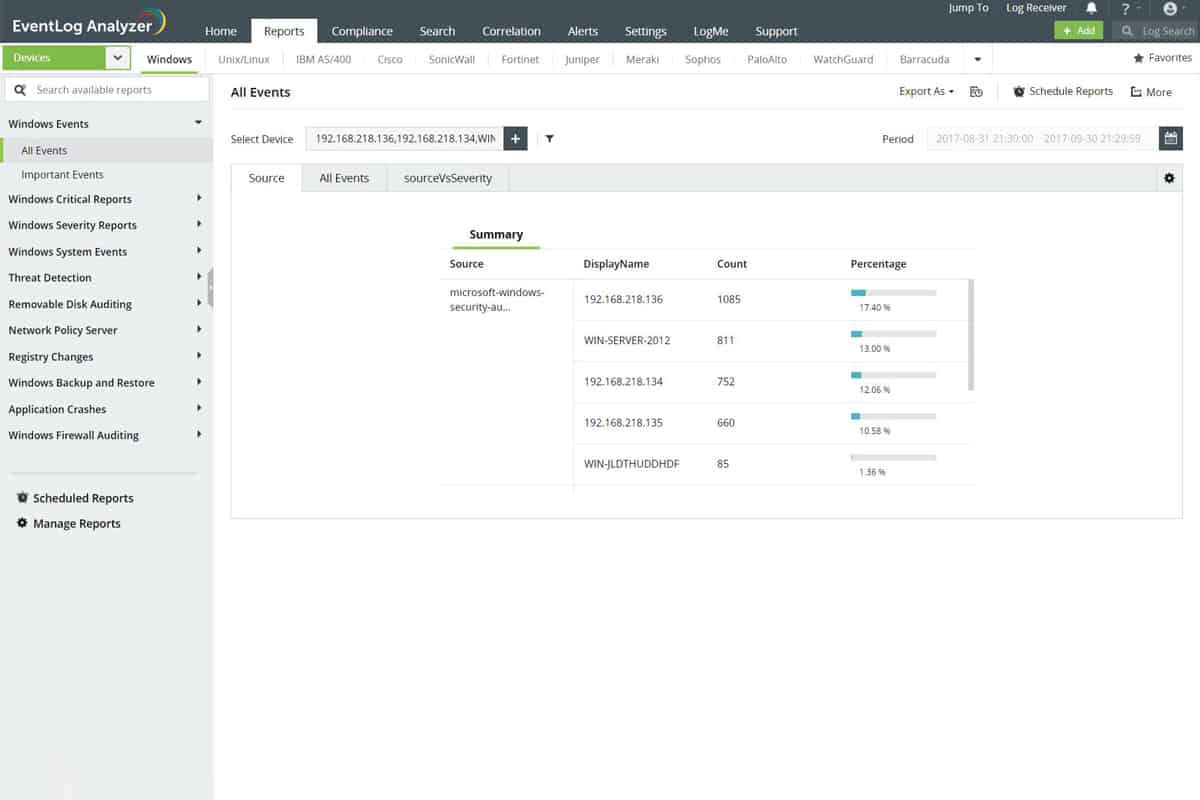
EventLog Analyzer ManageEngine работает как сервер Syslog и является бесплатно до пяти источников журнала. Программное обеспечение для мониторинга может быть установлено на Windows или Linux, но он может отслеживать события, возникающие в любой операционной системе. Данные системного журнала могут поступать из любого подключенного к сети оборудования, включая коммутаторы, маршрутизаторы и виртуальные машины.
Вам не нужно тратить много времени на настройку системы благодаря функции автообнаружения. Syslog — это стандарт обмена сообщениями, который реализуется практически всеми устройствами, подключенными к сети, поэтому EventLog Analyzer просто нужно прослушивать в сети все Syslog-совместимые сообщения рассылается подключенным к нему оборудованием. Каждое сообщение содержит заголовок, который определяет его происхождение. Это позволяет анализатору журналов событий создавать список всего оборудования в сети и выводить список предупреждений и отчетов о состоянии по IP-адресу / источнику..
Панель управления ManageEngine включает в себя множество функций, которые позволяют вам указать действия, которые нужно выполнить с собранными данными системного журнала.. Типичным требованием к серверу системного журнала является запись всех записей в журналы событий.. Это действие доступно, но вы также можете запрашивать записи на панелях мониторинга, а также сортировать и фильтровать сообщения. Архивные журналы могут быть сжаты и зашифрованы. Шифрование позволяет накладывать права доступа на учетные записи пользователей., таким образом, видимость данных в файлах системного журнала может быть ограничена только несколькими пользователями сети с правами администратора..
EventLog Analyzer также может следить за сообщениями SNMP. ManageEngine производит комплексную систему мониторинга сети, которая называется OpManager. Бесплатное издание Этот инструмент доступен только для 5 источников журналов. Вы также можете скачать 30-дневная бесплатная пробная версия из Premium Edition. Для получения более подробной информации о ценах вы можете связаться с их отделом продаж.
ManageEngine EventLog AnalyzerDownload 30-дневная бесплатная пробная версия
5. WhatsUp Syslog Server
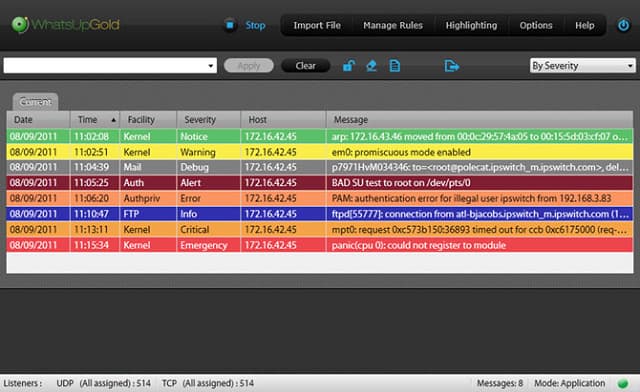
IPswitch выпускает успешный инструмент для мониторинга сети под названием WhatsUp Gold. Они также предлагают бесплатный сервер Syslog, который можно использовать как отдельную утилиту или интегрировать в пакет WhatsUp Gold. WhatsUp Syslog Server можно использовать бесплатно и может быть установлен на Windows.
Этот инструмент охватывает основные функции сервера Syslog: захват данных Syslog и их сохранение в журналах событий. Помимо этой стандартной функциональности, пакет предоставляет вам еще несколько возможностей, которые помогут вам лучше организовывать сообщения Syslog и обрабатывать их. Вы можете пересылать сообщения в другие приложения и сохранять записи в разные файлы выборочно. Сервер системного журнала включает консоль, на которой вы можете отображать записи и указывать, как программа работает с каждым типом сообщений..
Программа просмотра системного журнала показывает вам живые данные, как они поступают и вы можете фильтровать и сортировать записи, чтобы сосредоточиться на одном источнике типа сообщения. Объемы данных, которые инструмент может обработать, означает подходит для всех размеров сети, хотя это бесплатно. Консоль может обрабатывать до шести миллионов сообщений в час. Вы также можете импортировать архивные записи, чтобы анализировать события и получать долгосрочное представление о производительности сетевого оборудования..
Функции управления консоли позволяют указывать шаблоны, выделяющие конкретные условия оповещения или IP-адрес источника сообщения. Вы также можете создавать собственные предупреждения, указав комбинации условий, которые должны быть переведены в состояние предупреждения..
6. Системный журнал Watcher
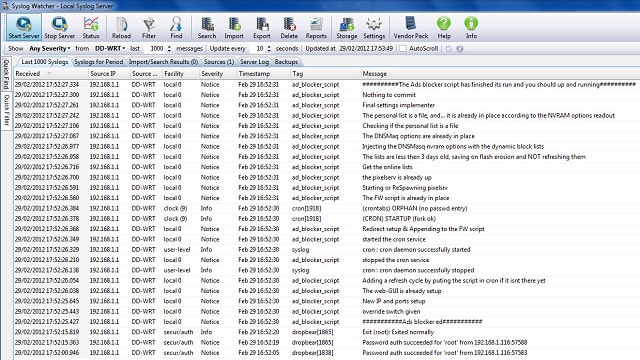
Syslog Watcher от EZ5 Systems доступен для установки на Windows. Это бесплатный сервер системного журнала Программа с рядом дополнительных функций мониторинга. Поскольку почти каждое устройство, подключенное к вашей сети, отправляет сообщения системного журнала, сервер системного журнала должен работать быстро, если вы хотите, чтобы он делал больше, чем просто собирал и записывал эти сообщения в файл.. Syslog Watcher использует многопоточную архитектуру, поэтому сбор новых записей не задерживается до завершения обработки.
Панель управления предоставляет вам варианты обработки сообщений. Вы не ограничены хранением их в файлах, потому что у вас есть возможность записи их в базу данных. Получение сообщений Syslog в базе данных дает вам гораздо больше возможностей для работы с записями событий, потому что вы можете сортировать, фильтровать, группировать и считать их. Это позволяет вам комбинировать события для создания условий оповещения клиента. Вы можете получать оповещения, отправленные вам по электронной почте через Syslog Watcher.
Syslog Watcher может отслеживать сообщения как по UDP, так и по TCP и работать как с адресными системами IPv4, так и с IPv6..
ОБНОВИТЬ: Syslog Watcher бесплатен для домашнего использования. Бизнес-пользователи должны платить за инструмент. Тем не менее, EZ5 Systems предлагает 30-дневная гарантия возврата денег. Итак, если вы хотите попробовать его бесплатно, просто используйте его в течение месяца, а затем попросите вернуть свои деньги.
7. Системный журнал Fastvue
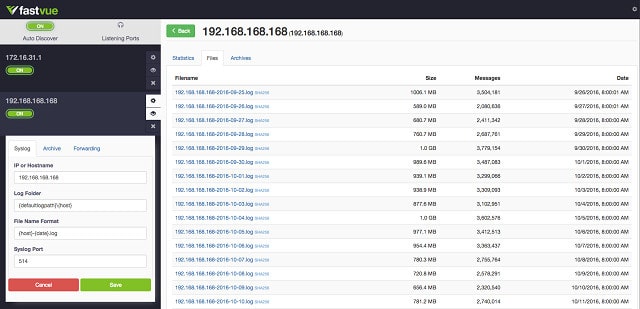
Fastvue специализируется на средствах сообщения о системных сообщениях. Одним из ее продуктов является бесплатная утилита сервера Syslog. Это программное обеспечение может быть установлено на Windows Server 2008 R2 и более поздние версии операционной системы Windows Server.
Система Syslog собирает входящие сообщения и записывает их в журналы событий. Это заботится о вашей основной функции сервера Syslog. Панель инструментов инструмента Fastvue проверяет все ваши архивные файлы и предоставляет отчет о размере каждого файла. Файлы сортируются по дате, и каждый из них становится партнером с помощью файла подтверждения, в котором хранится количество хэшей SHA-256. Следя за этой информацией, вы узнаете, не вмешивался ли файл журнала. Это важная функция для обнаружения вторжений, потому что хакеры будут изменять файлы журналов, чтобы скрыть свое присутствие.
Fastvue Syslog компилирует отдельные файлы журналов для каждого сообщающего устройства / IP-адреса, поэтому вы получаете каталоги файлов для каждого адреса устройства. Каждый файл содержит дневные сообщения с данными системного журнала, поступающие с устройства, которое скрывает каталог.
Этот сервер системного журнала фокусируется на создании и мониторинге файлов сообщений системного журнала, а не на предоставлении доступа к этим записям для анализа. Если вам нужна консоль для анализа записей, вам нужно будет импортировать файлы журналов в другое приложение.
8. Чувак
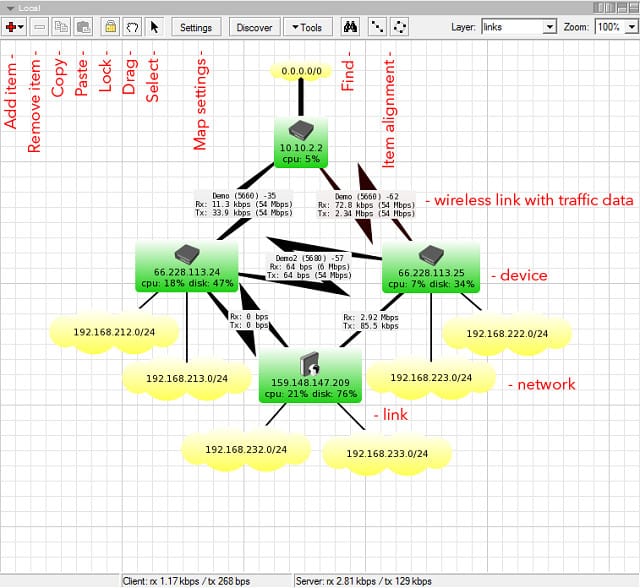
Чувак очень широко используется бесплатный инструмент для анализа сети это включает в себя функции сервера Syslog. Это приложение может быть установлено на любая версия Windows от Windows 2000, все версии Linux и macOS. Этот инструмент производится MikroTik, производителем маршрутизаторов из Латвии..
Эта система может контролировать ваши сетевые устройства и собирать данные системного журнала. Он может обрабатывать предупреждения SNMP, а также трафик ICMP и DNS. Чувак может контролировать как трафик TCP, так и UDP. Функции мониторинга сети включают автообнаружение и отображение топологии сети.
Доступ к функциям системного журнала The Dude можно получить на вкладке интерфейса.. Система может работать как полноценный сервер Syslog с дополнительными возможностями пересылки и фильтрации.. Вы можете заставить The Dude просто отправлять все записи в файл или указать правила для перенаправления соответствующих сообщений в другие места назначения, которые могут быть отдельными журналами событий или консолью системы. Вы также можете удалить определенные записи и заставить систему подавать звуковой сигнал, мигать или отображать всплывающее сообщение для пользовательских условий оповещения.
Чувак выполняет действия, когда он обнаруживает заданное условие оповещения, включая выполнение команд. Чувак может отправить вам электронное письмо или сделать устное объявление при обнаружении пользовательского условия оповещения.
9. Логос Nagios
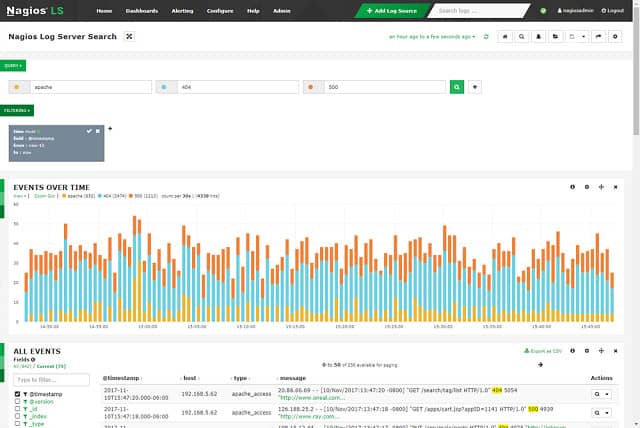
Nagios основан на проекте с открытым исходным кодом. Возможность загрузки исходного кода для системы означает, что вы можете использовать его для свободно. Тем не менее, существуют ограничения на бесплатную версию Nagios. Вы можете использовать систему бесплатно только до 500 МБ пропускной способности в день. Программное обеспечение Nagios может быть установлено на Windows и Linux.
Сервер журнала может собирать информацию о событиях Windows, системных журналах Linux и системных журналах сетевых устройств. Приложение объединяет сообщения журнала в одном центральном месте. Вы можете назначать физические серверы для хранения журналов событий, распределять хранилище по кластеру серверов, даже дублировать файлы в разных местах для создания резервных копий..
Консоль позволяет вам просматривать прямые трансляции сообщений журнала и получать доступ к ранее сохраненным данным системного журнала. Интерфейс включает в себя функции сортировки и фильтрации, которые помогут вам анализировать сообщения. Вы можете указать условия оповещения, которые могут состоять из комбинации состояний или обозначаться как оповещение о частоте появления определенных типов сообщений.. Возможности настройки Nagios распространяются даже на приборную панель. Можно заполнить панель мониторинга приоритетными функциями, включая списки сообщений. Другие элементы, которые вы можете разместить на панели инструментов, включают инструменты визуализации данных, такие как графики, гистограммы и диаграммы..
10. Ицинга 2
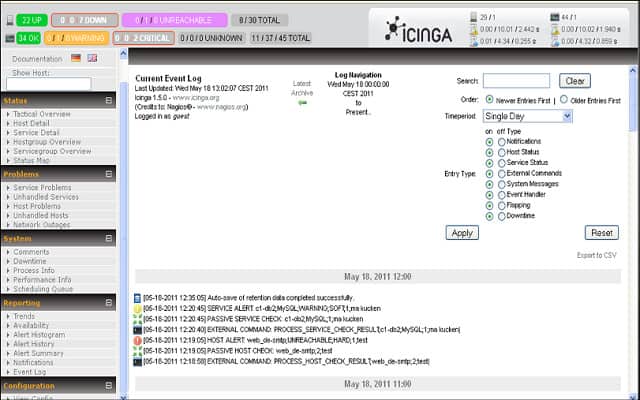
Исинга начинал как развилка Нагиоса. С момента своего создания в 2009 году этот пакет отошел от своего предшественника. Последняя версия программного обеспечения называется Icinga 2, и ее можно установить на Linux. Пакет состоит из двух частей. Основная система это процессор данных, и последняя версия этого программного обеспечения называется Icinga 2. Бэкэнд может взаимодействовать с целым рядом приложений для управления данными, в том числе графит и InfluxDB. Команда Icinga также производит свой собственный интерфейс, называемый Веб 2.0, который доступен на веб-сайте Icinga в отдельной загрузке.
Icinga 2 — это комплексный инструмент для мониторинга сети, одной из функций которого является функция регистрации. Вы можете установить источник регистрации данных Syslog. По желанию, регистратор может быть настроен на сбор сообщений Syslog определенного уровня серьезности. Он не ограничит сбор сообщений только указанным уровнем серьезности, но будет записывать все сообщения с заданным уровнем серьезности, а также сообщения с более высоким уровнем серьезности. Последовательность типов сообщений: «отлаживать,«уведомление,«Информация,«предупреждение,» и «критический.Уровень по умолчанию — «предупреждение», поэтому, если вы просто укажете регистратору на Syslog, не указав минимальный уровень серьезности, он подберет все предупреждения и критические сообщения..
Если вы посмотрите на сайт Icinga по цене, вы не найдете его, потому что этот инструмент мониторинга сети совершенно бесплатно.
11. Сервер визуальных системных журналов
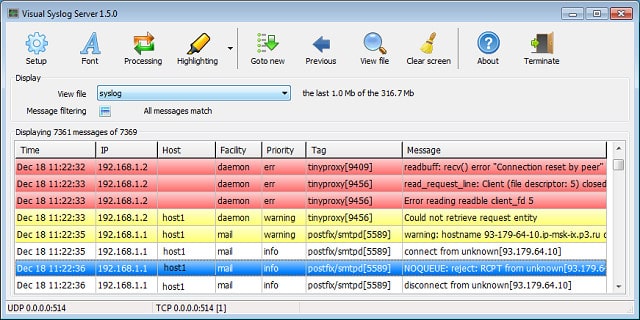
Visual Syslog Server — это небольшая утилита, которая собирает данные Syslog и отображает их в средстве просмотра. Записи также могут быть записаны в журналы событий и повернуты по дате или размеру файла. Это приложение может быть установлено на Windows и это доступно бесплатно. Программное обеспечение может быть установлено на Windows XP и выше, а также в Windows Server 2003, 2008 и 2012.
На панели инструментов записи имеют цветовую кодировку с сообщениями об ошибках красного цвета и предупреждениями желтого цвета. Эти цвета могут быть настроены. Вы получаете в реальном времени сообщения и вы также можете загружать записи в программу просмотра из файлов..
Хотя эта утилита не имеет сложной графики или вариантов обработки, она легкая и быстрая, поэтому у нее есть рынок. Зритель представляет записи и позволяет фильтровать их и сортировать их. Интерфейс может быть настроен на воспроизведение звука при возникновении состояния тревоги. Вы также можете установить приложение на отправить вам электронное письмо, когда оно обнаружит предупреждение или предупреждение. Если ваша система электронной почты поддерживает шифрование, Visual Syslog Server будет шифровать отправляемые вам электронные письма с уведомлениями. Это удобный, бесплатный, готовый к использованию инструмент, который выполняет свою работу.
12. Системный журнал-NG
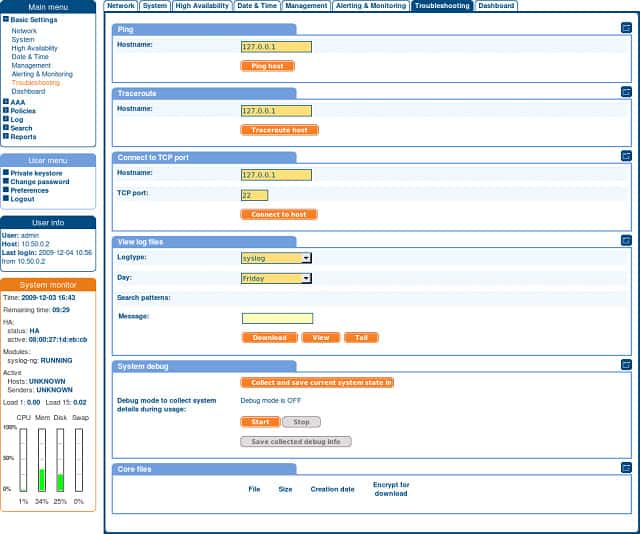
Syslog-NG является открытый источник пакет, который бесплатно использовать. Программное обеспечение для Syslog-NG может быть установлено только на Linux. Однако система управления журналами может собирать данные о событиях Windows, а также стандартные сообщения системного журнала, генерируемые микропрограммой для Linux, Unix и устройств..
Система Syslog-NG будет собирать все сообщения Syslog (и события Windows) с устройств, подключенных к вашей сети, записывая IP-адрес источника.. Назначение по умолчанию для этих записей — журналы событий.. Тем не менее, вы также можете пересылать сообщения системного журнала другим приложениям или вставлять их в базу данных SQL. Syslog-NG — это чистый сервер Syslog, так как он имеет дело только с захватом сообщений Syslog. Syslog-NG реорганизует системные сообщения, поступающие в разных форматах, чтобы они сохранялись в одном макете.
Другие серверы системного журнала в этом списке могут анализировать данные из сообщений. Некоторые серверы Syslog имеют привлекательные информационные панели с функциями визуализации данных. Вы не получите ничего подобного с Syslog-NG. Если вы хотите получить больше функциональности для обработки сообщений системного журнала, вам нужно добавить инструмент анализа данных.
13. Nxlog
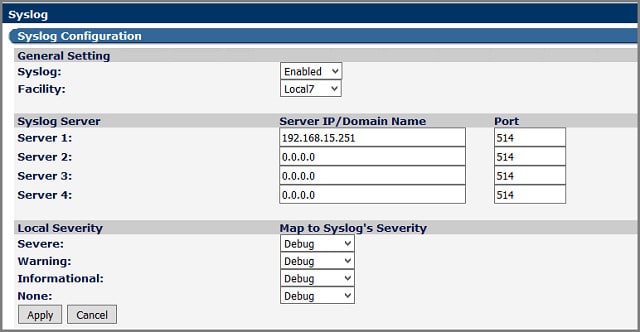
Этот обзор включает программы сервера Syslog, которые могут быть установлены в Windows и / или Linux. Nxlog может быть установлен на любую из этих операционных систем, а также на Unix и Android. В какой бы операционной системе вы не установили эту систему, она сможет собирать данные системного журнала из всех остальных — Unix, Linux, Windows и Android.
Nxlog — это простая система сбора сообщений. Он может работать через UDP и TCP и может получать сообщения, защищенные шифрованием TLS. Сообщения записываются в файлы, а также могут храниться в базах данных. Во всех случаях Nxlog создает стандартный формат записи, объединяющий данные из разнородных источников.. Многопоточная архитектура позволяет этому инструменту обрабатывать сотни тысяч сообщений в секунду, делая его подходящим для всех размеров сети.
Система Nxlog с открытым исходным кодом, и вы можете использовать ее бесплатно. В этом инструменте нет никаких аналитических функций, поэтому, если вы хотите просматривать записи или каким-либо образом манипулировать ими, вам потребуется найти отдельный интерфейс для анализа. Это простой способ сбора сообщений и создания лог-файлов., делая его чистым сервером Syslog.
14. Logstash
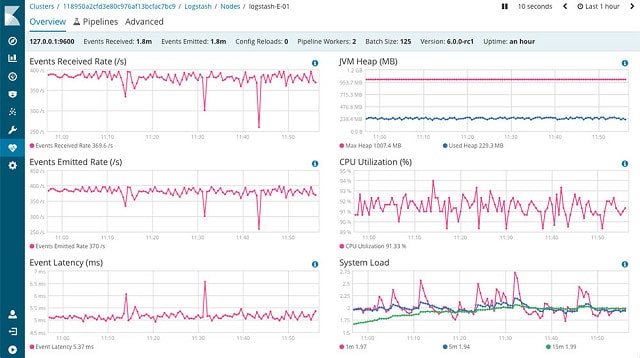
Logstash является частью набора утилит под названием «Эластичный стек.Эта группа инструментов создается группой разработчиков, чей первый продукт называется Elasticsearch. Elasticsearch является вторым элементом в Elastic Stack, как и Kibana. Разделение труда между этими тремя пакетами состоит в том, что Logstash собирает сообщения журнала, Elasticsearch позволяет сортировать и фильтровать эти сообщения для анализа, а Kibana интерпретирует и отображает данные.. Все программы Elastic Stack работают в Linux.
Kibana — отличный интерфейс для любого из других серверов Syslog из этого списка. В качестве службы сбора сообщений о событиях для стека, Logstash работает как сервер Syslog. Утилита прослушивает в сети сообщения, отправленные из самых разных источников.. Чтобы записать определенный поток, вам необходимо установить плагин для этого типа данных. Вы можете просто установить плагин Syslog или добавить другие плагины, чтобы включить другие источники данных.
Logstash также собирает данные из облачных сервисов, включая AWS. Он может собирать данные из таких приложений, как Ganglia, Salesforce, Graphite, Kafka и Twitter.. Вы можете настроить процесс сбора, чтобы включить TCP и UDP сообщения и он может получать сообщения, зашифрованные с помощью TLS. Logstash может читать сообщения из файла, из базы данных, получать сообщения SNMP, IRC и RSS-каналы, а также получать сообщения с почтовых серверов..
Logstash может фильтровать переадресацию и переформатировать сообщения во время обработки. Программа хранит записи в файлах или вставляет их в базы данных. Утилита предназначена для интеграции с Elasticsearch и может отправлять данные непосредственно в это приложение. Аналогично, Logstash может быть настроен на вывод данных в Loggly, Nagios, AWS, Graphite и Graylog. Другие плагины будут уведомлять вас о новых данных журнала по электронной почте или сообщением Slack.. Logstash доступен бесплатно.
15. Graylog
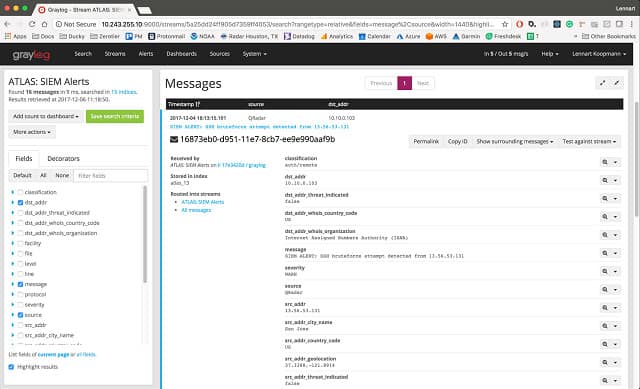
Graylog является система управления бревнами доступны для Linux. Это сложный инструмент анализа данных Syslog. Тем не менее, вы можете просто воспользоваться его возможностями сбора и хранения сообщений, чтобы использовать его как чистый сервер Syslog. Graylog свободен для объемов данных 5 ГБ или менее в день. Владельцам небольших сетей не нужно ничего платить за их использование. Функции анализа данных не генерируют дополнительную пропускную способность. Вы не получаете никакой поддержки с бесплатной версией Graylog. Тем не менее, форум сообщества на веб-сайте Graylog заполнен советами и рекомендациями других пользователей..
Graylog находится на вершине программного обеспечения виртуальной машины. Эта базовая система в Linux включает в себя средство rsyslog. Это на самом деле rsyslog, который будет выполнять функции сбора и хранения сообщений Syslog. Вы можете управлять rsyslog через интерфейс Graylog. Если вы платите за Graylog, вы также можете собирать данные через систему Sidecar. Это позволяет хранить журналы событий на компьютерах с Windows.
Внешний интерфейс Graylog основан на браузере. Это будет отображать входные данные по типу, так что вы сможете увидеть ваши сообщения системного журнала вместе в одном разделе панели инструментов. Вы можете настроить панель мониторинга, поэтому, если вы настроите систему на сбор сообщений из нескольких источников, вам не нужно показывать информацию из других источников на той же странице, что и ваши сообщения системного журнала.. Виджеты, доступные для панели инструментов, включают визуализацию данных, например гистограммы..
Панель инструментов позволяет создавать собственные условия оповещения. Вы указываете каждое предупреждение на основе типа потока данных. Например, вы можете выберите поток Syslog UDP, а затем настройте условие оповещения о количестве предупреждающих сообщений, которые поступают через. Системные настройки позволяют получать оповещения, отправленные вам в качестве уведомлений по электронной почте. Процедуры потоковой обработки позволяют вам анализировать записи, пересылать их или сохранять в файле или базе данных.
16. TFTPD32 / 64
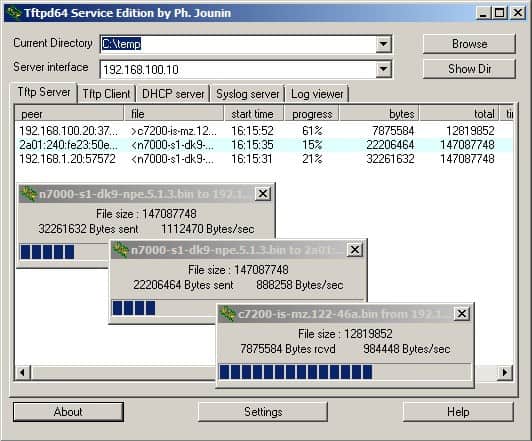
TFTPD является небольшая утилита для Windows. Пакет доступен в виде 32-разрядного или 64-разрядного приложения. Центральным элементом этого программного обеспечения является реализация клиента TFTP. Этот клиент может быть настроен на получение сетевых сообщений от серверов DHCP, DNS и SNTP. Он также может получать данные системного журнала.
Это простая утилита с открытым исходным кодом, которая отображает сообщения на панели инструментов по мере их поступления. Кнопки над средством просмотра дают вам возможность просматривать сообщения по типу и Системный журнал — один из типов сообщений, которые могут быть показаны. Вы видите сообщения, когда они перемещаются по пути в журналы событий, и программа просмотра также называет файл, в котором должны храниться сообщения системного журнала. Эта утилита не дает много функциональности для анализа данных. Тем не менее, вы также можете читать записи из файла, а затем у вас есть возможность сортировать и фильтровать сообщения.
TFTPD может работать как с адресами IPv6, так и с адресами IPv4. TFTPD32 и TFTPD64 оба доступно бесплатно.
Серверы системного журнала по ОС
Syslog serverLinuxWindowsOther
| киви | нет | да | нет |
| Paessler PRTG | нет | да | да |
| Loggly | да | да | да |
| Анализатор журнала событий | да | да | нет |
| WhatsUp Syslog Server | нет | да | нет |
| Syslog Watcher | нет | да | нет |
| Fastvue Syslog | нет | да | нет |
| Чувак | да | да | да |
| Nagios Log Server | да | да | нет |
| Исинга 2 | да | нет | нет |
| Visual Syslog Server | нет | да | нет |
| Syslog-NG | да | нет | нет |
| Nxlog | да | да | да |
| Logstash | да | нет | нет |
| Graylog | да | нет | нет |
| TFTPD32 | нет | да | нет |
Выбор сервера системного журнала
Как видно из описания инструментов в нашем списке, вы можете выбрать простой сервер Syslog или выбрать аналитический инструмент или систему мониторинга сети, которая включает функции сервера Syslog..
Чтобы квалифицироваться как сервер системного журнала, инструмент должен быть в состоянии собирать системные сообщения написано в соответствии с протоколом системного журнала и хранить их. Возможности пересылки системного журнала очень полезны, так же как и возможность чередовать журналы, что означает периодическое создание новых файлов..
Помимо основных функций передачи сообщений системного журнала в файлы, вы можете искать возможности сортировать и фильтровать сообщения. Полезна возможность варьировать обработку в соответствии с типами сообщений и удалять сообщения отладки и информационные уведомления. Программисту может потребоваться просмотреть эти отладочные сообщения и, следовательно, возможность выборочно направлять типы сообщений в зритель, файл журнала, или база данных может быть очень полезным.
Эволюция обработки Syslog для хранения записей в базе данных, а не в файле предлагает вам большие возможности. Это гораздо проще индексировать, сортировать, искать и фильтровать записи в базе данных, чем манипулировать записями файлов. Это связано с тем, что базы данных включают язык структурированных запросов, который позволяет изолировать поля в записях и выполнять функции выбора, группировки и исключения данных без изменения исходных сохраненных записей..
Еще одно полезное усовершенствование серверов Syslog, доступных сегодня, — это система, которая может собирать сообщения, генерируемые другими платформами и протоколами, такие как журнал событий Windows. Если ваш сервер Syslog может создать стандартизированные форматы записи, это еще один шаг вперед по маршруту, чтобы собрать важную информацию о вашей системе.
Получение предупреждений, созданных для условий, о которых сообщает Syslog, также даст вам дополнительную возможность сосредоточить свою энергию на важных задачах.. Возможность создавать собственные условия оповещения представляет собой прогресс в обработке системного журнала.. Иногда содержимое сообщения может не вызывать беспокойства. Однако внезапное увеличение частоты таких сообщений должно стать предупреждением, и вы можете указать такие условия на многих серверах системного журнала, перечисленных в этом обзоре.. Возможность комбинировать количество типов сообщений или состояний ошибок — еще одна полезная функция что многие современные серверы Syslog включают.
Сервер системного журнала, встроенный в инструмент управления сетью, может обеспечить широкие возможности анализа. Если у вас уже есть все необходимые аналитические инструменты, вам лучше сосредоточиться на инструментах сервера Syslog в этом обзоре. тем не мение, если у вас очень мало средств на программное обеспечение для управления системой, и в настоящее время у вас нет аналитических инструментов, затем перейдите к бесплатной утилите управления системой, которая включает в себя сервер системного журнала, чтобы контролировать вашу ИТ-инфраструктуру.
Управление ИТ-услугами требует соответствующих инструментов. Посмотрите на бесплатные инструменты рекомендуется в этом обзоре, который подходит для вашей операционной системы. Потратьте немного времени, чтобы поиграть с каждым инструментом, чтобы вы могли открыть для себя их функции. Учитывая, что все эти инструменты бесплатны, вам нечего терять, кроме времени, необходимого для их изучения..
 Всем привет.
Как то мы разбирали ранее что события с Windows-сервера можно перенаправить на другой Windows-сервер.
Это легко можно устроить с помощью групповой политики. Для этого в групповой политике в ветке “Computer Configuration –> Policies –> Administrative Templates –> Windows components –> Event Forwarding” установить параметр “Configure the server address, refresh interval, and issuer certificate authority of a target Subscription Manager” в значение “Enabled” со следующим значением опции “SubscriptionManagers”: Server=http://<Event Collector FQDN>:5985/wsman/SubscriptionManager/WEC
Для протокола HTTPS прописываете обмен через порт 5986.
И надо не забыть сказать кто(hostname or IP-adr) имеет право эти события забирать в политике Windows Components/Windows Remote Management (WinRM)/WinRM Service. This policy setting allows you to manage whether the Windows Remote Management (WinRM) service automatically listens on the network for requests on the HTTP transport over the default HTTP port. If you enable this policy setting, the WinRM service automatically listens on the network for requests on the HTTP transport over the default HTTP port. To allow WinRM service to receive requests over the network, configure the Windows Firewall policy setting with exceptions for Port 5985 (port for HTTP).
Но я решил такую трансляцию разнообразить и передавать все события и на сервер syslog для страховки. Для начала решаем чем же сделать шлюз.
Еvtsys.
Для того чтобы включить трансляцию событий из журналов сервера в syslog надо доставить на него один маленький сервис. Этот сервис Еvtsys хорошо известен в сети, и не менее популярно описан как самим автором так и благодарными пользователями.
Его установка весьма проста.
copy evtsys.* %systemroot%system32
%systemroot%system32evtsys.exe -h SYSLOGSRV -s 240 -i
net start evtsys
где SYSLOGSRV это имя нашего Syslog-сервера.
Далее неплохо бы поправить файл конфига %systemroot%system32evtsys.cfg
net stop evtsys
…правка…
net start evtsys
По умолчанию фильтр указанный в Evtsys.cfg выглядит так, что передаются события со всех четырех основных журналов.
XPath:Application:<Select Path=»Application»>*</Select>
XPath:Security:<Select Path=»Security»>*</Select>
XPath:Setup:<Select Path=»Setup»>*</Select>
XPath:System:<Select Path=»System»>*</Select>
Разумеется мне столько информации не надо, поэтому я его переписал по другому. Т.е. передаем полностью два специализированных журнала плюс фильтруем на передачу журнал Security по кодам событий.
XPath:Microsoft-Windows-Sysmon/Operational:<Select Path=»Microsoft-Windows-Sysmon/Operational»>*</Select>
XPath:Directory Service:<Select Path=»Directory Service»>*</Select>
XPath:Security:<Select Path=»Security»>*[System[Provider[@Name=’Microsoft-Windows-Security-Auditing’ or @Name=’EvtSys’]
and (EventID=4624 or EventID=4625 or EventID=4720 or EventID=4725 or EventID=4726 or EventID=4740 or EventID=4767 or EventID=4771)]]</Select>
Краткая справка по Facility.
0 kernel messages
1 user-level messages
2 mail system
3 system daemons
4 security/authorization messages
5 messages generated internally by syslogd
6 line printer subsystem
7 network news subsystem
8 UUCP subsystem
9 clock daemon
10 security/authorization messages
11 FTP daemon
12 NTP subsystem
13 log audit
14 log alert
15 clock daemon
16 local use 0 (local0)
17 local use 1 (local1)
18 local use 2 (local2)
19 local use 3 (local3)
20 local use 4 (local4)
21 local use 5 (local5)
22 local use 6 (local6)
23 local use 7 (local7)
По умолчанию system daemons пишет в local1.
Logparser.
Есть еще одна возможность тянуть события с журналов сервера ничего дополнительно не устанавливая на сервер. Оказывается горячо любимый Logparser может не только отобрать то что мне надо, но и передать результат в формате Syslog на другой сервер. К примеру формируем SQL-запрос в диапазоне прошедших суток.
fexp2.sql:
=========
SELECT TimeGenerated,
CASE SourceName
WHEN ‘EventLog’ THEN ‘local0’
WHEN ‘Service Control Manager’ THEN ‘daemon’
WHEN ‘Print’ THEN ‘lpr’
WHEN ‘Kerberos’ THEN ‘auth’
WHEN ‘NETLOGON’ THEN ‘logaudit’
WHEN ‘Application Popup’ THEN ‘local7’
ELSE ‘local0’
END AS MyFacility,
CASE EventTypeName
WHEN ‘Error event’ THEN ‘err’
WHEN ‘Warning event’ THEN ‘warning’
WHEN ‘Information event’ THEN ‘info’
ELSE ‘info’
END AS MySeverity,
ComputerName,
STRCAT(SourceName, ‘:’),
EventID,
Message
INTO @%Output%
FROM \%Source%Security
WHERE (EventID IN (4624;4625;4720;4725;4726;4740;4767;4771)
AND (TimeGenerated > TO_TIMESTAMP(‘%DY%’,’yyyy-MM-dd’) AND TimeGenerated <= TO_TIMESTAMP(‘%DT%’,’yyyy-MM-dd’)))
И не забываем в конце вызова Logparser указать параметр -o:SYSLOG
@echo off
set Source=DC01
set Output=SYSLOGSRV
set D=%date:~-10,2%
set /A D -= 1
set DateT=%date:~6,4%-%date:~3,2%-%D:~0,2%
set D=%date:~-10,2%
set /A D -= 2
set DateY=%date:~6,4%-%date:~3,2%-%D:~0,2%
Logparser.exe file:fexp2.sql?Out=%Output%+Src=%Source%+DT=%DateT%+DY=%DateY% -o:SYSLOG
Работает! Отличие от первого варианта — да, это будет не в режиме онлайн. Но можно исправить код запроса и установить вызов Logparser-а каждые 5 минут в планировщик задач. Или даже чаще.
Итак наш источник событий настроен, а что же у нас там с приемником т.е. Syslog-севером.
Tftpd64 сервер.
Самый простой SYSLOG-сервер для проверки что с сервера DC01 сообщения приходят успешно поднимается на щелчок пальцами. Есть такая отдельная программа Tftpd64, обладающая целым рядом интегрированных сервисов для быстрой передачи файлов. Инсталляция не требуется. Она имеет встроенный TFTP-клиент и сервер, серверы SNTP, SYSLOG, DHCP и DNS. После запуска Tftpd64 все необходимые серверы уже будут доступны, вам нужно будет внести все необходимые настройки для соответствия программы вашим потребностям в вашем окружении. Благо, это не потребует значительных усилий, благодаря простому и понятному интерфейсу. Для доступа к каждому серверу, в главном окне программы предусмотрена отдельная вкладка.
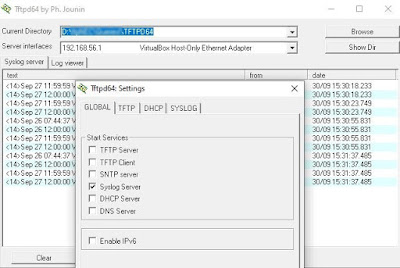
Все просто, все понятно — единственное что нет никаких фильтров на приеме сообщений и их просмотре. Поэтому я временно задействовал другой SYSLOG-сервер.
Visual Syslog сервер.
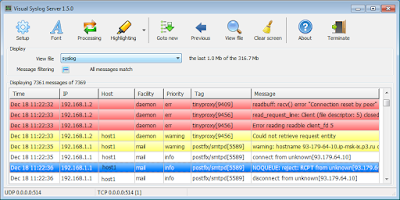
Visual Syslog сервер для Windows это программа для получения и просмотра сообщений syslog. Программа бесплатная с открытым исходным кодом. Лицензия GPL. После установки Visual Syslog Сервер для Windows сразу готов к работе, настройка не требуется. По умолчанию ожидает сообщений на портах 514 UDP и 514 TCP. Программа установки добавляет исключения брандмауэра для Visual Syslog сервер. В Visual Syslog сервере можно донастроить фильтры на приеме сообщений (Processing) чтобы не писать в файл журнала то что нам мне надо. Или распределить сообщения по разных файлам в зависимости от источника и дня недели. Visual Syslog также можно использовать и для визуального просмотра старых журналов Syslog.
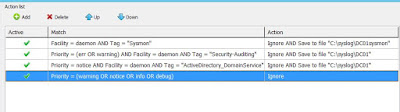
Все ему хорошо за исключением того что он не запускается как служба и больше не развивается. Но скорее всего я много хочу от бесплатной программы.
Успехов.
Для решения Вашей проблемы специалисты технической поддержки AXIA могут запросить детальный журнал активности системы. Для этого необходимо использовать Syslog сервер и настроить соответствующим образом оборудование. Ниже будет описано как это сделать. Изменяйте настройки только , если это необходимо для решения проблемы, в противном случае Syslog настройки должны быть оставлены в значениях по умолчанию.
Специалистами Telos был создан простой, не требующий установки Syslog Server. Программа является приложением .NET для Windows 7, но возможен запуск на WinXP при условии наличия установленного клиента .NET v3.5 или более поздней версии. Клиент .NET может быть загружен и установлен бесплатно с веб-сайта Microsoft
syslogserver.zip — архив с дистрибутивом и описанием.
Архив необходимо распаковать и запустить исполняемый файл syslog_server.exe на компьютере с доступом в сеть Livewire. При запуске его в первый раз, Windows брандмауэр может попросить о разрешении приложению доступа к сети. Вы должны выбрать «Разрешить» для syslog, чтобы иметь возможность получать информацию. Прием информации осуществляется по UDP через порт 514.
Окно запущенного приложения выглядит так:
Для получения сообщений на SysLog sеrver необходимо настроить оборудование для отправки лог-сообщений на IP-адрес компьютера, на котором запущено приложение.
Если IP адрес неизвестен, то его можно узнать с помощью команды ipconfig на этом компьютере:
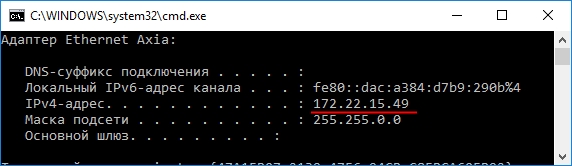
Этот IP адрес необходимо записать в поле «Syslog server (IP address):» на вкладке System WEB-интерфейса оборудования AXIA:
На примере AXIA Analog xNode:
После этого необходимо выбрать уровень событий, подлежащих регистрации в отчетах из списка Syslog severity level filter

- Emergency: регистрирует события, связанные с полной неработоспособностью системы.
- Alert: регистрирует события, требующие немедленного внимания для сохранения работоспособности.
- Critical: регистрирует события о критических системных ошибках.
- Warning: регистрирует события, которые могут привести к нестабильности системы.
- Notice: система работает нормально, но в отчетах регистрируются сообщения о необычных событиях.
- Informational: регистрируются все информационные сообщения. Эта информация включает все рутинные события.
- Debug: регистрируются вся системная деятельность
Аналогичным образом настраивается и другое оборудование AXIA. Для консолей в пункте меню Log Setup, для Engine в меню Diagnostics.
После совершения изменений в настройках щелкните кнопку Apply для их сохранения:

Теперь осталось только нажать кнопку START для начала работы сервера:
Все готово для регистрации системной активности.
События, регистрирующие процесс перезагрузки AXIA Analog xNode на уровне Debug выглядят так:
Для поиска необходимых записей можно осуществлять фильтрацию сообщений:
- по уровню — выбрать необходимые с помощью списка слева
- по контексту — ввести текст для поиска и нажать кнопку Filter
Для сохранения сообщений в файл необходимо настроить его параметры в меню Options на вкладке LOG:
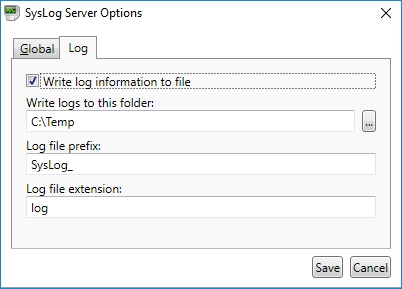
По указанному пути будет создан файл с названием вида SysLog_ГГГГ-MM-DD.log (ГГГГ-MM-DD — текущая дата), в котором будет сохраняться полученная в течении дня информация:
17:45:28.877: [172.22.15.6:42527, Info] Nov 30 01:30:00 Node-100-2 login[125]: root login  on `ttyp0'
17:45:36.525: [172.22.15.6:42527, Info] Nov 30 01:30:08 Node-100-2 syslogd: System log daemon exiting.
17:45:56.891: [172.22.15.6:50549, Notice] Nov 30 00:00:09 Node-100-2 lwrd[44]: eth0 flags 0x1003 (link down)
17:45:56.895: [172.22.15.6:50549, Notice] Nov 30 00:00:09 Node-100-2 lwrd[44]: eth1 flags 0x1003 (link down)
17:45:56.899: [172.22.15.6:50549, Notice] Nov 30 00:00:10 Node-100-2 lwrd[44]: eth0 flags 0x11043 (link up)
17:45:57.325: [172.22.15.6:50549, Debug] Nov 30 00:00:11 Node-100-2 lwrd[44]: Registered: SRC 1@Node-100-2._rtsp._tcp.local.
17:45:57.328: [172.22.15.6:50549, Debug] Nov 30 00:00:11 Node-100-2 lwrd[44]: Registered: sip:1@172.22.15.6 SRC 1@Node-100-2._sipuri._udp.local.
17:45:58.437: [172.22.15.6:50549, Info] Nov 30 00:00:12 Node-100-2 lwrd[44]: connected @13 127.0.0.1:57611
17:45:58.440: [172.22.15.6:50549, Info] Nov 30 00:00:12 Node-100-2 gpior[46]: gpior-lwrd connected
17:45:58.444: [172.22.15.6:50549, Debug] Nov 30 00:00:12 Node-100-2 gpior[46]: iface change 172.22.15.6
17:45:58.447: [172.22.15.6:50549, Debug] Nov 30 00:00:12 Node-100-2 gpior[46]: gpiomc ANY:2060 joined 239.192.255.4 on 172.22.15.6
17:46:01.328: [172.22.15.6:50549, Info] Nov 30 00:00:15 Node-100-2 lwrd[44]: config save 88ms
17:46:02.556: [172.22.15.6:50549, Info] Nov 30 00:00:16 Node-100-2 lwrd[44]: connected @16 127.0.0.1:57612
17:46:03.627: [172.22.15.6:50549, Notice] Nov 30 00:00:17 Node-100-2 xsyncd: lwsync up on 172.22.15.6
17:46:04.656: [172.22.15.6:50549, Notice] Nov 30 00:00:18 Node-100-2 xsyncd: lwsync master time out
17:46:05.656: [172.22.15.6:50549, Info] Nov 30 00:00:19 Node-100-2 xsyncd: master: AC030F06 .6 p3 00:50:C2:79:16:B3 we are
Кроме вышеописанного syslog server существует множество других аналогичных программ для регистрации сообщений о системной активности. Они могут обладать разными возможностями, интерфейсами и стоимостью.
Как вариант программы с расширенными настройками можно рассмотреть бесплатное ПО Visual Syslog Server (архив с дистрибутивом v1.6.3 2015-11-20 )
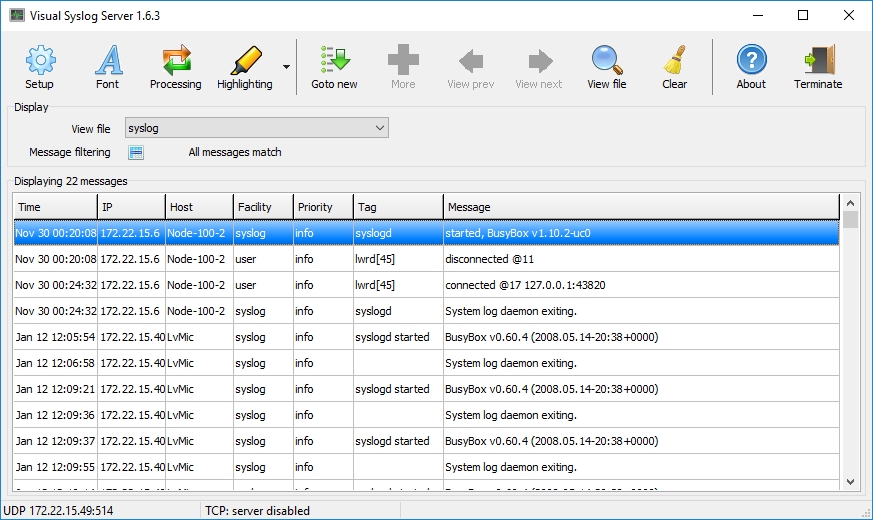
Эта программа уже требует инсталляции, но позволяет настраивать параметры log файла, просматривать log файлы с диска, формировать извещения и выполнять действия в зависимости от содержания лога, работать по протоколам UDP и TCP, поддерживает кодировку UTF8.
Интерфейс интуитивно понятен, а подробное описание можно найти на странице разработчика