A launch.json file is used to configure the debugger in Visual Studio Code.
Visual Studio Code generates a launch.json (under a .vscode folder in your project) with almost all of the required information. To get started with debugging you need to fill in the program field with the path to the executable you plan to debug. This must be specified for both the launch and attach (if you plan to attach to a running instance at any point) configurations.
The generated file contains two sections, one that configures debugging for launch and a second that configures debugging for attach.
Configure VS Code’s debugging behavior
Set or change the following options to control VS Code’s behavior during debugging:
program (required)
Specifies the full path to the executable the debugger will launch or attach to. The debugger requires this location in order to load debug symbols.
symbolSearchPath
Tells the Visual Studio Windows Debugger what paths to search for symbol (.pdb) files. Separate multiple paths with a semicolon. For example: "C:\Symbols;C:\SymbolDir2".
requireExactSource
An optional flag that tells the Visual Studio Windows Debugger to require current source code to match the pdb.
additionalSOLibSearchPath
Tells GDB or LLDB what paths to search for .so files. Separate multiple paths with a semicolon. For example: "/Users/user/dir1;/Users/user/dir2".
externalConsole
Used only when launching the debuggee. For attach, this parameter does not change the debuggee’s behavior.
- Windows: When set to true, it will spawn an external console. When set to false, it will use VS Code’s integratedTerminal.
- Linux: When set to true, it will notify VS Code to spawn an external console. When set to false, it will use VS Code’s integratedTerminal.
- macOS: When set to true, it will spawn an external console through
lldb-mi. When set to false, the output can be seen in VS Code’s debugConsole. Due to limitations withinlldb-mi, integratedTerminal support is not available.
avoidWindowsConsoleRedirection
In order to support VS Code’s Integrated Terminal with gdb on Windows, the extension adds console redirection commands to the debuggee’s arguments to have console input and output show up in the integrated terminal. Setting this option to true will disable it.
logging
Optional flags to determine what types of messages should be logged to the Debug Console.
- exceptions: Optional flag to determine whether exception messages should be logged to the Debug Console. Defaults to true.
- moduleLoad: Optional flag to determine whether module load events should be logged to the Debug Console. Defaults to true.
- programOutput: Optional flag to determine whether program output should be logged to the Debug Console. Defaults to true.
- engineLogging: Optional flag to determine whether diagnostic engine logs should be logged to the Debug Console. Defaults to false.
- trace: Optional flag to determine whether diagnostic adapter command tracing should be logged to the Debug Console. Defaults to false.
- traceResponse: Optional flag to determine whether diagnostic adapter command and response tracing should be logged to the Debug Console. Defaults to false.
visualizerFile
.natvis file to be used when debugging. See Create custom views of native objects for information on how to create Natvis files.
showDisplayString
When a visualizerFile is specified, showDisplayString will enable the display string. Turning on this option can cause slower performance during debugging.
Example:
{
  "name": "C++ Launch (Windows)",
  "type": "cppvsdbg",
  "request": "launch",
  "program": "C:\app1\Debug\app1.exe",
  "symbolSearchPath": "C:\Symbols;C:\SymbolDir2",
  "externalConsole": true,
  "logging": {
    "moduleLoad": false,
    "trace": true
  },
  "visualizerFile": "${workspaceFolder}/my.natvis",
  "showDisplayString": true
}
Configure the target application
The following options enable you to modify the state of the target application when it is launched:
args
JSON array of command-line arguments to pass to the program when it is launched. Example ["arg1", "arg2"]. If you are escaping characters, you will need to double escape them. For example, ["{\"arg1\": true}"] will send {"arg1": true} to your application.
cwd
Sets the working directory of the application launched by the debugger.
environment
Environment variables to add to the environment for the program. Example: [ { "name": "config", "value": "Debug" } ], not [ { "config": "Debug" } ].
Example:
{
  "name": "C++ Launch",
  "type": "cppdbg",
  "request": "launch",
  "program": "${workspaceFolder}/a.out",
  "args": ["arg1", "arg2"],
  "environment": [{ "name": "config", "value": "Debug" }],
  "cwd": "${workspaceFolder}"
}
Customizing GDB or LLDB
You can change the behavior of GDB or LLDB by setting the following options:
MIMode
Indicates the debugger that VS Code will connect to. Must be set to gdb or lldb. This is pre-configured on a per-operating system basis and can be changed as needed.
miDebuggerPath
The path to the debugger (such as gdb). When only the executable is specified, it will search the operating system’s PATH variable for a debugger (GDB on Linux and Windows, LLDB on OS X).
miDebuggerArgs
Additional arguments to pass to the debugger (such as gdb).
stopAtEntry
If set to true, the debugger should stop at the entry-point of the target (ignored on attach). Default value is false.
stopAtConnect
If set to true, the debugger should stop after connecting to the target. If set to false, the debugger will continue after connecting. Default value is false.
setupCommands
JSON array of commands to execute in order to set up the GDB or LLDB. Example: "setupCommands": [ { "text": "target-run", "description": "run target", "ignoreFailures": false }].
customLaunchSetupCommands
If provided, this replaces the default commands used to launch a target with some other commands. For example, this can be «-target-attach» in order to attach to a target process. An empty command list replaces the launch commands with nothing, which can be useful if the debugger is being provided launch options as command-line options. Example: "customLaunchSetupCommands": [ { "text": "target-run", "description": "run target", "ignoreFailures": false }].
launchCompleteCommand
The command to execute after the debugger is fully set up in order to cause the target process to run. Allowed values are «exec-run», «exec-continue», «None». The default value is «exec-run».
Example:
{
  "name": "C++ Launch",
  "type": "cppdbg",
  "request": "launch",
  "program": "${workspaceFolder}/a.out",
  "stopAtEntry": false,
  "customLaunchSetupCommands": [
    { "text": "target-run", "description": "run target", "ignoreFailures": false }
  ],
  "launchCompleteCommand": "exec-run",
  "linux": {
    "MIMode": "gdb",
    "miDebuggerPath": "/usr/bin/gdb"
  },
  "osx": {
    "MIMode": "lldb"
  },
  "windows": {
    "MIMode": "gdb",
    "miDebuggerPath": "C:\MinGw\bin\gdb.exe"
  }
}
symbolLoadInfo
- loadAll: If true, symbols for all libs will be loaded, otherwise no solib symbols will be loaded. Modified by ExceptionList. Default value is true.
- exceptionList: List of filenames (wildcards allowed) separated by semicolons
;. Modifies behavior of LoadAll. If LoadAll is true then don’t load symbols for libs that match any name in the list. Otherwise only load symbols for libs that match. Example:"foo.so;bar.so"
Debugging dump files
The C/C++ extension enables debugging dump files on Windows and core dump files Linux and OS X.
dumpPath
If you want to debug a Windows dump file, set this to the path to the dump file to start debugging in the launch configuration.
coreDumpPath
Full path to a core dump file to debug for the specified program. Set this to the path to the core dump file to start debugging in the launch configuration.
Note: core dump debugging is not supported with MinGw.
Remote debugging or debugging with a local debugger server
miDebuggerServerAddress
Network address of the debugger server (for example, gdbserver) to connect to for remote debugging (example: localhost:1234).
debugServerPath
Full path to debug server to launch.
debugServerArgs
Arguments for the debugger server.
serverStarted
Server-started pattern to look for in the debug server output. Regular expressions are supported.
filterStdout
If set to true, search stdout stream for server-started pattern and log stdout to debug output. Default value is true.
filterStderr
If set to true, search stderr stream for server-started pattern and log stderr to debug output. Default value is false.
serverLaunchTimeout
Time in milliseconds, for the debugger to wait for the debugServer to start up. Default is 10000.
pipeTransport
For information about attaching to a remote process, such as debugging a process in a Docker container, see the Pipe transport settings article.
hardwareBreakpoints
If provided, this explicitly controls hardware breakpoint behavior for remote targets. If require is set to true, always use hardware breakpoints. Default value is false. limit is an optional limit on the number of available hardware breakpoints to use which is only enforced when require is true and limit is greater than 0. Defaults value is 0. Example: "hardwareBreakpoints": { require: true, limit: 6 }.
Additional properties
processId
Defaults to ${command:pickProcess} which will display a list of available processes the debugger can attach to. We recommend that you leave this default, but the property can be explicitly set to a specific process ID for the debugger to attach to.
request
Indicates whether the configuration section is intended to launch the program or attach to an already running instance.
targetArchitecture
Deprecated This option is no longer needed as the target architecture is automatically detected.
type
Indicates the underlying debugger being used. Must be cppvsdbg when using the Visual Studio Windows debugger, and cppdbg when using GDB or LLDB. This is automatically set to the correct value when the
launch.json file is created.
sourceFileMap
This allows mapping of the compile-time paths for source to local source locations. It is an object of key/value pairs and will resolve the first string-matched path. (example: "sourceFileMap": { "/mnt/c": "c:\" } will map any path returned by the debugger that begins with /mnt/c and convert it to c:\. You can have multiple mappings in the object but they will be handled in the order provided.)
Environment variable definitions file
An environment variable definitions file is a simple text file containing key-value pairs in the form of environment_variable=value, with # used for comments. Multiline values are not supported.
The cppvsdbg debugger configuration also contains an envFile property that allows you to easily set variables for debugging purposes.
For example:
project.env file:
# project.env

# Example environment with key as 'MYENVRIONMENTPATH' and value as C:\Users\USERNAME\Project
MYENVRIONMENTPATH=C:\Users\USERNAME\Project

# Variables with spaces
SPACED_OUT_PATH="C:\This Has Spaces\Project"
Symbol Options
The symbolOptions element allows customization of how the debugger searches for symbols. Example:
    "symbolOptions": {
        "searchPaths": [
            "C:\src\MyOtherProject\bin\debug",
            "https://my-companies-symbols-server"
        ],
        "searchMicrosoftSymbolServer": true,
        "cachePath": "%TEMP%\symcache",
        "moduleFilter": {
            "mode": "loadAllButExcluded",
            "excludedModules": [ "DoNotLookForThisOne*.dll" ]
        }
    }
Properties
searchPaths: Array of symbol server URLs (example: https://msdl.microsoft.com/download/symbols) or directories (example: /build/symbols) to search for .pdb files. These directories will be searched in addition to the default locations — next to the module and the path where the pdb was originally dropped to.
searchMicrosoftSymbolServer: If true the Microsoft Symbol server (https://msdl.microsoft.com/download/symbols) is added to the symbols search path. If unspecified, this option defaults to false.
cachePath«: Directory where symbols downloaded from symbol servers should be cached. If unspecified, the debugger will default to %TEMP%SymbolCache..
moduleFilter.mode: This value is either "loadAllButExcluded" or "loadOnlyIncluded". In "loadAllButExcluded" mode, the debugger loads symbols for all modules unless the module is in the ‘excludedModules’ array. In "loadOnlyIncluded" mode, the debugger will not attempt to load symbols for ANY module unless it is in the ‘includedModules’ array, or it is included through the ‘includeSymbolsNextToModules’ setting.
Properties for "loadAllButExcluded" mode
moduleFilter.excludedModules: Array of modules that the debugger should NOT load symbols for. Wildcards (example: MyCompany.*.dll) are supported.
Properties for "loadOnlyIncluded" mode
moduleFilter.includedModules: Array of modules that the debugger should load symbols for. Wildcards (example: MyCompany.*.dll) are supported.
moduleFilter.includeSymbolsNextToModules: If true, for any module NOT in the ‘includedModules’ array, the debugger will still check next to the module itself and the launching executable, but it will not check paths on the symbol search list. This option defaults to ‘true’.
6/10/2021
| Order | Area | TOCTitle | ContentId | PageTitle | DateApproved | MetaDescription |
|---|---|---|---|---|---|---|
|
11 |
cpp |
Configure debugging |
8cb0c932-d5f2-41e7-b297-5fd100ce4e0c |
Configure launch.json for C/C++ debugging in Visual Studio Code |
6/10/2021 |
Configure launch.json for C/C++ debugging in Visual Studio Code |
Configure C/C++ debugging
A launch.json file is used to configure the debugger in Visual Studio Code.
Visual Studio Code generates a launch.json (under a .vscode folder in your project) with almost all of the required information. To get started with debugging you need to fill in the program field with the path to the executable you plan to debug. This must be specified for both the launch and attach (if you plan to attach to a running instance at any point) configurations.
The generated file contains two sections, one that configures debugging for launch and a second that configures debugging for attach.
Configure VS Code’s debugging behavior
Set or change the following options to control VS Code’s behavior during debugging:
program (required)
Specifies the full path to the executable the debugger will launch or attach to. The debugger requires this location in order to load debug symbols.
symbolSearchPath
Tells the Visual Studio Windows Debugger what paths to search for symbol (.pdb) files. Separate multiple paths with a semicolon. For example: "C:\Symbols;C:\SymbolDir2".
requireExactSource
An optional flag that tells the Visual Studio Windows Debugger to require current source code to match the pdb.
additionalSOLibSearchPath
Tells GDB or LLDB what paths to search for .so files. Separate multiple paths with a semicolon. For example: "/Users/user/dir1;/Users/user/dir2".
externalConsole
Used only when launching the debuggee. For attach, this parameter does not change the debuggee’s behavior.
- Windows: When set to true, it will spawn an external console. When set to false, it will use VS Code’s integratedTerminal.
- Linux: When set to true, it will notify VS Code to spawn an external console. When set to false, it will use VS Code’s integratedTerminal.
- macOS: When set to true, it will spawn an external console through
lldb-mi. When set to false, the output can be seen in VS Code’s debugConsole. Due to limitations withinlldb-mi, integratedTerminal support is not available.
avoidWindowsConsoleRedirection
In order to support VS Code’s Integrated Terminal with gdb on Windows, the extension adds console redirection commands to the debuggee’s arguments to have console input and output show up in the integrated terminal. Setting this option to true will disable it.
logging
Optional flags to determine what types of messages should be logged to the Debug Console.
- exceptions: Optional flag to determine whether exception messages should be logged to the Debug Console. Defaults to true.
- moduleLoad: Optional flag to determine whether module load events should be logged to the Debug Console. Defaults to true.
- programOutput: Optional flag to determine whether program output should be logged to the Debug Console. Defaults to true.
- engineLogging: Optional flag to determine whether diagnostic engine logs should be logged to the Debug Console. Defaults to false.
- trace: Optional flag to determine whether diagnostic adapter command tracing should be logged to the Debug Console. Defaults to false.
- traceResponse: Optional flag to determine whether diagnostic adapter command and response tracing should be logged to the Debug Console. Defaults to false.
visualizerFile
.natvis file to be used when debugging. See Create custom views of native objects for information on how to create Natvis files.
showDisplayString
When a visualizerFile is specified, showDisplayString will enable the display string. Turning on this option can cause slower performance during debugging.
Example:
{
   "name": "C++ Launch (Windows)",
   "type": "cppvsdbg",
   "request": "launch",
   "program": "C:\app1\Debug\app1.exe",
   "symbolSearchPath": "C:\Symbols;C:\SymbolDir2",
   "externalConsole": true,
   "logging": {
       "moduleLoad": false,
       "trace": true
    },
   "visualizerFile": "${workspaceFolder}/my.natvis",
   "showDisplayString": true
}
Configure the target application
The following options enable you to modify the state of the target application when it is launched:
args
JSON array of command-line arguments to pass to the program when it is launched. Example ["arg1", "arg2"]. If you are escaping characters, you will need to double escape them. For example, ["{\"arg1\": true}"] will send {"arg1": true} to your application.
cwd
Sets the working directory of the application launched by the debugger.
environment
Environment variables to add to the environment for the program. Example: [ { "name": "config", "value": "Debug" } ], not [ { "config": "Debug" } ].
Example:
{
   "name": "C++ Launch",
   "type": "cppdbg",
   "request": "launch",
   "program": "${workspaceFolder}/a.out",
   "args": ["arg1", "arg2"],
   "environment": [{"name": "config", "value": "Debug"}],
   "cwd": "${workspaceFolder}"
}
Customizing GDB or LLDB
You can change the behavior of GDB or LLDB by setting the following options:
MIMode
Indicates the debugger that VS Code will connect to. Must be set to gdb or lldb. This is pre-configured on a per-operating system basis and can be changed as needed.
miDebuggerPath
The path to the debugger (such as gdb). When only the executable is specified, it will search the operating system’s PATH variable for a debugger (GDB on Linux and Windows, LLDB on OS X).
miDebuggerArgs
Additional arguments to pass to the debugger (such as gdb).
stopAtEntry
If set to true, the debugger should stop at the entry-point of the target (ignored on attach). Default value is false.
stopAtConnect
If set to true, the debugger should stop after connecting to the target. If set to false, the debugger will continue after connecting. Default value is false.
setupCommands
JSON array of commands to execute in order to set up the GDB or LLDB. Example: "setupCommands": [ { "text": "target-run", "description": "run target", "ignoreFailures": false }].
customLaunchSetupCommands
If provided, this replaces the default commands used to launch a target with some other commands. For example, this can be «-target-attach» in order to attach to a target process. An empty command list replaces the launch commands with nothing, which can be useful if the debugger is being provided launch options as command-line options. Example: "customLaunchSetupCommands": [ { "text": "target-run", "description": "run target", "ignoreFailures": false }].
launchCompleteCommand
The command to execute after the debugger is fully set up in order to cause the target process to run. Allowed values are «exec-run», «exec-continue», «None». The default value is «exec-run».
Example:
{
   "name": "C++ Launch",
   "type": "cppdbg",
   "request": "launch",
   "program": "${workspaceFolder}/a.out",
   "stopAtEntry": false,
   "customLaunchSetupCommands": [
      { "text": "target-run", "description": "run target", "ignoreFailures": false }
   ],
   "launchCompleteCommand": "exec-run",
   "linux": {
      "MIMode": "gdb",
      "miDebuggerPath": "/usr/bin/gdb"
   },
   "osx": {
      "MIMode": "lldb"
   },
   "windows": {
      "MIMode": "gdb",
      "miDebuggerPath": "C:\MinGw\bin\gdb.exe"
   }
}
symbolLoadInfo
- loadAll: If true, symbols for all libs will be loaded, otherwise no solib symbols will be loaded. Modified by ExceptionList. Default value is true.
- exceptionList: List of filenames (wildcards allowed) separated by semicolons
;. Modifies behavior of LoadAll. If LoadAll is true then don’t load symbols for libs that match any name in the list. Otherwise only load symbols for libs that match. Example:"foo.so;bar.so"
Debugging dump files
The C/C++ extension enables debugging dump files on Windows and core dump files Linux and OS X.
dumpPath
If you want to debug a Windows dump file, set this to the path to the dump file to start debugging in the launch configuration.
coreDumpPath
Full path to a core dump file to debug for the specified program. Set this to the path to the core dump file to start debugging in the launch configuration.
Note: core dump debugging is not supported with MinGw.
Remote debugging or debugging with a local debugger server
miDebuggerServerAddress
Network address of the debugger server (for example, gdbserver) to connect to for remote debugging (example: localhost:1234).
debugServerPath
Full path to debug server to launch.
debugServerArgs
Arguments for the debugger server.
serverStarted
Server-started pattern to look for in the debug server output. Regular expressions are supported.
filterStdout
If set to true, search stdout stream for server-started pattern and log stdout to debug output. Default value is true.
filterStderr
If set to true, search stderr stream for server-started pattern and log stderr to debug output. Default value is false.
serverLaunchTimeout
Time in milliseconds, for the debugger to wait for the debugServer to start up. Default is 10000.
pipeTransport
For information about attaching to a remote process, such as debugging a process in a Docker container, see the Pipe transport settings article.
hardwareBreakpoints
If provided, this explicitly controls hardware breakpoint behavior for remote targets. If require is set to true, always use hardware breakpoints. Default value is false. limit is an optional limit on the number of available hardware breakpoints to use which is only enforced when require is true and limit is greater than 0. Defaults value is 0. Example: "hardwareBreakpoints": { require: true, limit: 6 }.
Additional properties
processId
Defaults to ${command:pickProcess} which will display a list of available processes the debugger can attach to. We recommend that you leave this default, but the property can be explicitly set to a specific process ID for the debugger to attach to.
request
Indicates whether the configuration section is intended to launch the program or attach to an already running instance.
targetArchitecture
Deprecated This option is no longer needed as the target architecture is automatically detected.
type
Indicates the underlying debugger being used. Must be cppvsdbg when using the Visual Studio Windows debugger, and cppdbg when using GDB or LLDB. This is automatically set to the correct value when the
launch.json file is created.
sourceFileMap
This allows mapping of the compile-time paths for source to local source locations. It is an object of key/value pairs and will resolve the first string-matched path. (example: "sourceFileMap": { "/mnt/c": "c:\" } will map any path returned by the debugger that begins with /mnt/c and convert it to c:\. You can have multiple mappings in the object but they will be handled in the order provided.)
Environment variable definitions file
An environment variable definitions file is a simple text file containing key-value pairs in the form of environment_variable=value, with # used for comments. Multiline values are not supported.
The cppvsdbg debugger configuration also contains an envFile property that allows you to easily set variables for debugging purposes.
For example:
project.env file:
# project.env

# Example environment with key as 'MYENVRIONMENTPATH' and value as C:\Users\USERNAME\Project
MYENVRIONMENTPATH=C:\Users\USERNAME\Project

# Variables with spaces
SPACED_OUT_PATH="C:\This Has Spaces\Project"
Symbol Options
The symbolOptions element allows customization of how the debugger searches for symbols. Example:
    "symbolOptions": {
        "searchPaths": [
            "C:\src\MyOtherProject\bin\debug",
            "https://my-companies-symbols-server"
        ],
        "searchMicrosoftSymbolServer": true,
        "cachePath": "%TEMP%\symcache",
        "moduleFilter": {
            "mode": "loadAllButExcluded",
            "excludedModules": [ "DoNotLookForThisOne*.dll" ]
        }
    }
Properties
searchPaths: Array of symbol server URLs (example: https://msdl.microsoft.com/download/symbols) or directories (example: /build/symbols) to search for .pdb files. These directories will be searched in addition to the default locations — next to the module and the path where the pdb was originally dropped to.
searchMicrosoftSymbolServer: If true the Microsoft Symbol server (https://msdl.microsoft.com/download/symbols) is added to the symbols search path. If unspecified, this option defaults to false.
cachePath«: Directory where symbols downloaded from symbol servers should be cached. If unspecified, the debugger will default to %TEMP%SymbolCache..
moduleFilter.mode: This value is either "loadAllButExcluded" or "loadOnlyIncluded". In "loadAllButExcluded" mode, the debugger loads symbols for all modules unless the module is in the ‘excludedModules’ array. In "loadOnlyIncluded" mode, the debugger will not attempt to load symbols for ANY module unless it is in the ‘includedModules’ array, or it is included through the ‘includeSymbolsNextToModules’ setting.
Properties for "loadAllButExcluded" mode
moduleFilter.excludedModules: Array of modules that the debugger should NOT load symbols for. Wildcards (example: MyCompany.*.dll) are supported.
Properties for "loadOnlyIncluded" mode
moduleFilter.includedModules: Array of modules that the debugger should load symbols for. Wildcards (example: MyCompany.*.dll) are supported.
moduleFilter.includeSymbolsNextToModules: If true, for any module NOT in the ‘includedModules’ array, the debugger will still check next to the module itself and the launching executable, but it will not check paths on the symbol search list. This option defaults to ‘true’.
In this article, we will discuss the VS Code setup required for break-point debugging. Firstly create a file launch.json that configures the VS Code to launch the GDB debugger at the beginning of the debugging process. Then create a file tasks.json that tells VS Code how to build (compile) the program. Finally, make some changes to the console settings and implements the build and debugging.
Program:
Let below be the code for the demonstrate purposes:
C++
#include <bits/stdc++.h>
using namespace std;
int main()
{
int a, b, pow = 1;
cin >> a >> b;
for (int i = 1; i <= b; i++) {
pow = pow * a;
}
cout << pow;
}
Launch.json
This file pertains to information like the name of the debugger, path to the debugger, current CPP file’s directory, and console regarding data. Below is the code in the file launch.json:
{
    // Use IntelliSense to learn
    // about possible attributes.
    // Hover to view descriptions
    // of existing attributes.
    // For more information, visit:
    // https://go.microsoft.com/fwlink/?linkid=830387
    "version": "0.2.0",
    "configurations": [
        {
            "name": "g++.exe - Build and debug active file",
            "type": "cppdbg",
            "request": "launch",
            "program": "${fileDirname}
              \${fileBasenameNoExtension}.exe",
              // There I have got error Property keys must be doublequotedjsonc
            "args": [],
            "stopAtEntry": false,
            "cwd": "${workspaceFolder}",
            "environment": [],
            "externalConsole": true,
            "MIMode": "gdb",
            "miDebuggerPath": "C:\MinGW\bin\gdb.exe",
            "setupCommands": [
                {
                    "description": "Enable pretty-printing for gdb",
                    "text": "-enable-pretty-printing",
                    "ignoreFailures": true
                }
            ],
            "preLaunchTask": "C/C++: g++.exe build active file"
        }
    ]
}
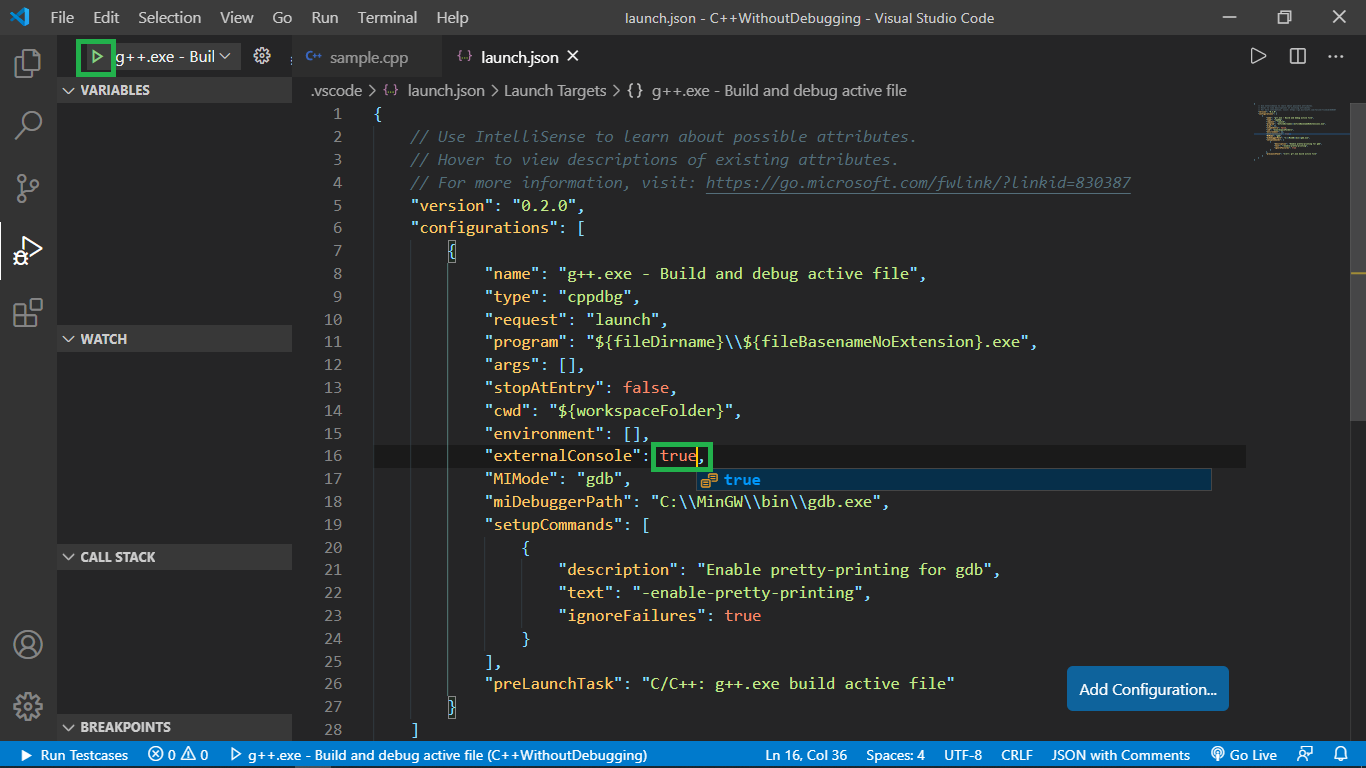
Important terms in launch.json: You can either use entirely code given above or otherwise you may use the code generated in your machine automatically. In both cases, you have to take some precautions. Firstly, make sure that the attribute “externalConsole” is marked as true (we will understand its significance later in this topic). Then check whether the property “miDebuggerPath” points to the gdb debugger correctly. Let us discuss these attributes in detail:
- name and type: These are quite self-explanatory, these refer to the name and type of launch.json.
- request: states the type of JSON file.
- program: stores the detailed address of the program for which launch.json file.
- cwd: denotes current working directory. Note that all the addresses in launch.json file are in general form, they are not specific to any file.
- externalConsole: as there is no way to handle input/output in VS Code’s integrated terminal, use an external console for this. So set it to true.
- miDebuggerPath: points to the location of debugger, this will vary from user to user.
- preLaunchTask: this contains the name of tasks.json file.
Steps:
- Go to the Run tab on the left of the screen and click on Run and Debug.
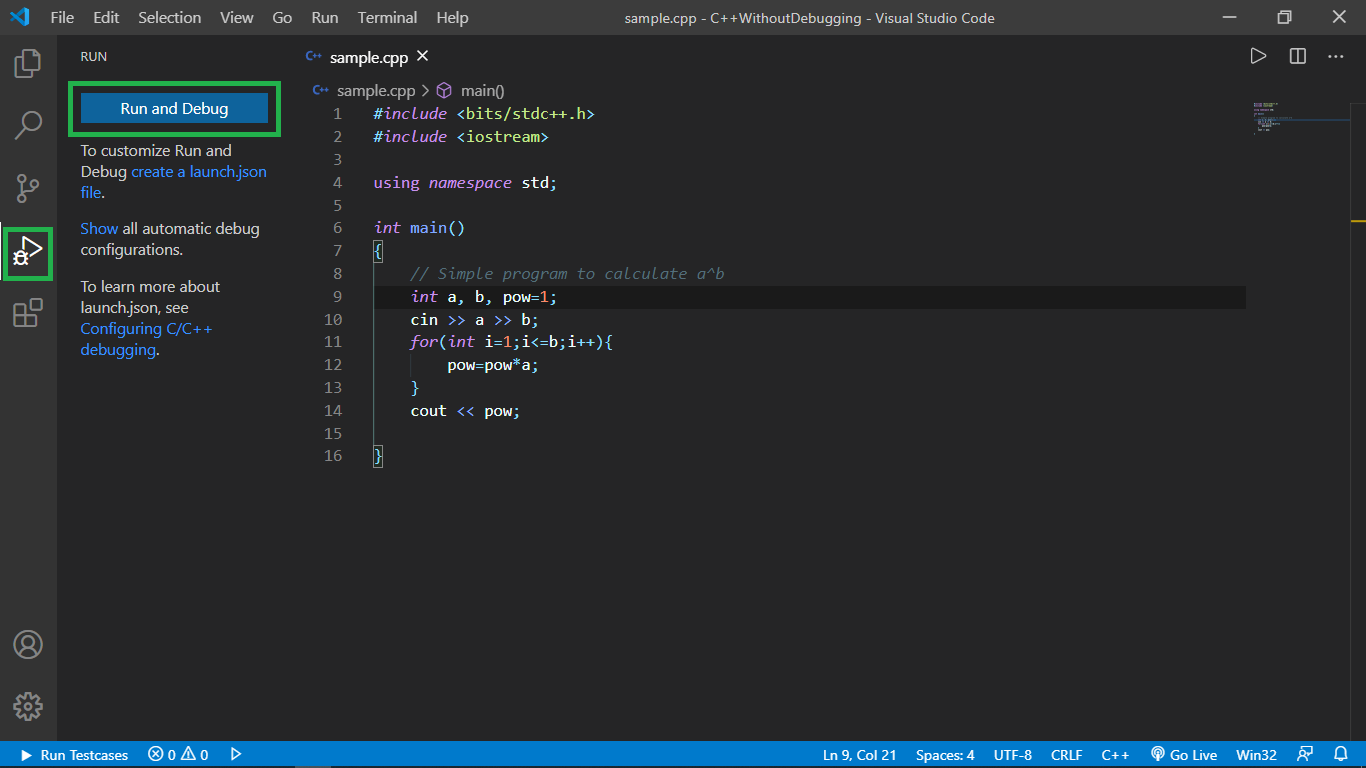
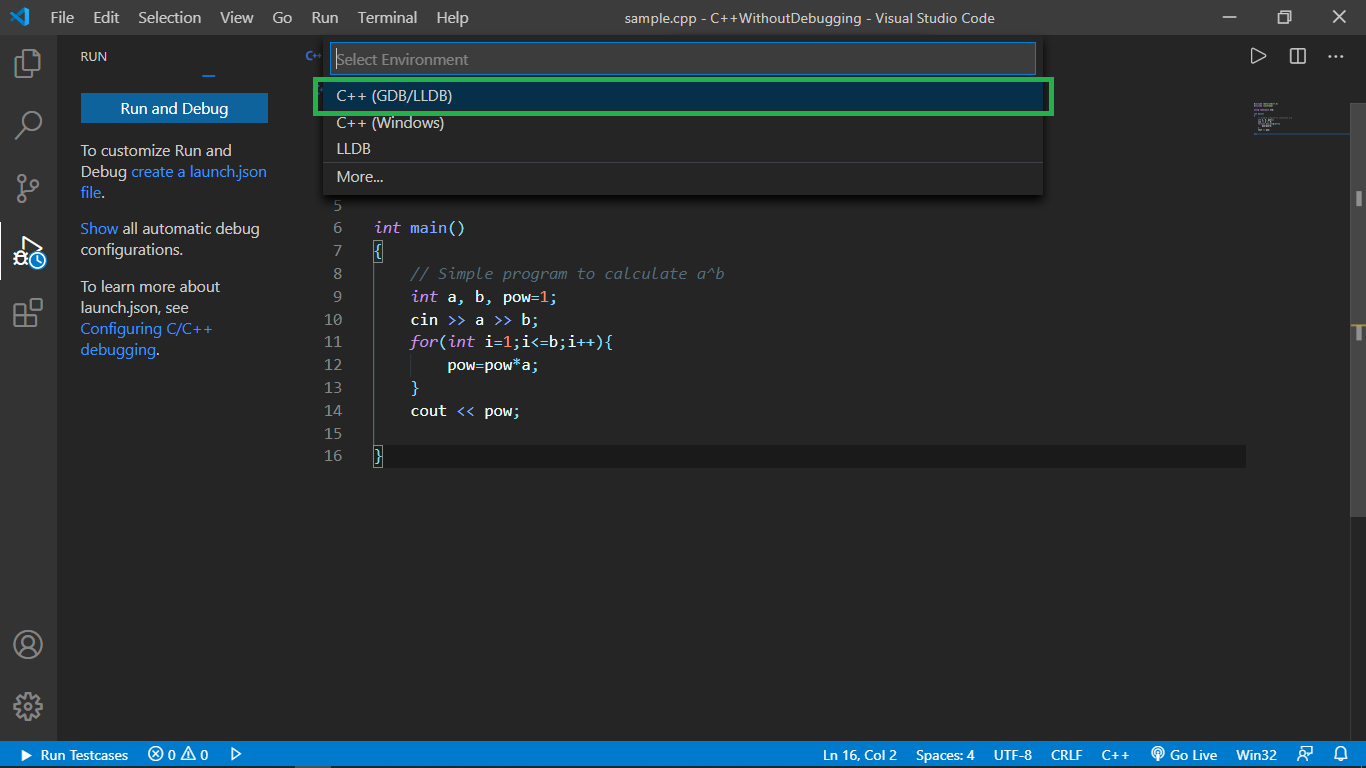
- You will be asked to choose the debugger, choose C++(GDB/LLDB). Note this option will appear only if you have MinGW installed and configured in your PC.(Refer to this article to install and configure MinGW).
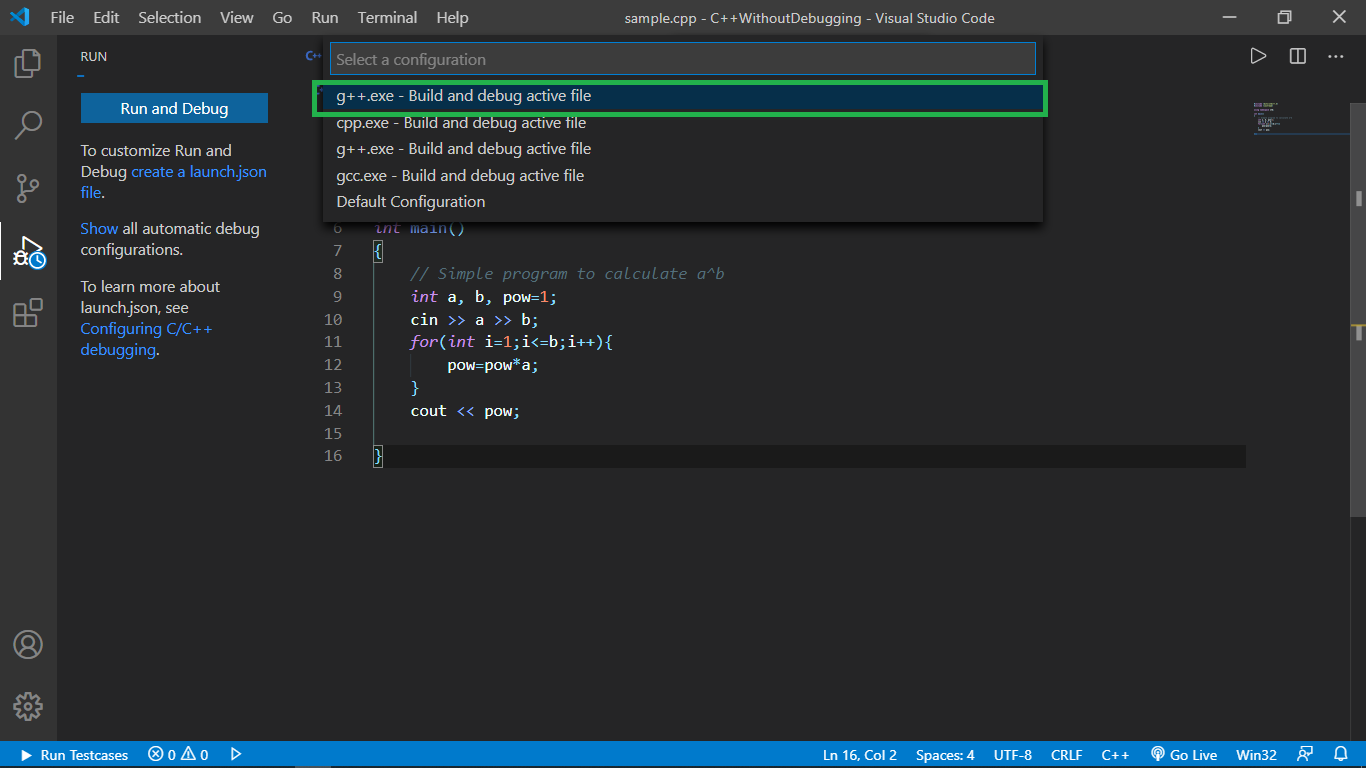
- Then choose “g++.exe – Build and debug active file”. It refers to g++ GNU C++ compiler.
- After this a Launch.json file will appear, you may either use it or the one I provided above. Again make sure the externalConsole is marked true and miDebuggerPath is set correctly.
- After this click the play button on the top left of the screen and move on to the tasks.json file.
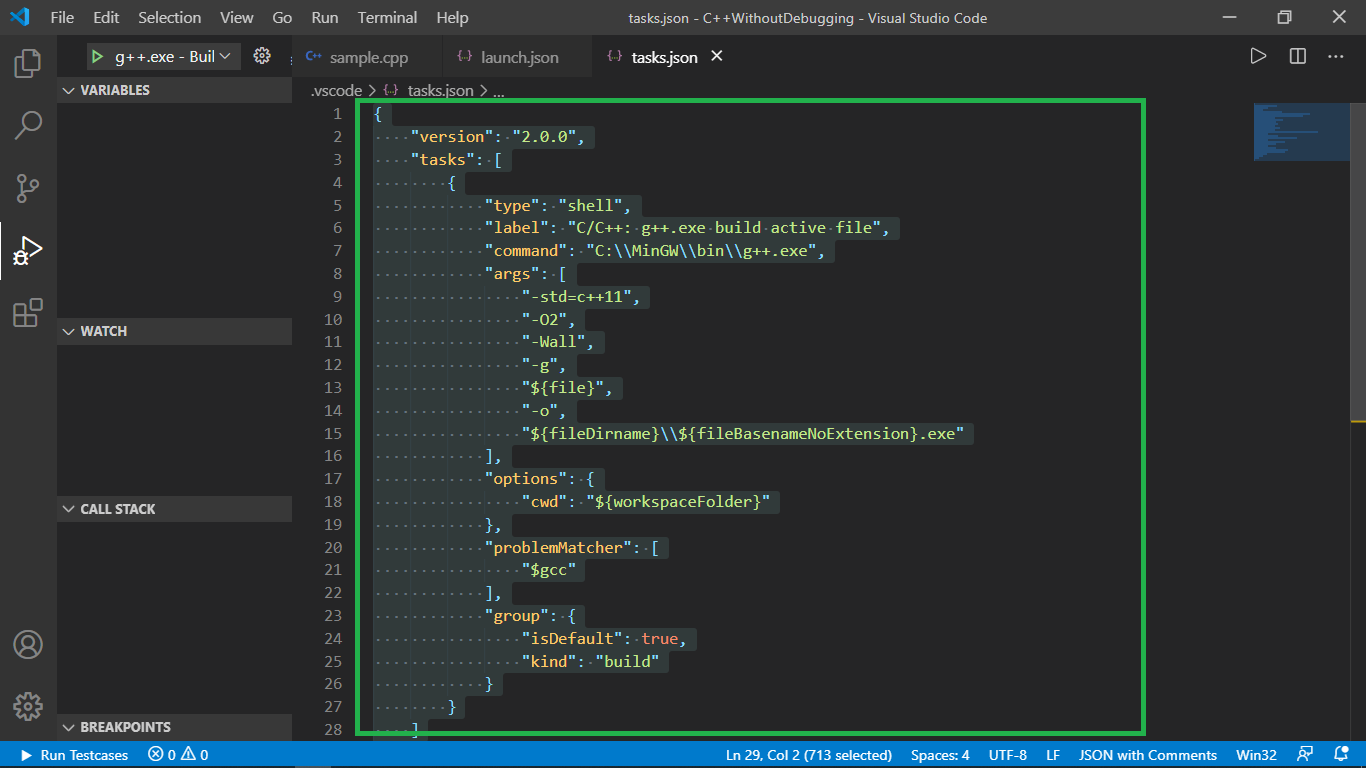
Tasks.json:
This file contains information like the commands used for compilation, the compiler’s address, the same label as in launch.json, and some other information. Below is the code in the file task.json:
{
    "version": "2.0.0",
    "tasks": [
        {
            "type": "shell",
            "label": "C/C++: g++.exe build active file",
            "command": "C:\MinGW\bin\g++.exe",
            "args": [
                "-std=c++11",
                "-O2",
                "-Wall",
                "-g",
                "${file}",
                "-o",
                "${fileDirname}
                 \ ${fileBasenameNoExtension}.exe"
            ],
            "options": {
                "cwd": "${workspaceFolder}"
            },
            "problemMatcher": [
                "$gcc"
            ],
            "group": {
                "isDefault": true,
                "kind": "build"
            }
        }
    ]
}
Important terms in task.json: The above mentioned tasks.json file can be used entirely without caution. However, the only thing to take care of is that the label of tasks.json should match with preLaunchTask of Launch.json. Let’s discuss some terms in more detail:
- label: this is unique to a tasks.json file and is used by launch.json to call tasks.json before its execution.
- command: this points to the g++ compiler application, as it will be used in compilation
- args: these arguments along with command when concatenated look like that is exactly the command we use for the compilation of CPP file and creation of the executable file as:
g++ -std=c++11 -O2 -Wall ${file} -o ${fileDirname}\${fileBasenameNoExtension}.exe
Steps:
- From the last step of launch.json we had clicked on the play button on the top left, now a dialogue box appears, which says that there is no tasks.json file in the current directory. Therefore, we need to create one, so Click on the Configure Task.

- Then click on Create tasks.json file from a template.
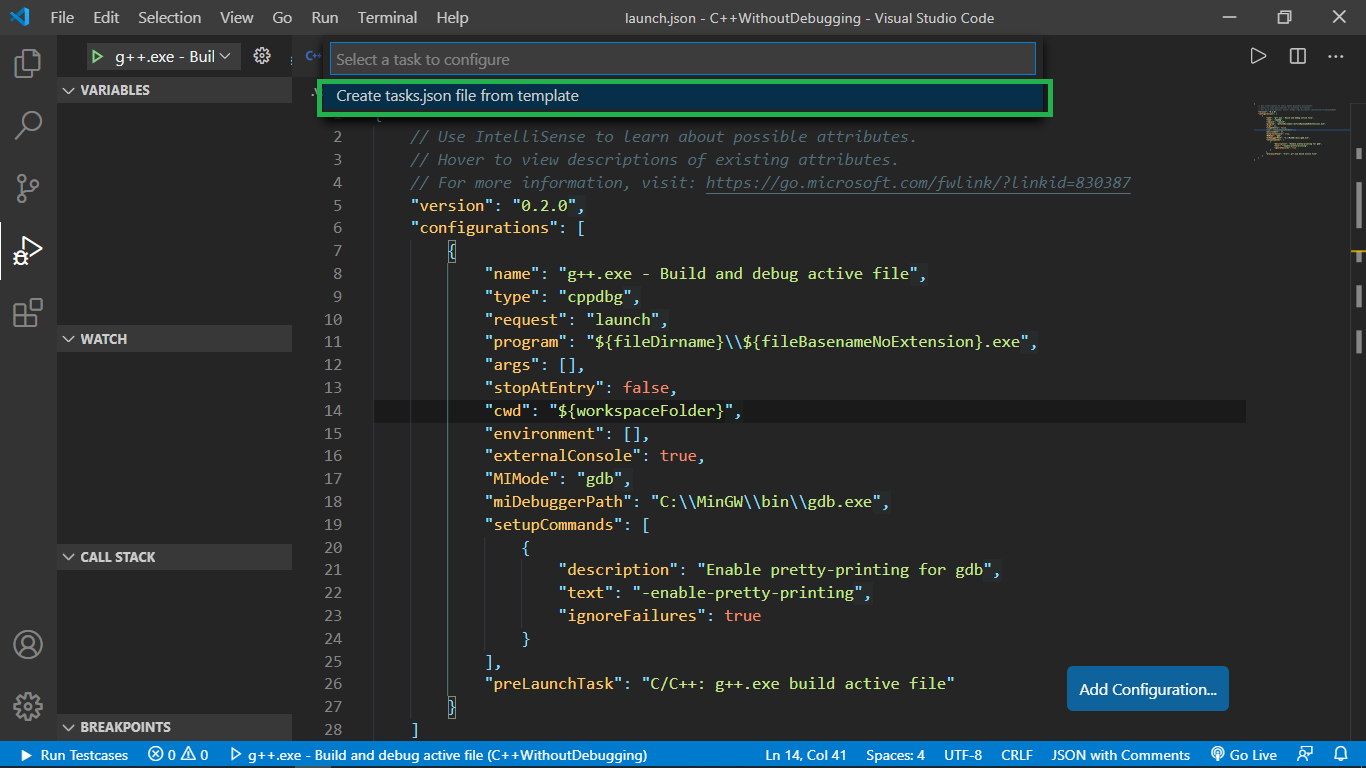
- Then Click on Others.

- Paste the code provided above in the newly created tasks.json file. Make sure to delete the existing code before doing so.
Console Adjustments
Steps:
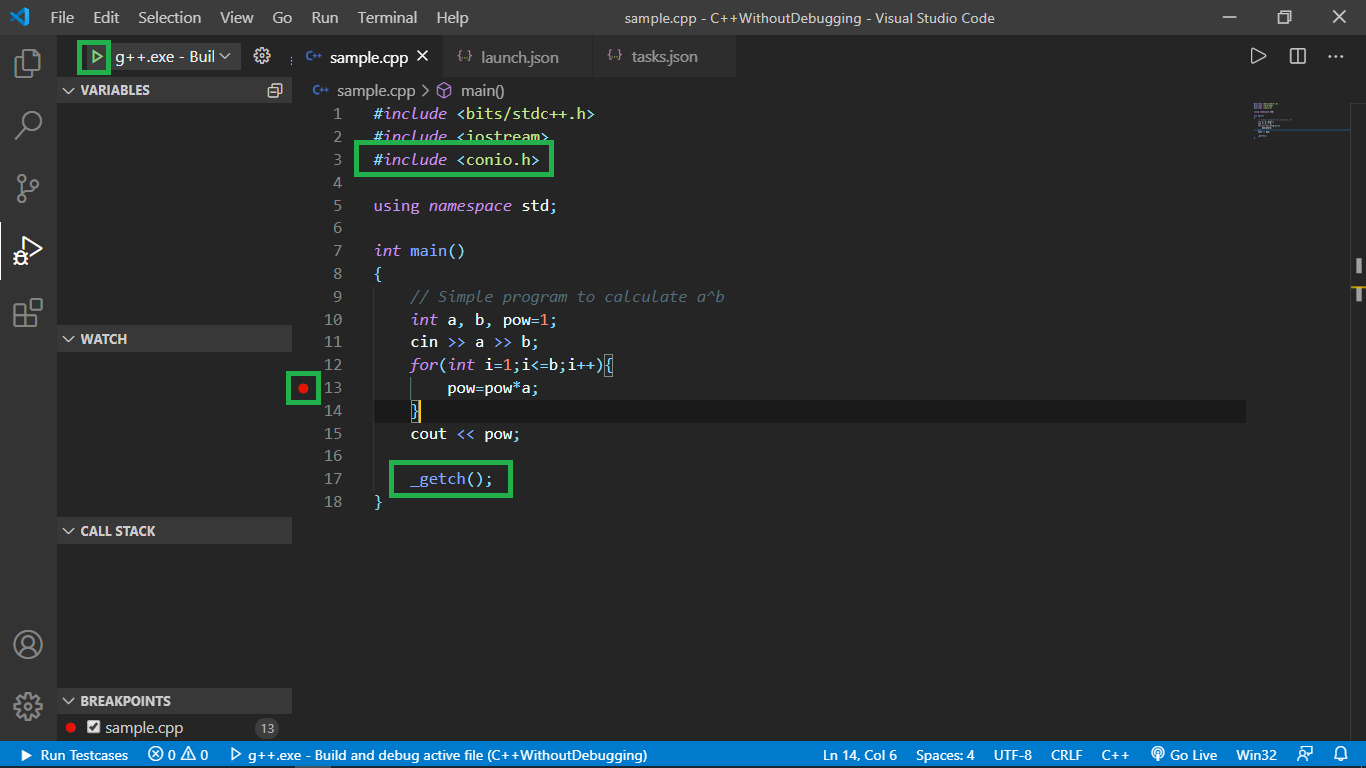
- One point that is already covered is that externalConsole in launch.json has to be true.
- Now, include conio.h header file in our program and call get-character method at last of our main() function. This will stop the command prompt from disappearing immediately after the execution completes so that we get time to examine the output until we press any character. Now the code becomes:
C++
#include <bits/stdc++.h>
#include <conio.h>
using namespace std;
int main()
{
int a, b, pow = 1;
cin >> a >> b;
for (int i = 1; i <= b; i++) {
pow = pow * a;
}
cout << pow;
_getch();
}
- Put a red break-point at some line of code that we want to examine/debug.
- Then we click on the play button on the top left of the screen to start the build.
Break-point Debugging:
Steps:
- In the appeared command prompt, we enter the required input and press enter.
- We notice that the execution begins and it pauses at the mentioned break-point.

- Now there are some options, we can either continue, step over, step into, step out-of, or restart the execution. You can do whatever you like to debug your code.
- Also, notice the value of all variables at that time of execution on the left of the screen.

- Debug as you want and as much as you want, then after the entire execution is over, go to the command prompt and notice the output there.

- After you have finished examining the output, press any key to close the command prompt.

By the end of this short guide, you’d be able to run, debug, and get IntelliSense for C/C++ files in VSCode. Though, this guide is focused on the Windows platform but can be extended to Mac and Linux with some minor changes.
I extensively used C & C++ in my competitive programming years and wanted better support for debugging & IntelliSense. The only options available were Dev-C++ (outdated) and the original «Mammoth» Visual Studio. Lately, I found VSCode and fell in love with it (first love was Atom). I tweaked it around and set it up as a complete IDE For small C, C++ projects especially geared towards competitive programming.
Create a sample C/C++ project
-
Open/Create an empty folder in VSCode.
-
Create a
new.cppfile inside it like below:#include <iostream> using namespace std; int main() { cout << "Hello World" << endl; // uncomment below line to stop cmd from exiting immediately in case of "externalConsole": true //system("pause"); return 0; } -
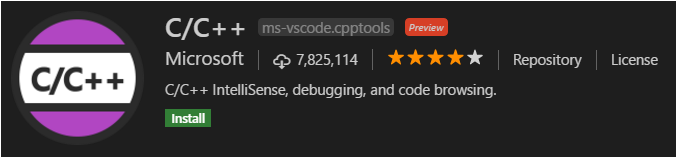
Install recommended C/C++ extension in VSCode and reload.

Official C/C++ Extension for VSCode

Install C/C++ Compiler
C/C++ extension does not include a C++ compiler. So, you will need to install one or use which is already installed on your computer.
Windows: Download MinGW64.zip (latest release) and extract it to the C Drive.
Mac: xcode
Linux: gcc
Also, Make sure to add C++ compiler PATH to environment variable of your platform. For Windows MinGW64 add: C:MinGW64bin
Run and Debug C/C++ Code
You’ll notice that there is also a .vscode folder in your sample project. To configure debug configuration, 2 files are required launch.json and tasks.json inside .vscode folder.
VSCode can create and auto-configure these files if we try to debug for the first time. To do that, open C++ file in VSCode and either hit F5 or go to Debug -> Start Debugging and select C++ (GDB/LLDB) then select g++.exe build and debug active file.


This should create 2 files launch.json and tasks.json in .vscode folder which should look like below (update the MinGW64 path if not correct)
Notice that I’ve added one more optional configuration g++ build & run active file in launch.json and g++ build & run in tasks.json file for purpose of also Running C/C++ code without debugging. Now you may choose which configuration to pick when you start debugging. You may remove the configuration whichever you won’t need.

launch.json
{
  "version": "0.2.0",
  "configurations": [
    {
      "name": "g++.exe build and debug active file",
      "type": "cppdbg",
      "request": "launch",
      "program": "${fileDirname}${fileBasenameNoExtension}.exe",
      "args": [],
      "stopAtEntry": false,
      "cwd": "${workspaceFolder}",
      "environment": [],
      "externalConsole": false, //set to true to see output in cmd instead
      "MIMode": "gdb",
      "miDebuggerPath": "C:MinGW64bingdb.exe",
      "setupCommands": [
        {
          "description": "Enable pretty-printing for gdb",
          "text": "-enable-pretty-printing",
          "ignoreFailures": true
        }
      ],
      "preLaunchTask": "g++.exe build active file"
    },
    {
      "name": "g++ build & run active file",
      "type": "cppdbg",
      "request": "launch",
      "program": "${fileDirname}${fileBasenameNoExtension}.exe",
      "args": [],
      "stopAtEntry": false,
      "cwd": "${workspaceFolder}",
      "environment": [],
      "externalConsole": false, //set to true to see output in cmd instead
      "MIMode": "gdb",
      "miDebuggerPath": "C:MinGW64bingdb.exe",
      "setupCommands": [
        {
          "description": "Enable pretty-printing for gdb",
          "text": "-enable-pretty-printing",
          "ignoreFailures": true
        }
      ],
      "preLaunchTask": "g++ build & run active file"
    }
    ]
}
tasks.json
{
  "tasks": [
    {
      "type": "shell",
      "label": "g++.exe build active file",
      "command": "C:MinGW64bing++.exe",
      "args": [
        "-g",
        "${file}",
        "-o",
        "${fileDirname}${fileBasenameNoExtension}.exe"
      ],
      "options": {
        "cwd": "C:MinGW64bin"
      }
    },
    {
      "type": "shell",
      "label": "g++ build & run active file",
      "command": "C:MinGW64bing++.exe",
      "args": [
        "${file}",
        "-o",
        "${fileDirname}${fileBasenameNoExtension}.exe"
      ],
      "options": {
        "cwd": "C:MinGW64bin"
      }
    }
  ],
  "version":"2.0.0"
}
externalConsole in launch.json can be set to true to see code output in cmd instead.
Restart VSCode to take effects of newly added compiler paths.
Open any C/C++ file, set some breakpoints (or not), and hit the Big Green Play Button.
(Shortcut to debug: F5 )

Tip: To hide *.exe files in the side explorer of VSCode, open settings and paste the below config:
"files.exclude": {
 "*.exe": true
 }
💬 Discuss on Github
That’s all, folks!
The basic problem here is that building and linking a C++ program depends heavily on the build system in use. You will need to support the following distinct tasks, using some combination of plugins and custom code:
-
General C++ language support for the editor. This is usually done using ms-vscode.cpptools, which most people expect to also handle a lot of other stuff, like build support. Let me save you some time: it doesn’t. However, you will probably want it anyway.
-
Build, clean, and rebuild tasks. This is where your choice of build system becomes a huge deal. You will find plugins for things like CMake and Autoconf (god help you), but if you’re using something like Meson and Ninja, you are going to have to write some helper scripts, and configure a custom «tasks.json» file to handle these. Microsoft has totally changed everything about that file over the last few versions, right down to what it is supposed to be called and the places (yes, placeS) it can go, to say nothing of completely changing the format. Worse, they’ve SORT OF kept backward compatibility, to be sure to use the «version» key to specify which variant you want. See details here:
https://code.visualstudio.com/docs/editor/tasks
…but note conflicts with:
https://code.visualstudio.com/docs/languages/cpp
WARNING: IN ALL OF THE ANSWERS BELOW, ANYTHING THAT BEGINS WITH A «VERSION» TAG BELOW 2.0.0 IS OBSOLETE.
Here’s the closest thing I’ve got at the moment. Note that I kick most of the heavy lifting off to scripts, this doesn’t really give me any menu entries I can live with, and there isn’t any good way to select between debug and release without just making another three explicit entries in here. With all that said, here is what I can tolerate as my .vscode/tasks.json file at the moment:
{
    // See https://go.microsoft.com/fwlink/?LinkId=733558
    // for the documentation about the tasks.json format
    "version": "2.0.0",
    "tasks": [
        {
            "label": "build project",
            "type": "shell",
            "command": "buildscripts/build-debug.sh",
            "args": [],

            "group": {
                "kind": "build",
                "isDefault": true
            },
            "presentation": {
                // Reveal the output only if unrecognized errors occur.
                "echo": true,
                "focus": false,
                "reveal": "always",
                "panel": "shared"
            },

            // Use the standard MS compiler pattern to detect errors, warnings and infos
            "options": {
                "cwd": "${workspaceRoot}"
            },
            "problemMatcher": {
                "owner": "cpp",
                "fileLocation": ["relative", "${workspaceRoot}/DEBUG"],
                "pattern": {
                    "regexp": "^(.*):(\d+):(\d+):\s+(warning|error):\s+(.*)$",
                    "file": 1,
                    "line": 2,
                    "column": 3,
                    "severity": 4,
                    "message": 5
                }
            }
        },
        {
            "label": "rebuild project",
            "type": "shell",
            "command": "buildscripts/rebuild-debug.sh",
            "args": [],
            "group": {
                "kind": "build",
                "isDefault": true
            },
            "presentation": {
                // Reveal the output only if unrecognized errors occur.
                "echo": true,
                "focus": false,
                "reveal": "always",
                "panel": "shared"
            },

            // Use the standard MS compiler pattern to detect errors, warnings and infos
            "options": {
                "cwd": "${workspaceRoot}"
            },
            "problemMatcher": {
                "owner": "cpp",
                "fileLocation": ["relative", "${workspaceRoot}/DEBUG"],
                "pattern": {
                    "regexp": "^(.*):(\d+):(\d+):\s+(warning|error):\s+(.*)$",
                    "file": 1,
                    "line": 2,
                    "column": 3,
                    "severity": 4,
                    "message": 5
                }
            }
        },
        {
            "label": "clean project",
            "type": "shell",
            "command": "buildscripts/clean-debug.sh",
            "args": [],

            "group": {
                "kind": "build",
                "isDefault": true
            },
            "presentation": {
                // Reveal the output only if unrecognized errors occur.
                "echo": true,
                "focus": false,
                "reveal": "always",
                "panel": "shared"
            },

            // Use the standard MS compiler pattern to detect errors, warnings and infos
            "options": {
                "cwd": "${workspaceRoot}"
            },
            "problemMatcher": {
                "owner": "cpp",
                "fileLocation": ["relative", "${workspaceRoot}/DEBUG"],
                "pattern": {
                    "regexp": "^(.*):(\d+):(\d+):\s+(warning|error):\s+(.*)$",
                    "file": 1,
                    "line": 2,
                    "column": 3,
                    "severity": 4,
                    "message": 5
                }
            }
        }
    ]
}
Note that, in theory, this file is supposed to work if you put it in the workspace root, so that you aren’t stuck checking files in hidden directories (.vscode) into your revision control system. I have yet to see that actually work; test it, but if it fails, put it in .vscode. Either way, the IDE will bitch if it isn’t there anyway. (Yes, at the moment, this means I have been forced to check .vscode into subversion, which I’m not happy about.) Note that my build scripts (not shown) simply create (or recreate) a DEBUG directory using, in my case, meson, and build inside it (using, in my case, ninja).
- Run, debug, attach, halt. These are another set of tasks, defined in «launch.json». Or at least they used to be. Microsoft has made such a hash of the documentation, I’m not even sure anymore.
Tutorial built with .NET 5.0
In this tutorial we’ll go through the steps to create and debug a simple .NET web application in Visual Studio Code.
Tutorial Contents
- Tools Required to Debug .NET 5.0 Web Apps
- Create Simple .NET Web App
- Generate tasks.json and launch.json
- Launch the Web App with VS Code in Debug Mode
Tools Required to Debug .NET 5.0 Web Apps
To develop, run and debug .NET 5.0 applications in VS Code you need the following installed:
- .NET SDK — includes the .NET runtime and command line tools
- Visual Studio Code — free code editor / IDE that runs on Windows, Mac and Linux
- C# extension for Visual Studio Code — adds support to VS Code for developing and debugging .NET applications
Create Simple .NET Web App
With the .NET CLI you can create a new project with the dotnet new <TEMPLATE> command, where the TEMPLATE is the type of application you want to create. To create a .NET Web App execute the command dotnet new web --name <NAME>, the NAME parameter sets the name of the .NET project and directory created, if omitted the name of the current directory is used.
The web template creates a simple Hello World .NET starter web application that contains some basic configuration and a single endpoint that returns the string "Hello World!" from the base path ("/").
For more info on the dotnet new command see https://docs.microsoft.com/en-us/dotnet/core/tools/dotnet-new.
Follow these steps to create a starter .NET web application named MyWebApp and open it in VS Code.
- Run the command
dotnet new web --name MyWebAppto create a new web app named MyWebApp - Navigate into the app directory with the command
cd MyWebApp - Open the web app in VS Code with the command
code .(or open the MyWebApp folder from the VS Code menu)
Generate tasks.json and launch.json to build and debug the .NET web app
After opening the project in VS Code you should see a popup alert from the C# extension with the message — Required assets to build and debug are missing from ‘MyWebApp’. Add them? — click Yes to automatically generate the launch.json and tasks.json files in the .vscode folder with the required configuration to build and debug the project.
Alternatively you can generate the tasks.json and launch.json files with these steps:
- Select Run and Debug on the side bar (or press Ctrl + Shift + D)
- Click create a launch.json file
- Select environment: .NET Core
What are tasks.json and launch.json?
The tasks.json file contains configuration for tasks that can be executed for the project by VS Code (e.g. build, publish, watch etc), for more info see https://code.visualstudio.com/docs/editor/tasks.
The launch.json file contains debugging config and setup details for the project, for more info see https://code.visualstudio.com/docs/editor/debugging#_launch-configurations.
The generated files allow VS Code to build and launch the .NET Web App in debug mode.
Generated VS Code tasks.json file
Your generated tasks.json configuration should look something like this, the build task is executed each time you launch the app in debug mode.
{
    "version": "2.0.0",
    "tasks": [
        {
            "label": "build",
            "command": "dotnet",
            "type": "process",
            "args": [
                "build",
                "${workspaceFolder}/MyWebApp.csproj",
                "/property:GenerateFullPaths=true",
                "/consoleloggerparameters:NoSummary"
            ],
            "problemMatcher": "$msCompile"
        },
        {
            "label": "publish",
            "command": "dotnet",
            "type": "process",
            "args": [
                "publish",
                "${workspaceFolder}/MyWebApp.csproj",
                "/property:GenerateFullPaths=true",
                "/consoleloggerparameters:NoSummary"
            ],
            "problemMatcher": "$msCompile"
        },
        {
            "label": "watch",
            "command": "dotnet",
            "type": "process",
            "args": [
                "watch",
                "run",
                "${workspaceFolder}/MyWebApp.csproj",
                "/property:GenerateFullPaths=true",
                "/consoleloggerparameters:NoSummary"
            ],
            "problemMatcher": "$msCompile"
        }
    ]
}
Generated VS Code launch.json file
Your generated launch.json configuration should look something like this, the first configuration (.NET Core Launch (web)) is used to launch the web app in debug mode.
{
    // Use IntelliSense to learn about possible attributes.
    // Hover to view descriptions of existing attributes.
    // For more information, visit: https://go.microsoft.com/fwlink/?linkid=830387
    "version": "0.2.0",
    "configurations": [
        {
            "name": ".NET Core Launch (web)",
            "type": "coreclr",
            "request": "launch",
            "preLaunchTask": "build",
            "program": "${workspaceFolder}/bin/Debug/net5.0/MyWebApp.dll",
            "args": [],
            "cwd": "${workspaceFolder}",
            "stopAtEntry": false,
            "serverReadyAction": {
                "action": "openExternally",
                "pattern": "\bNow listening on:\s+(https?://\S+)"
            },
            "env": {
                "ASPNETCORE_ENVIRONMENT": "Development"
            },
            "sourceFileMap": {
                "/Views": "${workspaceFolder}/Views"
            }
        },
        {
            "name": ".NET Core Attach",
            "type": "coreclr",
            "request": "attach"
        }
    ]
}
Launch the Web App with VS Code in Debug Mode
The C# project is now setup and ready for debugging in VS Code.
Follow these steps to add a breakpoint and launch the web app in debug mode.
- Open
Startup.csand add a breakpoint inside the root endpoint handler (await context.Response.WriteAsync("Hello World!");) by clicking just to the left of the line number, a red dot should appear for the breakpoint. - Launch the app in debug mode by selecting Run -> Start Debugging (or by pressing F5).
- A new browser window should launch to the address
https://localhost:5001/with execution paused on the breakpoint you just set. - Switch back to VS Code to inspect and debug the paused .NET code.
- Continue execution by selecting the triangle (play) icon at the top of the window (or by pressing F5).
- Switch back to the browser and it should now display the response text from the endpoint (Hello World!).
Subscribe to my YouTube channel or follow me on Twitter, Facebook or GitHub to be notified when I post new content.
I’m currently attempting to travel around Australia by motorcycle with my wife Tina on a pair of Royal Enfield Himalayans. You can follow our adventures on YouTube, Instagram and Facebook.
When you have competitive programming on LeetCode, Hackerrank, … the first thing you want is the IDE has some interesting features such as light-weight, the fast configuration, … But before, I find it difficult to have the marvelous IDE.
After spending so much time to search information about debuging, I think the Visual Studio Code is the best editor with external build tools. But using the Visual Studio Code to build source code is burdensome.
First of all, Visual Studio Code supports the compiler, debugger, intellisence mode. In this article, we will find out all of information about compiler, debugger in Vs Code.
Table of Contents
- 1. Debugger Extension
- 2. Build source code
- 3. Debug source code
- 4. Summarize
1. Debugger Extension
The first thing to do is to install the Microsoft C/C++ extension. It is used to debug our source code.
- Open Vs Code.
- Click the Extension view icon on the SideBar.
- Search for C++.
- Click Install, then click Reload.
2. Build source code
In Visual Studio Code, you have to make the task.json file.
- Open the Command Palette (Ctrl + Shift + P).
- Selects the Tasks: Configure Tasks … command, click Create tasks.json file from templates, and you see a list of task runner templates.
- Select Others to create a task which runs an external command.
- Change the command to the command line expression you use to build your application.
- Add any required args.
- Change the label to be more descriptive.
After that, the followings are the code to build C++ code on Windows platform based on cl.exe of Visual C++.
{
    "version": "2.0.0",
    "echoCommand": true,
    "tasks": [
        {
            "label": "compile hello",
            "command": "cmd",
            "type": "process",
            "args": [
                "/C %vcvarsall% && cl /Od /Zi /EHsc /Fd:%outpath%/vc141.pdb /Fo:%outpath%/%TargetName%.obj ./main.cpp /link /OUT:%outpath%/%TargetName%.%TargetExt% /PDB:%outpath%/%TargetName%.pdb",
            ],
            "group": {
                "kind": "build",
                "isDefault": true
            },
            "presentation": {
                "reveal": "always",
                "panel": "new"
            }
        }
    ],
    "options": {
        "env": {
            "outpath": "out",
            "TargetName": "hello",
            "TargetExt": "exe",
            "vcvarsall": ""C:\Program Files (x86)\Microsoft Visual Studio 14.0\VC\vcvarsall.bat" x64",
        }
    }
}
Now, we will go to find the meaning of the above keys:
- label: The task’s label used in the user interface.
- type: The task’s type. For a custom task, this can either be shell or process. If shell is specified, the command is interpreted as a shell command (Ex: bash, cmd, or PowerShell). If process is specified, the command is interpreted as a process to execute.
- command: The actual command to execute.
- windows: Any Windows specific properties.Will be used instead of the default properties when the command is executed on the Windows operating system.
- group: Defines to which group the task belongs. If you’d like to be able to build your application with Tasks: Run Build Task (Ctrl + Shift + B), you can add it to the build group.
- presentation: Defines how the task output is handled in the user interface. In this example, the Integral Terminal showing, the output is always revealed and a new terminal is created on every task run.
- options: Override the defaults for cwd, env, or shell. Options can be set per task but also globally or per platform.
Refer: Schema for tasks.json
If you have multiple tasks or multiple project that is need to build, we will use the compound tasks.
For example:
{
    "version": "2.0.0",
    "tasks": [
        {
            "label": "Client Build",
            "command": "gulp",
            "args": ["build"],
            "options": {
                "cwd": "${workspaceRoot}/client"
            }
        },
        {
            "label": "Server Build",
            "command": "gulp",
            "args": ["build"],
            "options": {
                "cwd": "${workspaceRoot}/server"
            }
        },
        {
            "label": "Build",
            "dependsOn": ["Client Build", "Server Build"]
        }
    ]
}
When you see the vcvarsall.bat, you will ask for yourself: “What is vcvarsall.bat?”.
vcvarsall.bat is Visual Studio Command Prompt tool in Visual Studio. It’s the tool that allows you to set varius options for the IDE as well as build, debug, and deploy projects from the command line.
More information about vcvarall.bat: Using vcvarall.bat in a Command Prompt window
3. Debug source code
To enable debugging, you will need to generate a launch.json file:
- Naviagate to the Debug view by clicking the Debug icon in the SideBar.
- In the Debug view, click the Configure icon.
- Select C++ (GDB/LLDB) (to use GDB or LLDB) or C++ (Windows) (to use the Visual Studio Windows Debugger) from the Select Environment dropdown. This creates a launch.json file for editing with two configurations:
- C++ Launch defines the properties for launching your application when you start debugging.
- C++ Attach defines the properties for attaching to a process that’s already running.
- Update the program property with the path to the program which you are debugging.
- If you want your application to build when you start debugging, add a preLaunchTask property with the name of the build task you created in tasks.json. (Ex: “compile hello”)
Then, the followings are the code to configure the launch.json file to debug our C++ source code based on Visual Studio.
{
    "version": "0.2.0",
    "configurations": [
        {
            "name": "(Windows) Launch",
            "type": "cppvsdbg",
            "request": "launch",
            "program": "out/hello.exe",
            "args": [],
            "stopAtEntry": false,
            "cwd": "${workspaceFolder}",
            "environment": [],
            "externalConsole": true,
            "preLaunchTask": "compile hello"
        }
    ]
}
Here are the meaning of some options for the launch.json file.
- name: The name of this work.
- type: Indicates the underlying debugger being used. Must be cppvsdbg when using the Visual Studio Windows debugger, and cppdbg when using GDB or LLDB. This is automatically set to the correct value when the launch.json file is created.
- request: Indicates whether the configuration sections is intended to launch the program or attach to an already running instance.
- program: full path to executable the debugger will launch or attach to.
- args: JSON array of command line arguments to pass to the program when it is launched. Example [“arg1”, “arg2”]. If you are escaping characters you will need to double escape them. For example [”{«arg»: true}] will send {“arg1”: true} to your application.
- stopAtEntry: If set to true, the debugger should stop at the entry point of the target (ignored the attach). Default is false.
- cwd: Sets the working directory of the application launched by the debugger.
- environment: Environment variables to add to the environment for the program. (refer to the setting of tasks.json file)
- externalConsole: If set to true, launches an external console for the application. If false, no console is lauched and VS code’s debugging console is used.
If you want to know about the options in launch.json file, you can read the site: Configuring launch.json for C/C++ debugging
4. Summarize
The above information, you can learn to configure to build and debug C++ source code.
The another way you can squeeze them into one file: tasks.json.
{
    "version": "2.0.0",
    "tasks": [
        {
            "label": "debug",
            "type": "shell",
            "command": "",
            "args": [
                "g++",
                "-g",
                "${relativeFile}",
                "-o",
                "a.out"
            ],
            "problemMatcher": [
                "$gcc"
            ]
        },
        {
            "label": "Compile and run",
            "type": "shell",
            "command": "",
            "args": [
                "g++",
                "-g",
                "${relativeFile}",
                "-o",
                "${fileBasenameNoExtension}.out",
                "&&",
                "clear",
                "&&",
                "./${fileBasenameNoExtension}.out"
            ],
            "group": {
                "kind": "build",
                "isDefault": true
            },
            "problemMatcher": {
                "owner": "cpp",
                "fileLocation": [
                    "relative",
                    "${workspaceRoot}"
                ],
                "pattern": {
                    "regexp": "^(.*):(\d+):(\d+):\s+(warning|error):\s+(.*)$",
                    "file": 1,
                    "line": 2,
                    "column": 3,
                    "severity": 4,
                    "message": 5
                }
            }
        }
    ]
}
Thanks for your reading.
Refer:
How can i compile C++ files through Visual Studio Code
Integrate with External Tools via Tasks
C/C++ for Visual Studio Code (Preview)
Configure c_cpp_properties.json
Configure launch.json
Customizing Default Settings
Configure IntelliSense Engine for includePath and browse.path
Configuring includePath for better IntelliSense results
C/C++ extension for Visual Studio Code
How do I setup VS code to compile C code
Using Visual Studio Code and Building and Debugging with C++ on Mac OS X
Schemas for tasks.json