![]() Во всех версиях Windows присутствует универсальный инструмент для сбора информации по загруженности оборудования системы — Системный монитор Windows (Windows Performance Monitor). Он представляет собой оснастку консоли управления (MMC), с помощью которой пользователь может в реальном времени осуществлять контроль над производительностью приложений и оборудования, выбирать данные, которые будут сохраняться в файлах журналов, задавать пороговые значения для оповещений и автоматических действий, генерировать отчеты и просматривать историю производительности системы, используя различные способы сортировки.
Во всех версиях Windows присутствует универсальный инструмент для сбора информации по загруженности оборудования системы — Системный монитор Windows (Windows Performance Monitor). Он представляет собой оснастку консоли управления (MMC), с помощью которой пользователь может в реальном времени осуществлять контроль над производительностью приложений и оборудования, выбирать данные, которые будут сохраняться в файлах журналов, задавать пороговые значения для оповещений и автоматических действий, генерировать отчеты и просматривать историю производительности системы, используя различные способы сортировки.
В данной статье я подробно рассмотрю процедуры запуска и настройки системного монитора Windows.
0. Оглавление
- Запуск системного монитора Windows
- Работа с системным монитором
- Настройка системного монитора
- Запись данных системного монитора в файл
1. Запуск системного монитора Windows
В Windows Server 2012 запустить системный монитор можно из Диспетчера серверов (Server Manager) в меню «Средства» (Tools) — «Системный монитор» (Performance Monitor)

В Windows Server 2008 также данную оснастку можно найти в Диспетчере сервера (Server Manager) в группе «Диагностика» (Diagnostics) — «Производительность» (Performance).

А также в меню «Пуск» (Start) — «Администрирование» (Administrative Tools) — «Системный монитор» (Performance Monitor)

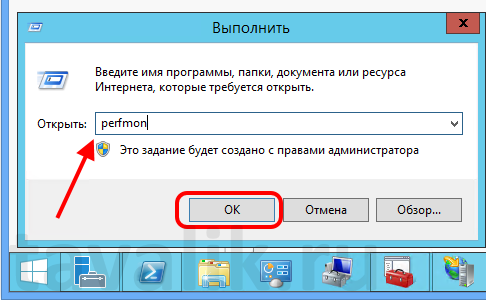
Также, в любой редакции Windows запустить Системный монитор можно выполнив команду perfmon (меню «Пуск» (Start) — «Выполнить» (Run))
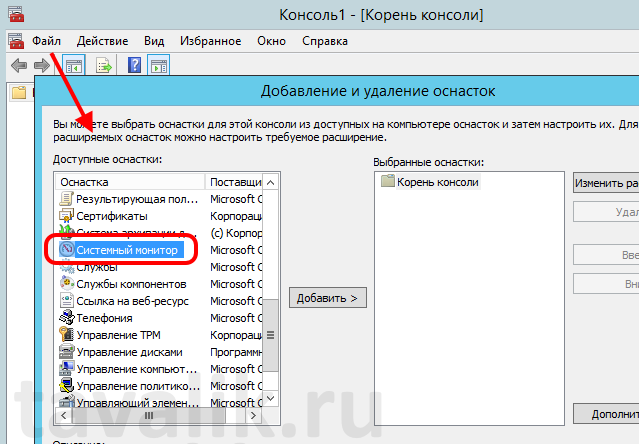
Ну и как любая другая, данная оснастка доступна в консоли управления оснастками (меню «Пуск» (Start) — «Выполнить» (Run) — «MMC»)
Пользователи, являющиеся членами группы «Пользователи» (Users) могут открывать журналы для просмотра в мониторе производительности, а также могут изменять свойства отображения монитором производительности данных истории во время просмотра.
Члены группы «Пользователи монитора производительности» (Performance Monitor Users) могут выполнять все действия, доступные членам группы «Пользователи» (Users), а также могут в реальном времени просматривать данные в мониторе производительности и изменять свойства отображения монитором производительности данных во время просмотра в реальном времени.
Участники локальной группы «Администраторы» (Administrators) (или аналогичной) могут использовать все компоненты системного монитора Windows.
2. Работа с системным монитором
Как и другие оснастки Windows, системный монитор состоит из трех окон: окна с деревом консоли (можно скрыть / показать с помощью соответствующей кнопки на панели), информационного окна и панели действий (также можно скрыть / показать с помощью кнопки на панели, по умолчанию скрыта).

При открытии в дереве консоли активна вкладка «Системный монитор» (Performance Monitor), а в информационном окне можно сразу увидеть информацию по предустановленным счетчикам, выводимую в виде графиков в реальном времени.
Список выводимых счетчиков расположен сразу под самим графиком.

Можно включить / отключить отображение того или иного счетчика установив или сняв соответствующий флажок в таблице. Там же можно настроить цвет, масштаб и стиль графика для каждого из счетчиков. Наиболее интересующий в данный момент счетчик возможно выделить жирным черным цветом, отметив его в таблице и нажав на кнопку «Выделить» (Highlight), расположенную на панели над графиком.
Также, выделив счетчик в списке, можно увидеть длительность (Duration), максимум (Maximum), минимум (Minimum), среднее (Average) и последнее (Last) значение показателя для данного счетчика производительности.

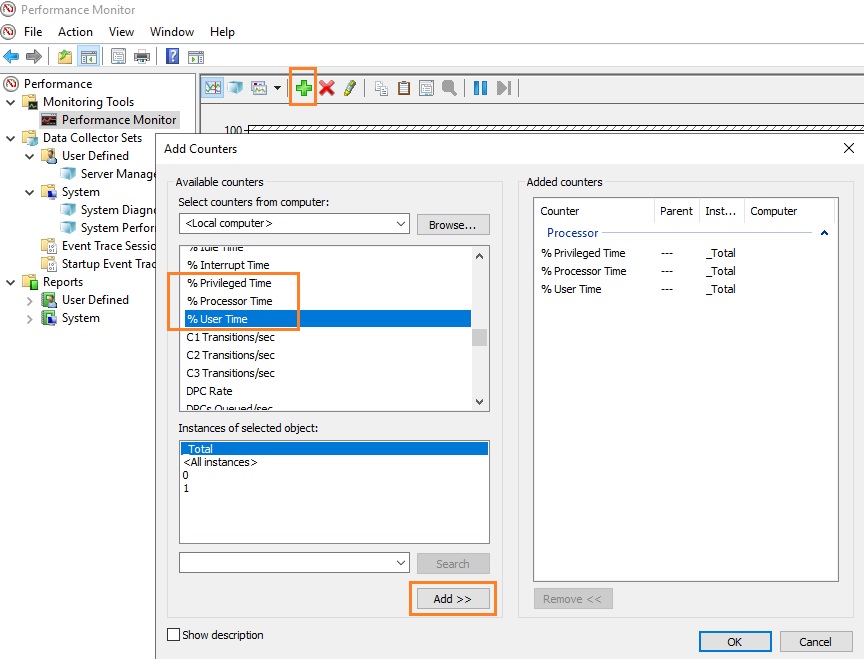
На той же панели расположены и кнопки, с помощью которых можно удалить или добавить новый счетчик для отображения. Нажав на кнопку «Добавить» (Add) откроется окно со списком имеющихся счетчиков. Их очень много. Для удобства все счетчики сгруппированы по типу оборудования или ПО. Обратите внимание, что можно добавлять как счетчики текущего компьютера, так и компьютеров сети (при наличии соответствующих прав).
Для некоторых счетчиков возможно выбрать конкретный экземпляр объекта. Например, при добавлении счетчика «Средняя длина очереди диска» (Avg. Disk Queue Length) можно выбрать диск, для которого будет собираться статистика. Выбрав необходимый счетчики (или конкретный экземпляр объекта для счетчика) следует перенести его в таблицу «Добавленные счетчики» (Added Counters) с помощью кнопки «Добавить» (Add). А при помощи соответствующего флажка, для каждого счетчика можно вывести также и его короткое описание.
Добавив все необходимые счетчики, нажимаем «ОК».

После чего счетчики сразу появятся в списке выводимых показателей.

Данные по счетчикам производительности можно выводить не только в виде графика (Line), но и в виде линейчатой гистограммы (Histogram Bar) или тестового отчета (Report). Тип диаграммы меняется с помощью соответствующей кнопке на панели.

3. Настройка системного монитора
Все вышеописанные и другие настройки доступны в окне настроек системного монитора, которое можно вызвать с помощью соответствующих кнопок на панели задач.
На вкладке «Общие» (General) можно выбрать отображаемые элементы (Display elements), значения показателей счетчиков (Report and histogram data), которые будут выводиться в графике, длительность (Duration) и интервалы (Sample every) съема показателей.

На вкладках «График» (Graph) и «Оформление» (Appearance) можно настроить тип (View), внешний вид и прочие параметры отображения графика.

На вкладке «Данные» (Data) можно добавить, удалить или настроить вид отображения конкретного счетчика производительности.
А на вкладке «Источник» (Source) можно выбрать источник отображения данных. По умолчанию это текущая активность, но возможно выбрать и ранее записанный файл журнала системного монитора.

4. Запись данных системного монитора в файл
Просматривать информацию по текущей загрузке оборудования в реальном времени конечно полезно, но чаще необходимо анализировать показания счетчиков производительности в течении определенного периода времени. Делается это с помощью Сборщиков данных (Data Collector), которые записывают показания выбранных счетчиков в файл журнала системного монитора, а затем уже администратор просматривает полученную таким образом информацию в системном мониторе.
О том, как настраиваются сборщики данных для системного монитора читайте в статье «Системный монитор Windows (Performance Monitor): сборщики данных загруженности оборудования системы».

В данной статье рассказано о средствах Windows, помогающих установить причину почему тормозит сервер. В статье рассмотрена операционная система Windows Server 2012 R2 — одна из самых популярных у VDS / VPS хостинг провайдеров.
При поиске причины тормозов сервера очень важно найти непосредственно процесс который создает наибольшую нагрузку на систему. В этом может оказать неоценимую помощь приложение perfmon которое входит в состав ОС Windows. Наибольший интерес для новичков будет представлять окно Resource Monitor.
Запуск Resource Monitor под Windows Server
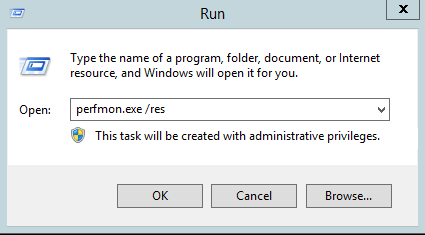
Наиболее простой способ запуска это в окне Run (команда Win + R) набрать комманду perfmon /res.
Альтернативный вариант — в окне Task Manager (открывается комбинацией клавиш Ctrl-Shift-Esc) перейти на вкладку Peformance и внизу вкладки нажать на ссылку Open Resource Monitor.
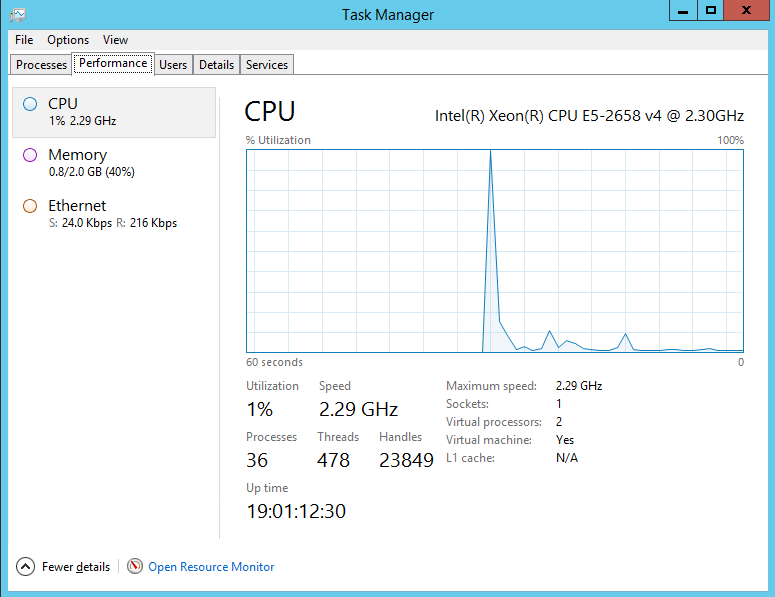
Вкладка Performance дает общую информацию о системе, которая может быть также полезна. Можно понять загрузка какого ресурса близка к 100%: памяти, CPU или локальной сети.
Использование Resource Monitor для поиска причины почему тормозит сервер.
Очень часто поиск причины тормозов сервера начинают с проверки загруженности дисковой системы. Ниже представлено окно Resource Monitor на вкладе Disk.
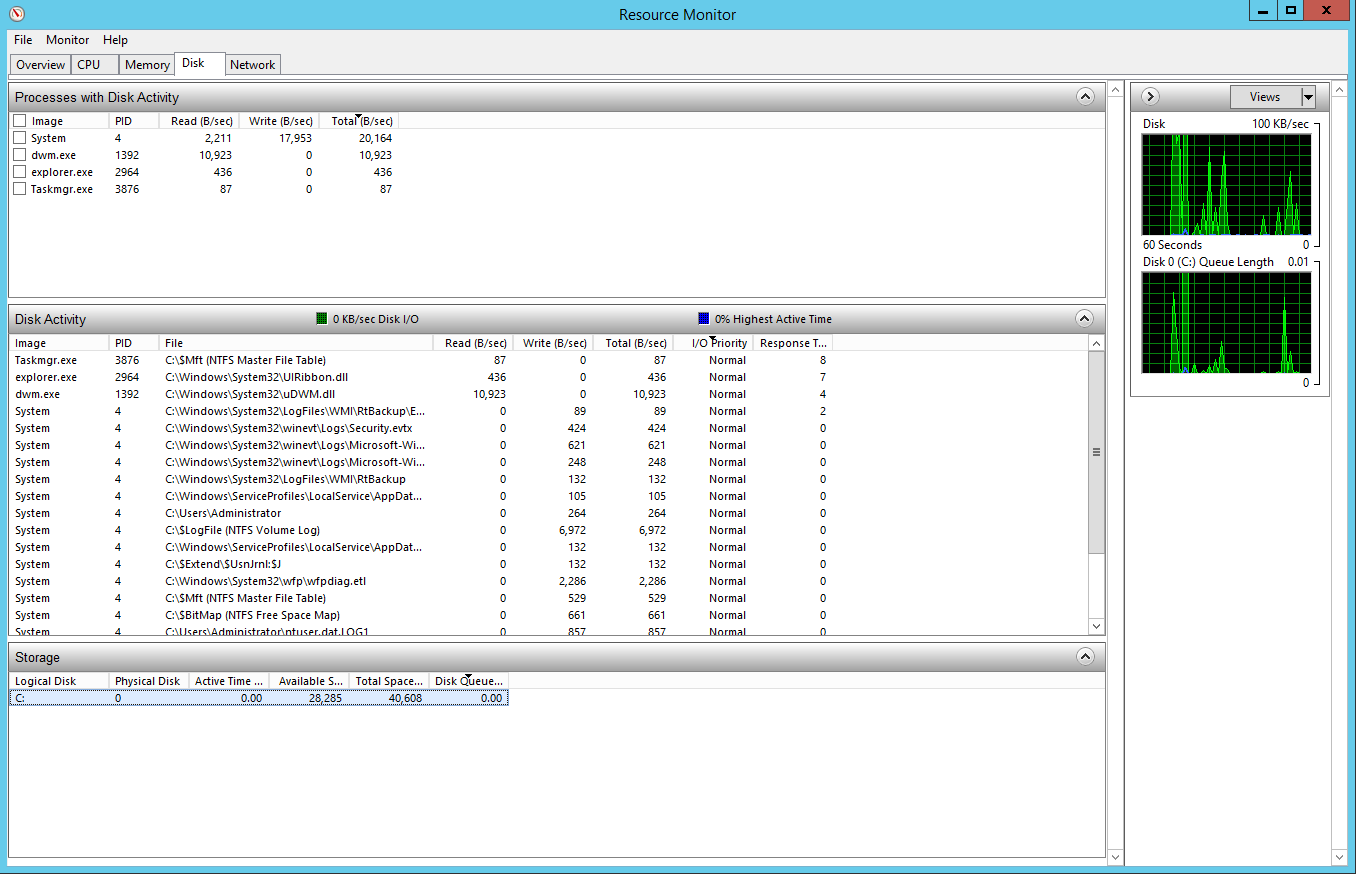
На вкладке Disk Activity показана загруженность в процентах. Если загрузка, близка к 100%, то скорее всего дисковая система является причиной низкой производительности системы. Щелкая по заголовку Total (B / Sec) можно отсортировать файлы с которыми в данный момент роботает система по объему чтетния и записи на диск. Наиболее загруженный файл и будет причиной тормозов системы. Зная какой файл создает высокую нагрузку гораздо легче понять, какой процесс нагружает систему. Если это какой-то системный файл начинающийся с C:/Windows, то есть смысл воспользоваться поисковой системой, чтобы понять, какой системной службе принадлежит данный файл.
Следущей причиной может стать Сетевая нагрузка. Особенно это актуально для VPS серверов. В случае если вы подключаетесь по RDP то сетевый задержки могут ощущаться как тормоза сервера. Переходим на вкладку Network:
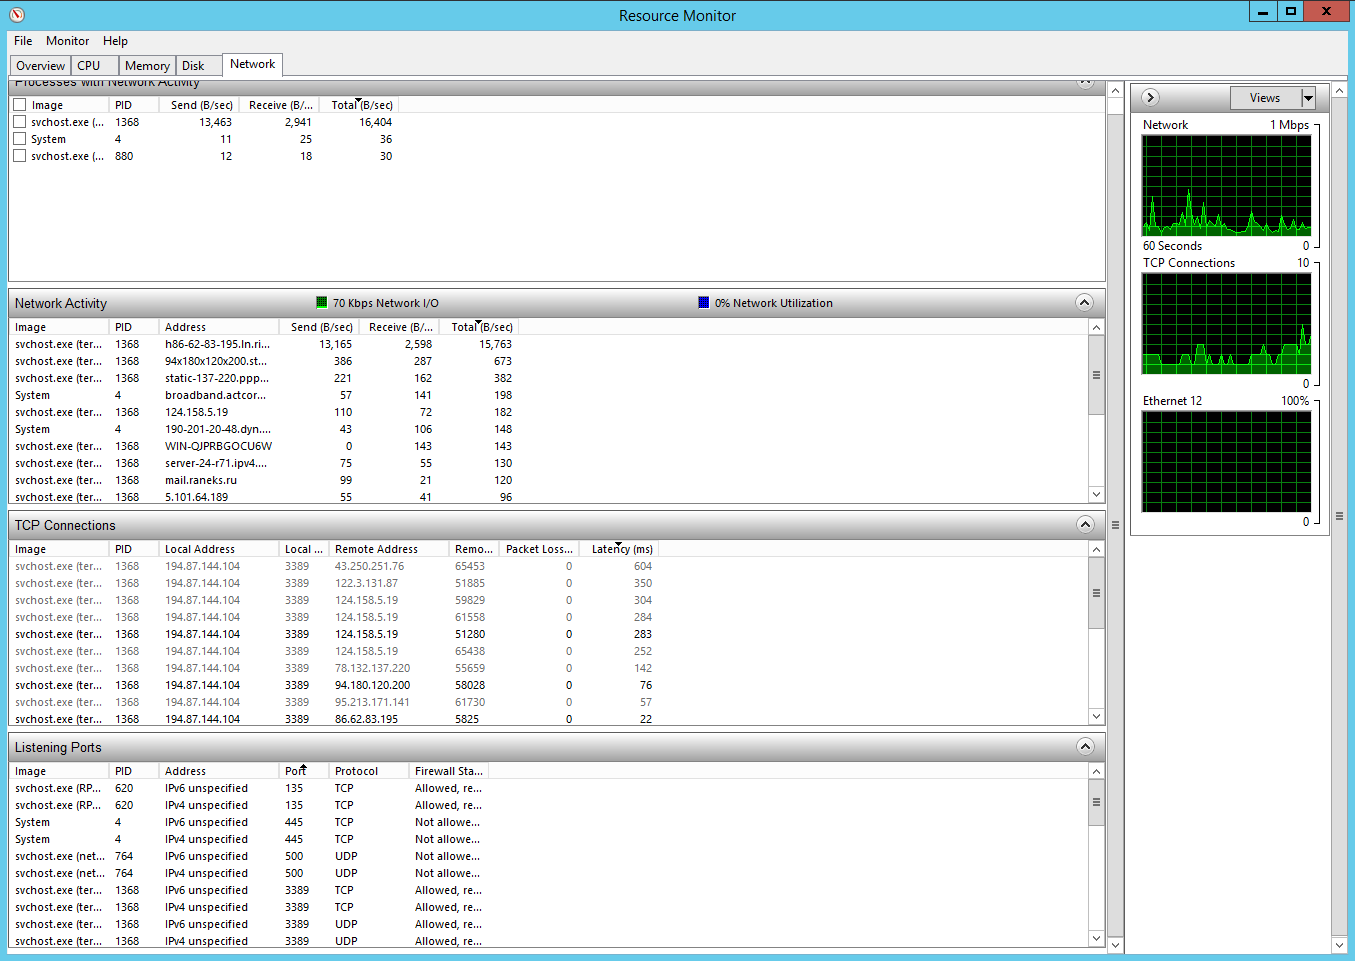
В первую очередь обращаем внимание на общую нагрузку сети. Если она близка к 100% процентам, то скорее всего проблема в сети. На вкладке Processes with Network Activity и TCP Connections мы можем найти название процесса, который нагружает сеть. К сожалению, системные и серверный службы запускаются при помощи системного файла svchost.exe, и часто непонятно какая именно служба загружает сеть. Но если, вы видите, что причина в svchost.exe, то причину нужно искать в службах Windows.
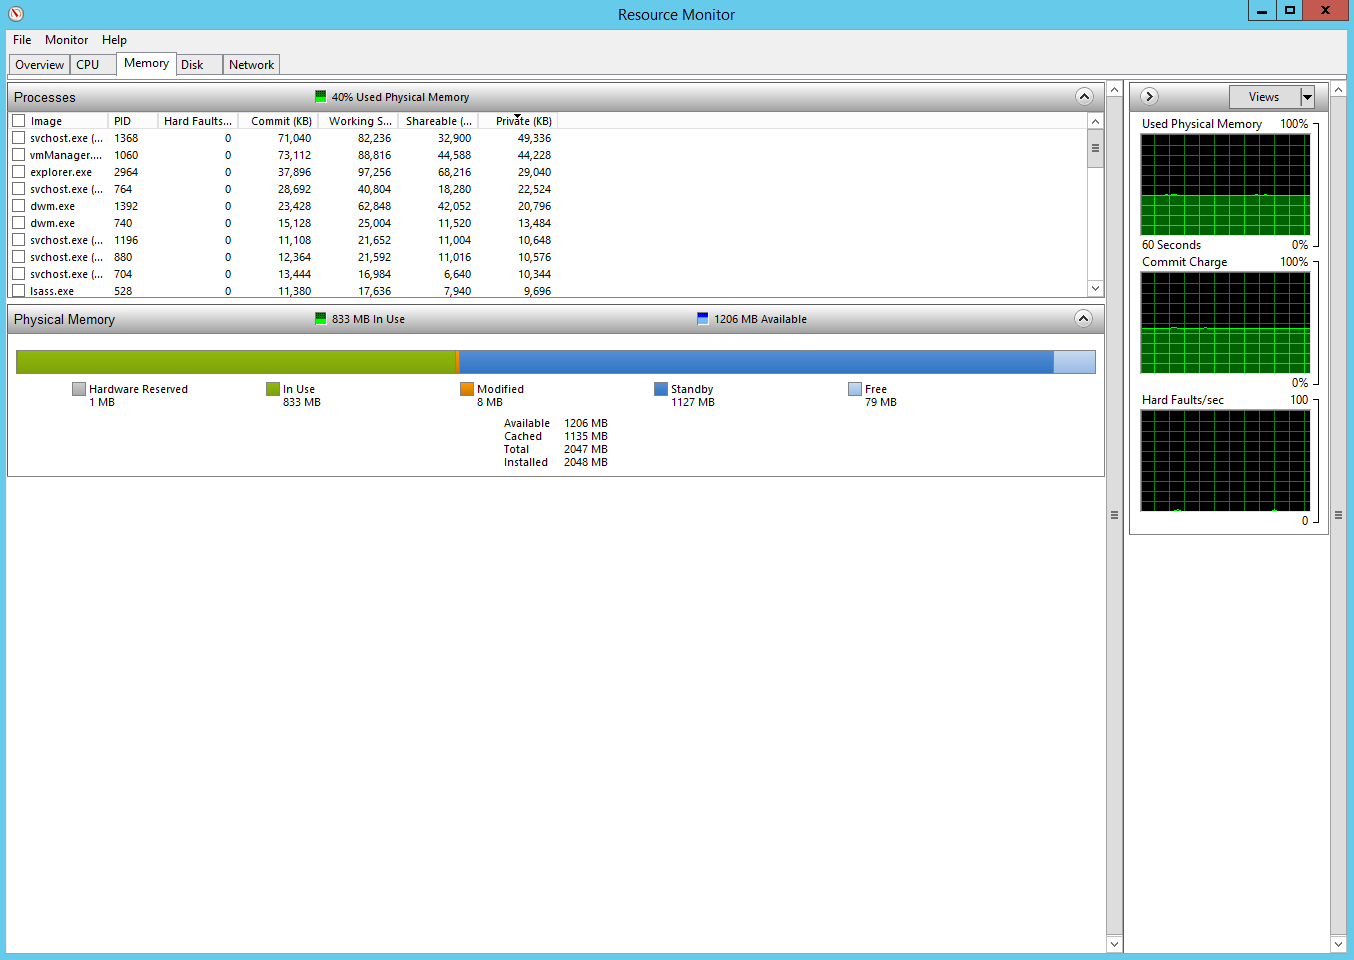
Бывает так, что вы запустили слишком много программ и у вас банально не хватает оперативной памяти. В этом случае нам может помочь вклада Memory. Иформация по процессам аналогична вкладке Network:
Самый простой случаей это загрузка CPU. Ее можно посмотреть на вкладке как на вкладке CPU так и в обычном Task Manager:
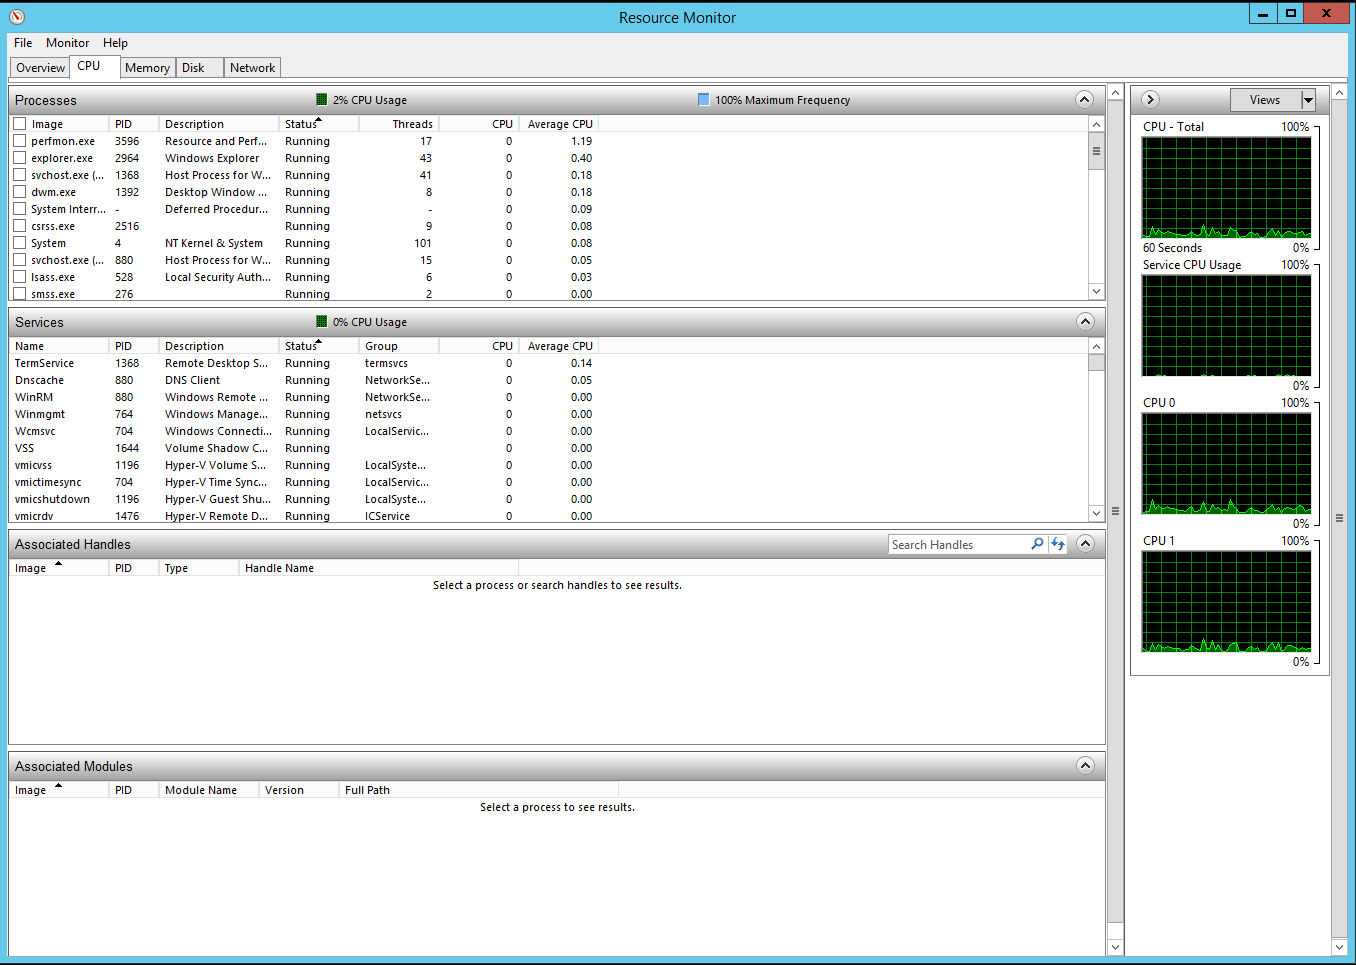
Таким образом, Resource Monitor предоставляет нам мощное средство для анализа текущей загруженности системы. Технической описание Resource Monitor на сайте https://msdn.microsoft.com/ru-ru/library/windows/desktop/aa372266(v=vs.85).aspx
Windows Server
В данной статье мы расскажем, почему тормозит Windows и опишем популярные системы мониторинга, которые помогут выявить проблему. Данная информация будет полезна не только администраторам серверов на Windows, но и простым пользователям, которые работают с этой системой на своих ПК. Также материал будет полезен всем, кто использует виртуальный сервер на Windows и хочет добиться большей производительности.
Производительность сервера зависит от многих факторов. Условно все источники проблем можно разделить на несколько основных групп, а именно — процессор, оперативная память, жесткий диск, сеть и программное обеспечение. Если причина сбоев не очевидна, то в первую очередь нужно проверить состояние перечисленных компонентов. Для начала рассмотрим штатные инструменты для анализа производительности системы на примере Windows Server 2012 R2.
1. Диспетчер задач
Диспетчер задач позволяет выполнять различные операции с процессами, например назначать приоритет, “привязывать” процессы к определенному процессору, создавать новые процессы, но наиболее частое применение — быстрый просмотр текущей загруженности системы и принудительное завершение “проблемных” приложений.
Способы запуска Диспетчера задач:
- щелкнуть правой кнопкой мыши на панели задач и выбрать в меню “Диспетчер задач”
- ввести команду “taskmgr” в окне “Выполнить” или командной строке.
- нажать комбинацию клавиш “Ctrl+Alt+Del” и выбрать “Диспетчер задач”
- нажать комбинацию клавиш “Ctrl+Shift+Esc”
Диспетчер задач отображает в реальном времени для каждого работающего процесса объем потребляемой оперативной памяти и нагрузку на процессор. Наиболее полная информация представлена на вкладке “Подробности”. Если щелкнуть мышью по заголовку любого столбца, строки будут отсортированы по его значениям. Для принудительного завершения процесса нужно щелкнуть правой кнопкой мыши по соответствующей строке и выбрать “Снять задачу”. Кроме этого в контекстном меню доступны дополнительные действия.

Если на сервере работает одновременно несколько пользователей, будет полезна вкладка “Пользователи” на которой все процессы сгруппированы по пользователям. Щелчок правой кнопкой мыши по имени пользователя вызывает контекстное меню с доступными действиями. Администратор может отправить сообщение, отключить или полностью завершить сеанс выбранного пользователя.
Вкладка “Службы” отображает состояние служб, а через контекстное меню можно выполнить остановку, запуск или перезапуск службы. На вкладке “Процессы” выполнена группировка процессов по типу, а на вкладке “Производительность” текущая активность компонентов компьютера представлена в графическом виде.
Диспетчер задач предоставляет пользователю минимальный объем информации о загруженности системы, с помощью которого можно выполнить первоначальную диагностику.
2. Монитор ресурсов
Монитор ресурсов содержит более детальную информацию. Кроме загрузки процессора и оперативной памяти, для каждого процесса в реальном времени отображаются операции чтения и записи на диск, открытые файлы, связанные службы и библиотеки, сетевая активность.
Как запустить мониторинг ресурсов? Есть несколько способов:
- нажать кнопку “Открыть монитор ресурсов”, расположенную на вкладке “Производительность” диспетчера задач;
- ввести команду “resmon” в командной строке или окне “Выполнить”;
- выбрать “Монитор ресурсов” в меню “Средства” диспетчера серверов.
На каждой вкладке монитора ресурсов информация представлена в табличном и графическом виде. Для того, чтобы в таблицах изменить набор столбцов, нужно щелкнуть по заголовку любого столбца правой кнопкой мыши и нажать “Выбрать столбцы”. Если на любой из вкладок пометить нужные процессы флажком, информация в других таблицах будет автоматически отфильтрована по выбранным значениям.
Сведения об активности процессора, памяти, дисков и сети представлены на отдельных вкладках, а вклада “Обзор” содержит сводную информацию по всем компонентам.

Рассмотрим некоторые полезные возможности монитора ресурсов на Windows.
A. Поиск процесса, блокирующего файл
Бывают ситуации, когда при попытке удалить или изменить файл система выводит сообщение, что файл используется другим приложением и не может быть удален. Для поиска блокирующего процесса нужно ввести часть имени файла в разделе “Связанные дескрипторы”, вкладки “ЦП”. При необходимости процесс можно принудительно завершить.

B. Просмотр дисковой активности
На вкладке “Диск” отображаются операции чтения-записи с диска. На скриншоте показан случай, когда система активно обращается к файлу подкачки “c:/pagefile.sys”, обычно это существенно замедляет работу системы и свидетельствует о нехватки оперативной памяти.
Также следует обратить внимание на показатель “Длина очереди диска”, считается, что он не должен превышать более чем в два раза количество физических дисков. Если на сервере установлен один физический диск, нормальной считается длина очереди 1-2. Частые всплески этого показателя и высокое время активности диска могут говорить о низкой производительности дисковой подсистемы.

C. Просмотр сетевой активности
На вкладке “Сеть” можно выявить процессы создающие нагрузку на сеть. Это могут быть сторонние приложения, как на скриншоте, так и внутренние процессы. Как пример можно привести автоматическое обновление операционной системы.
В разделе “TCP-подключения” будут полезны показатели “Процент потерянных пакетов” и “Задержка”, по этим параметрам можно оценивать качество сетевого соединения.
Кроме этого, на вкладке “Сеть” можно видеть прослушиваемые порты и состояние брандмауэра.

Диспетчер задач и монитор ресурсов могут выявить проблему только при условии, что она наблюдается в момент проведения диагностики, но очень часто проблема проявляется не постоянно, а эпизодически. Далее описываются инструменты для мониторинга состояния системы в течении определенного интервала времени.
3. Системный монитор
Системный монитор позволяет отслеживать счетчики различных системных объектов операционной системы. Например, объект “Физический диск” содержит счетчики “Процент активности диска” и “Средняя длина очереди диска”, а объект “Память” — счетчик “Вывод страниц/с”.
Способы запуска:
- выбрать “Системный монитор” в меню “Средства” диспетчера серверов;
- выполнить команду “perfmon” в командной строке или окне “Выполнить”;
- выбрать “Системный монитор” в группе “Администрирование” панели управления.
Системный монитор состоит из трех основных компонентов: “Средства наблюдения”, “Группы сборщиков данных” и “Отчеты”. В разделе “Средства наблюдения” находится системный монитор, с помощью которого можно наблюдать показания счетчиков в реальном времени или просматривать ранее сохраненные отчеты. Раздел “Группы сборщиков данных” содержит набор счетчиков за которыми будет вестись наблюдение. Для диагностики можно воспользоваться двумя готовыми системными группами или создать собственные. В разделе “Отчеты” сохраняются результаты мониторинга.
Рассмотрим диагностику используя готовую группу сборщиков данных “System Performance (Производительность системы)”
1. Переходим в раздел “Группы сборщиков данных” — “Системные” и запускаем группу “System Performance (Производительность системы)”

2. Ожидаем завершения сбора данных, продолжительность по умолчанию 1 минута, и открываем отчет в разделе “Отчеты” — “System Performance”

В верхней части отчета отображается сводная информация по основным компонентам системы и рекомендации в случае обнаружения проблем. На тестовом сервере результаты диагностики показали нехватку оперативной памяти.
Для того, чтобы увидеть как изменялись значения счетчиков во время сбора данных нужно нажать на панели инструментов кнопку “Просмотреть данные в системном мониторе”. После этого щелкаем в нижней части окна на интересующий нас счетчик, например “% загруженности процессора” и нажимаем кнопку “Выделить” на панели инструментов, после чего соответствующий график станет выделен черной жирной линией. Под графиками отображаются среднее, максимальное и минимальное значения выбранного счетчика.

Отчеты хранятся в обычных файлах в папке “c:Perflog”, поэтому их легко можно перенести на другой компьютер.
Встроенные группы сборщиков данных недоступны для редактирования, но для групп созданных вручную можно задавать различные параметры, например общую длительность сбора данных или время запуска по расписанию.
Для создания группы нужно щелкнуть правой кнопкой мыши по папке “Особые” в разделе “Группы сборщиков данных”, выбрать “Создать” — “Группа сборщиков данных” и следовать указаниям мастера. Если на созданной группе щелкнуть правой кнопкой мыши и выбрать “Свойства”, откроется окно в котором можно изменить параметры по умолчанию.

4. Журнал событий
В журнале событий регистрируются все значимые изменения в работе операционной системы. Это может быть запуск или остановка службы, установка обновления, перезагрузка, ошибка чтения с диска или сбой в работе приложения. События делятся на информационные, критические, события ошибок и события предупреждений. Если операционная система Windows тормозит, зависает или работает со сбоями, а также какое-либо приложение работает нестабильно, то с большой долей вероятности в журнале событий будут соответствующие записи. Именно эти записи помогут понять причину тормозов и сбоев.
Способы запуска Журнала событий:
- выбрать “Просмотр событий” в меню “Средства” диспетчера серверов.
- выбрать “Просмотр событий” в группе “Администрирование” панели управления.
- выполнить команду “eventvwr” в командной строке или окне “Выполнить”
Журналы находятся в разделах “Журналы Windows” и “Журналы приложений и служб”. Скорее всего информация о сбоях будет находиться в журнале “Система” раздела “Журналы Windows”. Но если заранее неизвестно, что именно нужно искать, то можно воспользоваться готовым представлением “События управления”, в котором отображается информация из всех основных журналов. Готовое представление недоступно для редактирования, поэтому если возникнет необходимость изменить выводимые журналы или категории событий можно создать собственное представление или скопировать существующее.
Щелкнем правой кнопкой мыши на представлении “События управления” и выберем “Копировать настраиваемое представление”, в открывшемся окне нажимаем “Ок”. В результате появится новое представление “События Управления (1)”. Для редактирования нужно выделить созданное представление и нажать в правой части окна кнопку “Фильтр текущего настраиваемого представления”.
Для диагностики неисправности можно настроить вывод только ошибок и критических событий.

5. Монитор стабильности системы
Монитор стабильности системы можно рассматривать как дополнение к журналу событий. Для запуска нужно открыть “Панель управления”, перейти в раздел “Центр поддержки” и нажать “Показать журнал стабильности работы” в группе “Обслуживание”.

События в окне монитора сгруппированы по датам. Если выделить определенную дату, в нижней части экрана отобразится список связанных событий. В зависимости от степени критичности, в верхней части экрана строится линия стабильности, по которой можно оценивать динамику сбоев.

Описанные инструменты мониторинга взаимно дополняют друг друга, поэтому их комплексное использование позволяет получить наиболее полную информацию о работе системы.
Инструменты, перечисленные в данной статье, могут помочь выявить большинство причин зависания и тормозов Windows. Зачастую поиск и устранение неисправностей помогает восстановить скорость работы системы без переустановки Windows.
This post is part 1 of a 3-part series on monitoring the health and performance of the Windows operating system. Part 2 details how to monitor Windows Server 2012 natively with a variety of tools, and Part 3 explains how to monitor Windows with Datadog. For an in-depth webinar and Q&A session based on this series, check out this slide deck and video.
A window into Windows performance
Operating systems monitor resources continuously in order to effectively schedule processes. However, surfacing that data for your own monitoring or analytics is not always easy. Fortunately, the Windows Server family of operating systems offer a wealth of operational data that you can access through a number of channels. To help make your Windows infrastructure observable, you need to track several types of data from Windows Server 2012:
- Performance counters
- Events
- Services
A few notes about terminology: In this series, we use the term “Windows” to reference Windows Server 2012 R2 specifically, though many of the performance counters and events discussed in this series are available in other Windows Server versions. And we’ll characterize metrics as “work” or “resource” metrics—for background on this distinction, refer to our Monitoring 101 posts on metric collection and alerting.
Performance counters/metrics
Windows exposes a huge number of metrics (more than 15,000 on a fresh install) as so-called performance counters. Key performance counters can be divided into four groups:
- CPU
- Memory
- Disk
- Network
The lists provided below provide a good foundation to get started monitoring Windows Server, no matter if your box is a file server, DNS server, Active Directory Domain Controller, or otherwise. Though many of these metrics are not immediately actionable, taken in aggregate, they provide a clear view of the state of the system at a point in time, which is invaluable when performing root cause analysis or troubleshooting. Of course, depending on your use case, there may be additional performance counters to monitor.
CPU metrics
| WMI Class | Property name | Description | Metric Type |
|---|---|---|---|
| Win32_PerfFormattedData_PerfOS_Processor | PercentProcessorTime | Percentage of time CPU is performing work | Resource: Utilization |
| Win32_PerfFormattedData_PerfProc_Thread | ContextSwitchesPersec | Number of times the processor switched to a new thread | Other |
| Win32_PerfFormattedData_PerfOS_System | ProcessorQueueLength | Number of threads waiting on a processor | Resource: Saturation |
| Win32_PerfFormattedData_PerfOS_Processor | DPCsQueuedPersec | Number of lower-priority tasks deferred due to interrupts | Resource: Saturation |
| Win32_PerfFormattedData_PerfOS_Processor | PercentPrivilegedTime PercentDPCTime PercentInterruptTime | Percentage of time CPU spent in privileged mode/deferred procedure calls/interrupts | Resource: Utilization |
PercentProcessorTime
Prolonged periods of 100 percent CPU usage indicates a resource bottleneck. Correlating CPU usage with the length of the processor queue can help you determine if your workload is too much for the machine. High CPU usage alongside spikes in processor queue length imply a lack of adequate compute resources for the operating system to complete the work it’s tasked with.
ContextSwitchesPersec
A context switch occurs when a processor has completed the execution of a task (or is interrupted before completion) and switches to a new one. A context switch is an expensive operation that involves the following steps, as outlined in Microsoft’s reference guide:
- Save the context of the just-completed thread
- Push the completed thread down to the end of the queue associated with its priority level
- Find the highest-priority queue containing executable threads
- Pop the thread at the head of that queue, load its context, and execute it
A high rate of context switching typically indicates resource contention and points to a CPU bottleneck. Though if the context switches are occurring due to some demanding hardware device (with a corresponding increase in the rate of interrupts), the problem could lie in its driver.
Microsoft offers a few tips here on optimizing workloads to minimize context switching, among other useful tidbits.
ProcessorQueueLength
Threads in the processor queue are ready to run but can’t, due to another thread running on the processor. Queues with sustained element counts greater than 2 are indicative of a bottleneck.
Keep in mind that queues are likely to increase in size during periods of high processor activity, but queues can also develop when utilization is well below 90 percent.
DPCsQueuedPersec
Deferred procedure calls (DPCs) provide a low-priority interrupt mechanism on Windows systems. Understanding deferred procedure calls requires a brief explanation of system interrupts in an operating system context.
Hardware requirements demand real-time, unfettered access to the CPU in order to ensure that high-priority work (like accepting keyboard input) is performed when it is needed. Interrupts provide a means by which devices can interrupt the processor and force it to perform the requested operation (triggering the processor to perform a context switch). Some work from devices may be put off until later, but still must be accomplished in a timely manner. Enter DPCs.
Through DPCs, real-time processes like device drivers can schedule lower-priority tasks to be completed after higher-priority interrupts are handled. DPCs are created by the kernel, and can only be called by kernel mode programs.
A high or near-constant number of DPCs could point to issues with low-level system software. An unused but buggy sound driver could be the culprit, for example. For more information on finding the offending service or program, check out part two of this series.
PercentPrivilegedTime, PercentDPCTime, and PercentInterruptTime
This trio of percentages offers insight into high CPU usage. PrivilegedTime is the time the CPU spends processing instructions from kernel-mode programs, DPCTime is the time the CPU spends processing deferred procedure calls, and InterruptTime is the time the CPU spends handling interrupts. It should be noted that the processor regularly issues interrupts to switch context to a new thread, so you should expect some level of background noise for this metric.
Systems that are spending 30 percent or more of their time processing privileged instructions should be inspected. First, examine DPCTime and InterruptTime; if either value exceeds 20 percent, a hardware issue is likely to be the culprit. You can use a tool like xperf (bundled with Windows) to dig deeper into the offending process.
Memory metrics
| WMI Class | Property name | Description | Metric Type |
|---|---|---|---|
| Win32_PerfFormattedData_PerfOS_Memory | AvailableMBytes | Amount of physical memory available (MB) | Resource: Utilization |
| Win32_PerfFormattedData_PerfOS_Memory | CommittedBytes | Amount of virtual memory (in bytes) committed | Resource: Utilization |
| Win32_PerfFormattedData_PerfOS_Memory | PoolNonpagedBytes | Amount of memory (in bytes) excluded from the paging pool | Resource: Utilization |
| Win32_PerfFormattedData_PerfOS_Memory | PageFaultsPersec | Page faults per second | Resource: Saturation |
| Win32_PerfFormattedData_PerfOS_Memory | PagesInputPersec | Number of pages retrieved from disk (per second) | Other |
| Win32_PerfFormattedData_PerfOS_PagingFile | PercentUsage | Percent of paging file used | Resource: Utilization |
AvailableMBytes
It is important to keep an eye on the amount of available memory, as contention for RAM will inevitably lead to paging and performance degradation. To keep your machine humming along, make sure it has an ample amount of RAM for your workloads. Consistently low memory availability can lead to segmentation faults and other serious issues. Possible remedies include increasing the amount of physical memory in the system and, if appropriate, enabling memory page combining.
CommittedBytes
CommittedBytes represents the actual demand for virtual memory. Memory that has been allocated, whether in physical RAM or the page file, counts towards the CommittedBytes total. When the number of CommittedBytes approaches or exceeds the physical memory of the system, paging to disk (and its associated performance impacts) is unavoidable.
If the value of CommittedBytes converges on the maximum memory of the system, then you are running out of available memory and must either increase the size of the page file or increase the amount of physical memory available.
In general, if this metric is trending upward increasing without leveling off, you should investigate.
PageFaultsPersec
Page faults occur when a process requests a page in memory that can’t be found. There are two types of page faults: soft and hard. A soft page fault indicates that the page was found elsewhere in memory. A hard page fault indicates that the page had to be retrieved from disk. Systems can tolerate a fairly high number of soft page faults, though hard page faults often result in delays.
The PageFaultsPersec metric tracks the number of page faults, both soft and hard. To focus on hard page faults, look for high values of pages input per second (outlined below). If you identify a surge in hard page faults, you should either increase system memory, or else decrease the system cache size to free up memory for paging.
Monitoring the working set of process memory allows you to correlate a specific process’s memory usage with page faulting. Under heavy load, the operating system will continuously trim processes’ working memory, resulting in frequent page faults. To narrow down the offending process, you can also correlate with page fault frequency by process (check the Win32_PerfFormattedData_PerfProc_Process object).
PoolNonpagedBytes
As mentioned above, the Windows kernel and hardware devices require the ability to preempt other threads to execute their time-sensitive work. Because of these strict requirements, devices and the kernel access physical memory directly, and not through virtual memory, as do user-mode processes.
This special pool of memory is not subject to paging to disk, due to the time requirements of its users. Normally, this is not an issue. But the special treatment of this pool means that problems with the components using this memory could be fatal for the system. Memory leaks in drivers that use the non-paged pool, for instance, could lock up the system entirely, as memory for user-mode processes is dumped to disk. Keeping an eye on this metric is useful for debugging memory leaks and other showstopping issues.
Windows Event 2019 (“Nonpaged Memory Pool Empty”) will occur in the event of insufficient allocable memory. (Though the Microsoft reference page lists the cause as a TCP/IP sockets program continuously attempting to open a nonexistent socket, this event will also occur if the non-paged pool address space is exhausted.)
PagesInputPersec
This metric reports the number of pages read from disk (as opposed to the number of read operations) to resolve hard page faults.
Recall that there are two types of page faults, and only hard page faults require fetching the page from disk. Tracking PagesInputPersec alongside PageFaultsPersec gives a clear view into the type of fault occurring. High values of the PagesInputPersec counter indicate hard page faults.
It is worth mentioning that when a hard page fault does occur, Windows attempts to retrieve multiple, contiguous pages into memory, to maximize the work performed by each read. This, in turn, can potentially increase a page fault’s performance impact, as more disk bandwidth is consumed reading in potentially unneeded pages. All of this can potentially be avoided by putting your page file (see next section) on a separate physical (not logical) disk, or increasing the amount of RAM available to your system.
PercentUsage
The paging file is a “hidden” file in the Windows system folder, used to store infrequently accessed memory pages on disk to free up RAM for other things. If you are familiar with Linux, the page file is similar to the swap partition.
Because the paging file is located on disk, not only will reads/writes to it impact overall system performance, but it is also subject to fragmentation, which degrades system performance even further.
By default, Windows manages the page file, which means the size of the file can increase or decrease without any user input. However, some cases may warrant manual tweaking of the file size. For more information on tuning your page file size (and other potential optimizations), check out Microsoft’s documentation on page file tuning.
Disk metrics
| WMI Class | Property name | Description | Metric Type |
|---|---|---|---|
| Win32_PerfFormattedData_PerfDisk_LogicalDisk | PercentFreeSpace | Percentage of disk space remaining | Resource: Utilization |
| Win32_PerfFormattedData_PerfDisk_LogicalDisk | PercentIdleTime | Percentage of time disk was idle | Resource: Availability |
| Win32_PerfFormattedData_PerfDisk_LogicalDisk | AvgDisksecPerRead AvgDisksecPerWrite | Average time of a read/write operation (in seconds) | Work: Performance |
| Win32_PerfFormattedData_PerfDisk_LogicalDisk | AvgDiskQueueLength | Average number of read/write requests (per disk) in queue | Resource: Saturation |
| Win32_PerfFormattedData_PerfDisk_LogicalDisk | DiskTransfersPersec | Rate of read/write operations on disk | Work: Throughput |
| Win32_PerfFormattedData_PerfOS_Memory | CacheBytes | Size of file system cache in memory | Resource: Utilization |
PercentFreeSpace
Maintaining ample free disk space is a necessity for any operating system. Beyond regular processes requiring disk, core system processes store logs and other kinds of data on disk. Windows will issue a warning if your available disk space drops below 15 percent, but you should alert on this metric to catch the smoke before the fire.
PercentIdleTime
This metric reports the percentage of time the disk was idle. If you are hosting your page file on a drive separate from the OS drive, you should definitely track and potentially alert on this metric, on both your primary drive and the page file’s drive. Low values for idle time should be investigated; high I/O on the page file disk will translate to increased memory access times, which will be felt by any application whose memory is mapped to the paging file. Possible solutions include moving the paging file to an unused drive or a faster drive.
Beyond the paging file, performance of applications that make heavy use of the disk (like SQL Server, for example) will certainly suffer during prolonged periods of high I/O.
AvgDisksecPerRead and AvgDisksecPerWrite
This pair of metrics tracks the average amount of time taken for disk read/write operations. In general, values larger than about 30 milliseconds indicate relatively high latency, which can often be reduced by moving to faster disks. Depending on the role of your server, the acceptable threshold could be much lower—as low as 10 milliseconds if you are running Exchange Server or SQL Server.
AvgDiskQueueLength
The average disk queue length gives a running average of the number of read/write requests in the queue. This value is not a direct measurement of the disk queue at any given point in time; it is an estimate derived from (Disk Transfers/sec) * (Disk secs/Transfer).
Generally speaking, if the average disk queue length exceeds 2 * (number of drives) for prolonged periods, a bottleneck is forming.
DiskTransfersPersec
If your server is hosting a demanding application, like SQL Server or Exchange, you will want to monitor your disk I/O rates. The DiskTransfersPersec metric is an aggregate of read (DiskReadsPersec) and write (DiskWritesPersec) activity, tagged by disk (and a total across all disks tagged with _Total). Sustained periods of high disk activity could lead to service degradation and system instability, especially when coupled with high RAM and page file use. Possible remedies include increasing the number of disks in use (especially if you’re seeing a large number of ops in queue), using faster disks, increasing RAM reserved for file system cache (see below), and distributing the offending workload across more machines, if possible.
CacheBytes
The CacheBytes counter tracks the size, in bytes, of the portion of memory reserved as a file system cache. Whereas the paging file is used to store memory contents on disk, the file cache stores disk contents in RAM, for faster access.
Tuning the file cache size for optimal performance is a balancing act—if the cache is too small, access to files is slower; if the cache is too large, programs may end up with their memory paged to disk, slowing them down. By default, Windows takes care of this for you, allocating free RAM to be used for the file cache. However, your requirements may require manual tweaking of the file cache, for which you can use a tool like CacheSet.
It is worth mentioning that if you are opening many “large” files (larger than about one gigabyte), your issue may be caused by an issue in the accessing process, specifically, calling CreateFile() with the FILE_FLAG_RANDOM_ACCESS flag set. Passing this flag to CreateFile causes the Cache Manager to keep previously viewed memory pages in the cache. When accessing files whose cumulative size exceeds the amount of physical memory, performance will suffer. See KB 2549369 for more information.
Network metrics
| WMI Class | Property name | Description | Metric Type |
|---|---|---|---|
| Win32_PerfFormattedData_Tcpip_NetworkInterface | BytesSentPersec BytesReceivedPersec | Network send/receive rate | Resource: Utilization |
| Win32_PerfFormattedData_Tcpip_TCPv4 | SegmentsRetransmittedPersec | IPv4 TCP retransmissions | Other |
BytesSentPersec and BytesReceivedPersec
Taken together, these two metrics measure the total network throughput of a given network interface. With most consumer hardware shipping with NICs capable of 1 gigabit per second or more, it is unlikely that the network would be a bottleneck in all but the most extreme cases. Microsoft documentation suggests that network saturation occurs when consuming more than 80 percent of the interface’s bandwidth, amounting to 100 megabytes per second for a 1-Gbps link.
Though unlikely to be the cause of performance issues, correlating network throughput with metrics from applications running on top of Windows (like IIS) could shed light on issues arising in those applications. In the event that you are saturating your network link, you may consider using a web cache for outbound traffic; otherwise you may need to increase your bandwidth (via your provider or through hardware upgrades).
SegmentsRetransmittedPersec
TCP retransmissions occur when a transmitted segment has not been acknowledged within the TCP timeout window, so the segment is re-sent.
TCP retransmissions occur frequently and are not errors, though their presence can be a sign of issues. Retransmissions are usually the result of network congestion, and most often are correlated with high bandwidth consumption. You should monitor this metric because excessive retransmissions could cause extensive delays in your applications. If the sender of the retransmits does not receive an acknowledgment of packets sent, it holds off on sending more packets (usually for about 1 second), adding delays that can compound congestion-related slowdowns.
If not caused by network congestion, the source of retransmits could be faulty network hardware. A low number of discarded packets in conjunction with a high rate of retransmissions could point to excessive buffering as the culprit. Whatever the cause, you should track this metric to shed light on seemingly-random fluctuations in network application response times.
Events
While performance counters provide a high-level overview of resource usage and performance, troubleshooting complex issues requires additional information on the sequence of events that occurred before or during the observed issue. By correlating performance counters with events from the Windows Event Log, metrics can be put in context with events across a network of hosts.
Windows Server 2012 has many event sources and, subsequently, many different event logs. (Our test environment, a fresh Windows Server 2012 installation on Microsoft Azure, had 245 separate event logs.) You can see the full list available on your system by navigating to the %SystemRoot%System32WinevtLogs directory. The event logs that are pertinent to you will depend on what you are using your server for (Active Directory Domain Controller, DNS server, etc.).
In addition to monitoring those event logs important to your use case, the Application (Application.evtx), System (System.evtx) and Security (Security.evtx) logs will provide useful information to most Windows administrators. Below we will break down several important events, categorized by event log, and classified by log level. See this reference for a list of all event properties.
- System Events
- Application Events
- Security Events
System events
| Event Log | Level | ID | Event Description | Source |
|---|---|---|---|---|
| System | Critical | 41 | Unexpected reboot | Kernel-Power |
| System | Error | 1001 | Server rebooting from BugCheck | BugCheck |
System EventID: 41
This system event is logged when a system fails to cleanly shut down before rebooting. Power loss, a crash, or hung operating system are all common causes. Unless otherwise configured, Windows will reboot when it blue screens, so you probably want to alert on this event. If you see this event occur along with System event 1001 (see below), you can be sure the reboot was caused by a blue screen.
System EventID: 1001
When a system blue screens, an event is written to the System log with more information on the cause of failure (returned as a hex value), as well as the location of the memory dump generated at the time of the failure. By default, Windows will reboot when it blue screens, which means you may not notice an error occurred without peering into the event logs.
Pinpointing the root cause of blue screens is very important—once one occurs, it is generally a sign of things to come. You definitely want to be aware of these events and should set an alert on their occurrence.
Application events
Application events give additional details on application failures and started services.
| Event Log | Level | ID | Event Description | Source |
|---|---|---|---|---|
| Application | Error | 1000 | App Error | Application Error |
| Application | Error | 1002 | App Hang | Application Hang |
Application EventID: 1000
Events in the Application event log with EventID 1000 indicate that an application error has occurred, which resulted in a crash. From time to time, core Windows applications and services may encounter errors and crash. This is not usually an issue; in most cases, Windows can restart the service and resume operation.
Because automatic restart is not always possible, however, you may want to alert on this event, depending on the application that crashed. If an application is continuously crashing, further investigation may be warranted.
Application EventID:1002
Hung applications occur when a user attempts to give input to a GUI, and the GUI does not update with the new input. Applications that repeatedly hang should be investigated; there could be an underlying issue causing the hang. An application suddenly and repeatedly hanging when it was previously working correctly can oftentimes be attributed to system changes, like a driver or firmware update. Correlating system changes with this event can shed light on the underlying causes of hung applications. Note that applications can only enter the hung state upon attempts at user interaction; Windows only becomes aware of a hung application when a user attempts to interact with it.
Important changes to users, groups, and other important features are logged to the Security Audit event log. Some of the more important events can be found below; for an exhaustive list of security audit events, see Microsoft’s documentation.
Should any of these events unexpectedly arise in the event log, swift action should be taken to verify the source of the changes and their legitimacy.
| Event Log | Level | ID | Event Description | Source |
|---|---|---|---|---|
| System | Information | 104 | Event log cleared | Microsoft-Windows-EventLog |
| Security | Information | 1102 | Audit log cleared | Microsoft-Windows-EventLog |
| System | Information | 4719 | System audit policy modified | Microsoft-Windows-EventLog |
| Security | Information | 4740 | User account locked | Microsoft-Windows-Security-Auditing |
| Security | Information | 4728, 4732, 4756 | User added to a security-enabled group | Microsoft-Windows-Security-Auditing |
| Security | Information | 4735 | Security-enabled group was modified | Microsoft-Windows-Security-Auditing |
| Security | Information | 4724 | Password reset attempt | Microsoft-Windows-Security-Auditing |
| Security | Information | 4625 | An account failed to logon | Microsoft-Windows-Security-Auditing |
| Security | Information | 4648 | A logon was attempted using explicit credentials | Microsoft-Windows-Security-Auditing |
Services
Monitoring Windows services serves two purposes: ensuring that essential services remain up, and enabling the discovery and disabling of non-essential services.
Windows services are long-running, (typically) background processes, similar to Unix-like daemons. The services you monitor depend on your use case and the specific role of the server in question. The list below provides a good starting point, containing a mix of essential and common services that are relatively role-neutral.
Most of the following services are essential to core Windows functionality. In part 2 of this series, we will explain how to use Windows-native tools to ensure that key services are up and running,
| Display Name | Service Name | Description (source) |
|---|---|---|
| Base Filtering Engine | BFE | Manages firewall and Internet Protocol security policies |
| Background Tasks Infrastructure Service | BrokerInfrastructure | Provides access control for background task execution |
| Cryptographic Services | CryptSvc | Provides three management services: Catalog Database Service, which verifies signatures of system files and new software; Protected Root Service, which controls Trusted Root Certification Authority certificates; and Automatic Root Certificate Update Service, which retrieves root certificates from Windows Update |
| DCOM Server Process Launcher | DcomLaunch | Launches Component Object Model (COM) and Distrbuted Component Object Model (DCOM) servers |
| Diagnostic Policy Service | DPS | Enables system diagnostics and issue resolution for Windows components |
| Windows Event Log | EventLog | Manages events and event logging. Supports logging, querying, subscribing to, and archiving of events |
| COM+ Event System | EventSystem | Supports System Event Notification Service (SENS), which provides automatic distribution of events to subscribing COM components |
| Group Policy Client | gpsvc | Applies settings configured by Group Policy |
| Windows Firewall | MpsSvc | Native firewall to prevent unauthorized network access |
| Performance Logs & Alerts | pla | Collects, logs, and alerts on performance data from local or remote computers |
| Task Scheduler | Schedule | Hosts system-critical scheduled tasks and enables user-configurable scheduled tasks |
| System Events Broker | SystemEventsBroker | Coordinates background work execution for WinRT applications |
| Remote Desktop Services | TermService | Allows remote users to connect interactively to the local machine |
| Windows Management Instrumentation | Winmgmt | Provides a standard interface for accessing management information from the operating system, devices, applications and services |
| Windows Remote Management (WS-Management) | WinRM | Provides remote access to Windows Management Instrumentation (WMI) data and enables event collection |
| WMI Performance Adapter | wmiApSrv | Provides performance library information from WMI providers |
Time to collect
In this post we’ve explored many of the key metrics and events you should monitor to keep tabs on the health and performance of your Windows 2012 servers.
Most of the metrics and events covered in this post should be relevant to general use. Given the number of roles a Windows server can perform, however, over time you will likely identify additional metrics that are particularly relevant to your workloads and users.
Read on for a comprehensive guide to collecting all of the metrics described in this article, using standard tools bundled with Windows Server 2012.
Windows Server 2012 R2 provides a number of tools to monitor an operating system and the applications on a server.
You can use these tools to configure your system for efficiency and troubleshoot problems.
Small and medium sized organizations can use the monitoring tools in Windows Server 2012 to monitor their server infrastructure.
So for this post, lets go through a very simple step how to monitor Windows Server 2012 R2 using Performance Monitor…
For this demo, i will be using my OSI-NPS Server…
1 – Log in to OSI-NPS Server, on the Metro UI type Performance Monitor and enter…

2 – In Performance Monitor console, expand Data Collector Sets, right-click User Defined, point to New, and then click Data Collector Set…

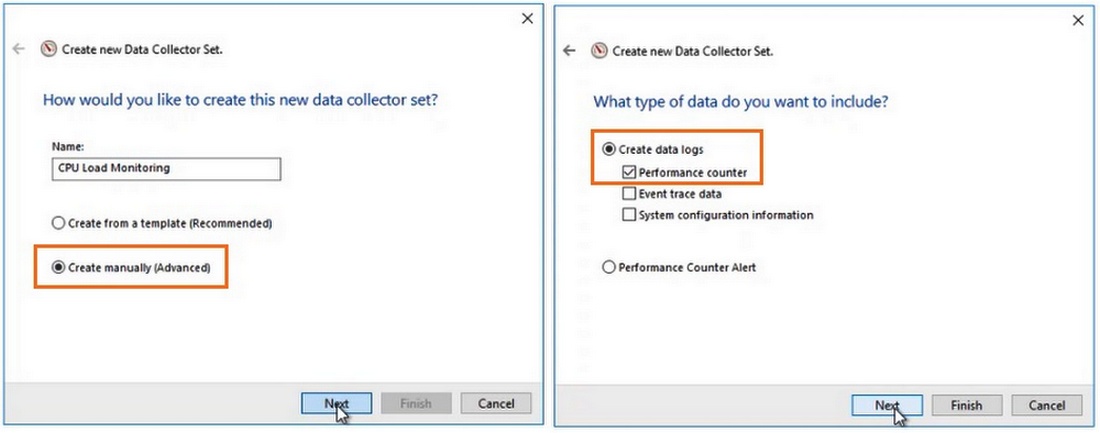
3 – In the Create new Data Collector Set Wizard, in the Name box, type OSI-NPS Performance, click Create manually (Advanced) button, and then click Next…

4 – On the What type of data do you want to include? interface, select the Performance counter check box, and then click Next…

5 – On the Which performance counters would you like to log? interface, click Add…

6 – In the Available counters list, expand Processor, click %Processor Time, and then click Add >>.

7 – repeat the step for Memory, Network Adapter & TCPv4 (you can always choose any counter you want to monitor, this is just example), then click OK…

8 – On the Which performance counters would you like to log? interface, in the Sample interval box, type 10 (i choose 10 second interval), and then click Next…

9 – On the Where would you like the data to be saved? interface, click Next…

10 – On the Create the data collector set? interface, click Save and close, and then click Finish…

11 – In Performance Monitor console, right-click OSI-NOS Performance, and then click Start…

12 – To simulate the monitoring function, just simply open few pages of Internet Explorer page, such as 12 – 15 pages…

13 – after few minutes, right-click OSI-NPS Performance, and then click Stop…

14 – In Performance Monitor console, expand Reports, expand User Defined, expand OSI-NPS Performance, click NPS_DateTime-000001, and then review the report data…

В этой статье мы рассмотрим особенности использования встроенных счетчиков производительности Performance Monitor для мониторинга состояния Windows Server. Счетчики PerfMon можно использовать для отслеживания изменений определенных параметров производительности сервера (алертов) и оповещать администратора в случае возникновения высокой загрузки или других нештатных состояниях.
Чаще всего для мониторинга работоспособности, доступности, загруженности серверов используются сторонние продукты. Если вам нужно получать информацию о производительности приложений либо железа только с одного-двух Windows-серверов, либо когда это нужно на непостоянной основе, либо возник более сложный случай, требующий глубокого траблшутинга производительности, то можно воспользоваться встроенным функционалом Windows Performance Monitor.
Performance Monitor имеет огромное количество счётчиков для получения информации о железе, операционной системе, установленном ПО в виде конкретных цифр. Performance Monitor может вести наблюдение за показателями производительности сервера в реальном времени или записывать историю.
Основные возможности Performance Monitor, которые можно использовать отдельно или совместно с другими сторонними системами мониторинга (типа Zabbix, Nagios, Cacti и другие):
- cистема мониторинга при выводе информации о производительности сначала обращается к Performance Monitor;
- главной задачей системы мониторинга является оповещение о наступлении тревожного момента, аварии, а у Performance Monitor – собрать и предоставить диагностические данные.
Текущие значения производительности Windows можно получить из Task Manager, но Performance Monitor умеет несколько больше:
- Task Manager работает только в реальном времени и только на конкретном (локальном) хосте;
- в Performance Monitor можно подключать счётчики с разных серверов, вести наблюдение длительное время и собранную информацию сохранять в файл;
- в Task Manager очень мало показателей производительности.
Мониторинг производительности процессора с Perfomance Monitor
Для снятия данных о производительности процессора воспользуемся несколькими основными счётчиками:
- Processor% Processor Time — определяет уровень загрузки ЦП, и отслеживает время, которое ЦП затрачивает на работу процесса. Уровень загрузки ЦП в диапазоне в пределах 80-90 % может указывать на необходимость добавления процессорной мощности.
- Processor%Privileged Time — соответствует проценту процессорного времени, затраченного на выполнение команд ядра операционной системы Windows, таких как обработка запросов ввода-вывода SQL Server. Если значение этого счетчика постоянно высокое, и счетчики для объекта Физический диск также имеют высокие значения, то необходимо рассмотреть вопрос об установке более быстрой и более эффективной дисковой подсистемы (см. более подробную статью об анализе производительности дисков с помощью PerfMon).
- Processor%User Time — соответствует проценту времени работы CPU, которое он затрачивает на выполнение пользовательских приложений.
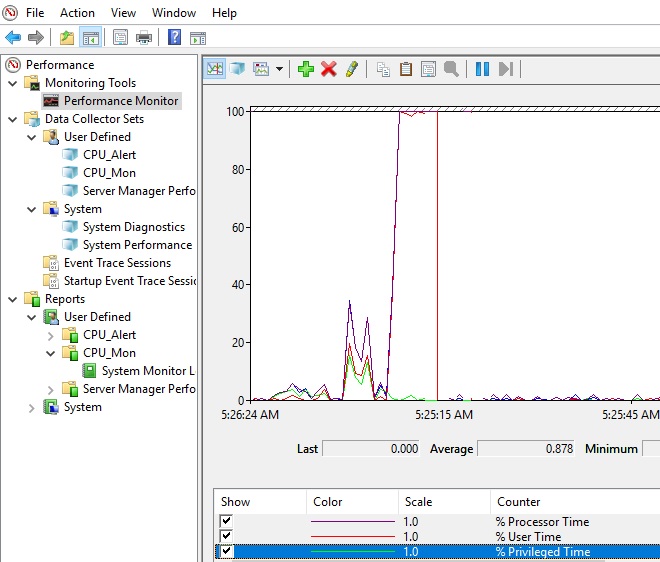
Запустите Performance Monitor с помощью команды perfmon. В разделе Performance Monitor отображается загрузкой CPU в реальном времени с помощью графика (параметр Line), с помощью цифр (параметр Report), с помощью столбчатой гистограммы (параметр Histogram bar) (вид выбирается в панели инструментов). Чтобы добавить счетчики, нажмите кнопку “+” (Add Counters).
Слева направо двигается линия в реальном времени и отображает график загрузки процессора, на котором можно увидеть, как всплески, так и постоянную нагрузку.
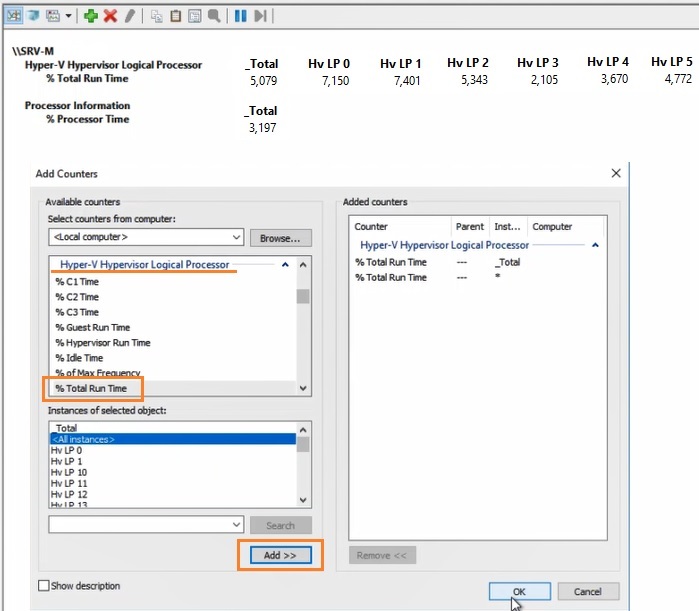
Например, вам нужно посмотреть загрузку процессора виртуальными машинами и самим Hyper-V. Выберите группу счетчиков Hyper-V Hypervisor Logical Processor, выберите счетчик % Total Run Time. Вы можете показывать нагрузку по всем ядрам CPU (Total), либо по конкретным (HV LP №), либо всё сразу (All Instances). Выберем Total и All Instances.
Группы сборщиков данных в PerfMon
Чтобы не сидеть целый за наблюдением движения линии, создаются группы сбор данных (Data Collector Set), задаются для них параметры и периодически просматриваются.
Чтобы создать группу сбора данных, нужно нажать на разделе User Defined правой кнопкой мыши, в меню выбрать New -> Data Collector Set. Выберите Create manually (Advanced) -> Create Data Logs и включите опцию Performance Counter. Нажмите Add и добавите счётчики. В нашем примере % Total Run Time из группы Hyper-V Hypervisor Logical Processor и Available MBytes из Memory. Установите интервал опроса счётчиков в 3 секунды.
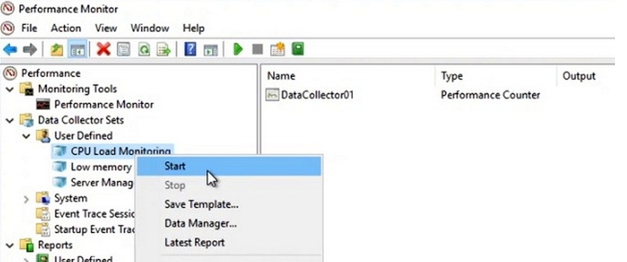
Далее вручную запустите созданный Data Collector Set, нажав на нём правой кнопкой мыши и выбрав в меню пункт Start.
Через некоторое время можно просмотреть отчёт. Для этого в контекстном меню группы сбора данных нужно выбрать пункт Latest Report. Вы можете посмотреть и проанализировать отчёт производительности в виде графика. Отчёт можно скопировать и переслать. Он хранится в C:PerfLogsAdminCPU_Mon и имеет расширение .blg.
Если нужно на другом сервере запустить такой же набор счётчиков, как на первом, то их можно переносить экспортом. Для этого в контекстном меню группы сбора данных выберите пункт Save Template, укажите имя файла (расширение .xml). Скопируйте xml файл на другой сервер, создайте новую группу сбора данных, выберите пункт Create from a template и укажите готовый шаблон.
Создание Alert для мониторинга загрузки CPU
В определённый критический момент в Performance Monitor могут срабатывать алерты, которые помогают ИТ-специалисту прояснить суть проблемы. В первом случае алерт может отправить оповещение, а во втором – запустить другую группу сбора данных.
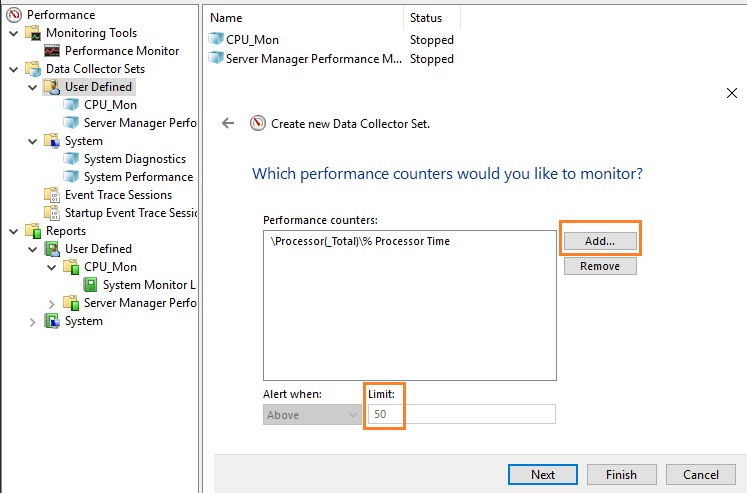
Чтобы создать алерт в PerfMon, нужно создать ещё один Data Collector Set. Укажите его имя CPU_Alert, выберите опцию Create manually (Advanced), а затем — Performance Counter Alert. Добавьте счётчик % Total Run Time из Hyper-V Hypervisor Logical Processor, укажите границу загрузки 50 %, при превышении которой будет срабатывать алерт, установите интервал опроса счётчика в 3 секунды.
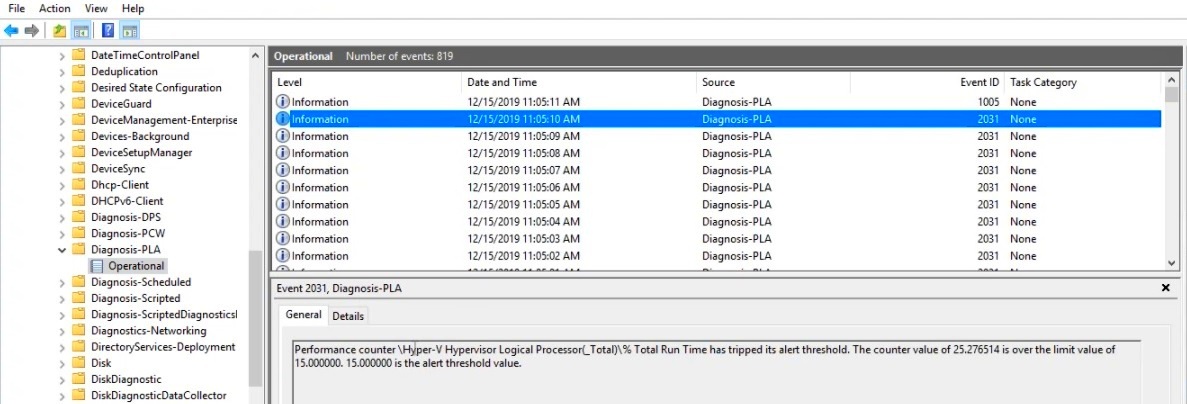
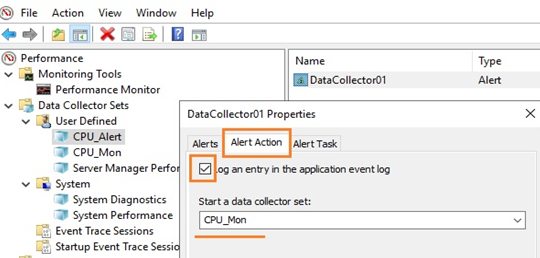
Далее нужно зайти в свойства данной группы сбора информации, перейти на вкладку Alert Action, включить опцию Log an entry in the application event log и запустить группу сбора данных. Когда сработает алерт, в журнале (в консоли Event Viewer в разделе Applications and Services LogsMicrosoftWindowsDiagnosis-PLAOperational) появится запись:
“Performance counter Processor(_Total)% Processor Time has tripped its alert threshold. The counter value of 100.000000 is over the limit value of 50.000000. 50.000000 is the alert threshold value”.
Здесь же рассмотрим и второй случай, когда нужно запустить другую группу сбора данных. Например, алерт срабатывает при достижении высокой загрузки CPU, делает запись в лог, но вы хотите включить сбор данных с других счётчиков для получения дополнительной информации. Для этого необходимо в свойствах алерта в меню Alert Action в выпадающем списке Start a data collector set выбрать ранее созданную группу сбора, например, CPU_Mon. Рядом находится вкладка Alert Task, в которой можно указать разные аргументы либо подключить готовую задачу из консоли Task Scheduler, указав её имя в поле Run this task when an alert is triggered. Будем использовать второй вариант.
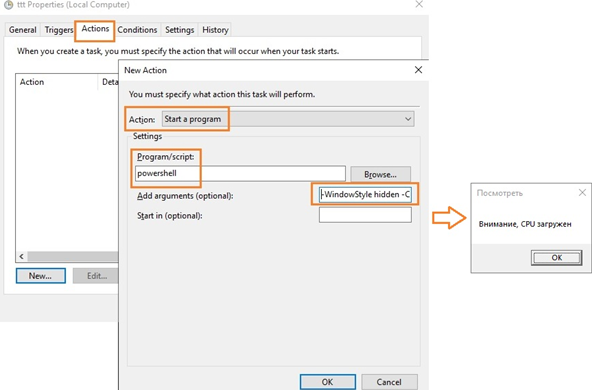
С помощью Task Scheduler можно выполнить какие-то действия: выполнить команду, отправить письмо или вывести сообщение на экран (сейчас последниед ве функции не поддерживаются, считаются устаревшими (deprecated)). Для вывода на уведомления на экран можно использовать скриптом PowerShell. Для этого в консоли Task Scheduler создайте новую задачу, на вкладке Triggers выберите One time, на вкладке Actions в выпадающем поле Action выбирите параметр Start a program, в поле Program/Script укажите powershell.exe, а в поле Add arguments (optional) следующий код:
-WindowStyle hidden -Command "& {[System.Reflection.Assembly]::LoadWithPartialName('System.Windows.Forms'); [System.Windows.Forms.MessageBox]::Show('Внимание, CPU загружен', 'Посмотреть')}"
Для отправки письма вы можете воспользоваться командлетом PowerShell Send-MailMessage или стороннюю утилиту mailsend.exe.. Для этого создайте аналогичное задание в Task Scheduler, в поле Program/Script укажите полный путь к утилите (у нас C:ScriptsMailmailsend.exe), а в поле Add arguments (optional) через параметры нужно передать значения: электронный адрес, адрес и номер порта SMTP-сервера, текст письма и заголовка, пароль:
-to [email protected] -from [email protected] -ssl -port 465 -auth -smtp smtp.ddd.com -sub Alarm -v -user [email protected] +cc +bc -M "Alarm, CPU, Alarm" -pass "it12345"
где +cc означает не запрашивать копию письма, +bc — не запрашивать скрытую копию письма.