Стремительное развитие технологий — наибольшее чудо нашего времени. Человеческая жизнь становится все проще, быстрее и интереснее, и за это нужно поблагодарить компьютеры в любом из их проявлений. Они прошли внушительный эволюционный путь, который превратил громоздкие настольные коробки в более компактные и удобные ноутбуки и смартфоны. В сети то и дело обсуждают их характеристики, но часто забывают про то, что заставляет их работать, — операционные системы. В этой статье собраны самые популярные из их настольных вариантов с уточнением особенностей и возможностей.
1. Windows
- Предназначение: приложения, интернет-серфинг, персональное использование, игры.
- Стоимость: от 199 долларов за Home до 289 долларов за Pro.
- Веб-сайт: Microsoft.
Начиная с Windows 95 и заканчивая Windows 10 — именно операционная система Microsoft считается самой популярной и наиболее знакомой простым пользователям из разных уголков мира. Программное обеспечение компании остается основой современных компьютеров. Его выбирают из-за простоты использования, быстрого запуска и возобновления работы. Последние версии операционной системы отличаются повышенной безопасностью и вниманием к конфиденциальности пользователей. С ней вы и ваши данные находятся под надежной защитой, и особенно переживать за свое личное пространство не приходится.
Особенности:
- удобный пользовательский интерфейс с простой навигацией, меню «Пуск» , в котором собраны ключевые настройки системы, а также установленные приложения;
- простое одновременное использование нескольких рабочих пространств с открытыми окнами приложений;
- специальный режим для использования на устройствах с сенсорным экраном;
- технологии многофакторной аутентификации для повышения безопасности, распознавания отпечатков пальцев и лиц;
- автоматическое уменьшение размера файлов для уменьшения места, используемого в хранилище.
Вывод: Windows считается одной из лучших операционных систем, потому что она развивается продолжительное время. У нее современная система безопасности, а также простой пользовательский интерфейс, который подходит для самых разнообразных устройств.
2. Ubuntu
- Предназначение: приложения, интернет-серфинг, игры.
- Стоимость: бесплатно.
- Веб-сайт: Ubuntu.
Ubuntu — операционная система на базе Linux, которая поставляется со всеми необходимыми инструментами. Она отлично подходит для разнообразных общественных организаций, школ и домашнего использования. Операционная система поддерживается Canonical — глобальным разработчиком программного обеспечения, который сыскал славу на распространении Ubuntu. Она абсолютно бесплатная, и только это должно стать мотивирующим фактором для того, чтобы самостоятельно попробовать ее. Все-таки далеко не все готовы тратиться на программное обеспечение в любом возможном виде.
Особенности:
- это операционная система с открытым исходным кодом, которую можно абсолютно бесплатно скачать, использовать без ограничений и свободно устанавливать любым пользователям;
- в Ubuntu встроен брандмауэр, а также программное обеспечение для защиты от вирусов — это делает ее достаточно безопасной;
- проект развивается уже несколько лет, за которые выходили регулярные обновления и необходимые исправления;
- Ubuntu полностью переведена на 50 различных языков;
- операционная система совместима со всеми новейшими ноутбуками, настольными компьютерами и устройствами с сенсорными экранами.
Вывод: Ubuntu — отличный вариант для тех, кто не хочет тратиться. Это свободная операционная система с открытым кодом, что делает ее достаточно привлекательной для самых разных пользователей. Она регулярно обновляется, отличается удобным интерфейсом и высоким уровнем безопасности.
3. macOS
- Предназначение: эксклюзивные приложения Apple.
- Стоимость: бесплатно с устройствами Apple.
- Веб-сайт: Apple.
Эксклюзивная операционная система Apple, у которой свой путь развития. Ее нельзя полноценно установить ни на одно другое устройство, кроме Mac. Она заточена под конкретное железо, которое использует производитель, и работает на нем максимально гладко. Для macOS подходит только программное обеспечение, которое создано конкретно для этой платформы. За операционную систему не нужно платить — ее стоимость уже вложена в цену далеко не самого дешевого аппаратного обеспечения. На WWDC 2020 Apple объявила о переводе macOS на процессоры собственного производства на базе архитектуры ARM.
Особенности:
- ночная тема оформления интерфейса операционной системы, которая делает работу с ней в вечернее время суток более комфортной;
- возможности для автоматического упорядочивания файлов по типу, дате изменения и другим параметрам;
- тесная интеграция с другими устройствами Apple — к примеру, можно быстро вставить в документ фрагмент, который вы только что сфотографировали на iPhone;
- фирменный магазин приложений с программным обеспечением;
- максимальный уровень безопасности и конфиденциальности данных.
Вывод: Это — одна из наиболее привлекательных операционных систем в визуальном плане. Так как компания развивает программное и аппаратное обеспечение одновременно, она может добиться максимального уровня оптимизации. Эту систему могут полноценно использовать только владельцы Mac.
4. Fedora
- Предназначение: корпоративное использование.
- Стоимость: бесплатно.
- Веб-сайт: Fedora.
Еще одна операционная система, в основу которой лег Linux. Она достаточно надежная и удобная, отлично работает как на настольных компьютерах, так и на ноутбуках. Fedora часто используют в общественных местах со свободным доступом случайных пользователей, а также для разработки.
Особенности:
- удобный пользовательский интерфейс, который не отвлекает от работы;
- полный набор инструментов с открытым исходным кодом;
- использование продвинутых инструментов для виртуализации и запуска виртуальных машин;
- использование контейнерных приложений.
Вывод: операционная система, которую чаще всего выбирают не для личного, а для корпоративного использования. Ее часто используют разработчики программного обеспечения, которые получают бесплатный доступ к полному набору инструментов для создания приложений.
5. Solaris
- Предназначение: обработка информации, работа с базами данных.
- Стоимость: бесплатно.
- Веб-сайт: Solaris.
Операционная система на базе UNIX, которую в середине 90-х разрабатывала Sun Microsystems. В 2010 году, когда компанию выкупила Oracle, платформа получила название Oracle Solaris. Она хорошо известна своей масштабируемостью, а также целым набором других возможностей. К примеру, она поддерживает DTrace — фреймворк динамической трассировки, предназначенный для отладки ядра и приложений в реальном времени. Solaris работает с файловой системой ZFS, которая заточена под объемные массивы данных, а также инструментом резервного копирования Time Slider.
Особенности:
- передовые возможности безопасности, гибкое управление правами пользователей, которое даст возможность защитить критически важные данные;
- неоспоримые преимущества в производительности для веб-служб, баз данных и сервисов Java;
- высокопроизводительная работа с сетью;
- неограниченные возможности для управления файловой системой и базами данных;
- полная совместимость для решения аппаратных и программных вопросов.
Вывод: Oracle Solaris считается одной из лучших среди бесплатных операционных систем с открытым исходным кодом. Она обеспечивает необходимую масштабируемость, функциональную совместимость, управление данными и безопасность, что высоко ценится в корпоративном секторе.
6. Free BSD
- Предназначение: работа с интернетом, интранетом, серверами.
- Стоимость: бесплатно.
- Веб-сайт: Free BSD.
Бесплатная операционная система с открытым исходным кодом на базе UNIX. Она совместима с различными платформами, ориентирована на скорость и стабильность работы. Наиболее захватывающая часть истории платформы — ее создание общими силами сообщества в Калифорнийском университете.
Особенности:
- расширенные возможности для работы в сети, совместимости и безопасности, которые отсутствуют в других операционных системах;
- идеально подходит для услуг интернета и интрасети, может справляться с большими нагрузками и эффективно управлять памятью, чтобы поддерживать работу сразу нескольких пользователей;
- усовершенствованная платформа для работы с высокопроизводительными системами на базе процессоров Intel;
- простая и быстрая установка прямо из сети.
Вывод: надежная операционная система, построенная внушительным сообществом студентов. Она лучше всего подходит для работы в сети, отличается простотой установки и возможностью быстрого одновременного использования сразу несколькими пользователями.
7. Chrome OS
- Предназначение: фирменные веб-приложения.
- Стоимость: бесплатно.
- Веб-сайт: Chrome OS.
Очередная операционная система, которая разработана на базе ядра Linux. За ее создание отвечает компания Google, которая фактически построила программную платформу вокруг своего фирменного браузера Chrome. Она заточена под работу с веб-приложениями.
Особенности:
- встроенные инструменты для автономной работы с мультимедийными файлами;
- удаленный доступ к приложениям и виртуальному рабочему столу;
- полная совместимость со всеми приложениями, разработанными для Android;
- запуск приложений, которые созданы для Linux.
Вывод: неординарная операционная система, которая отлично работает, но все еще не имеет четкого направления для развития. На данный момент она отлично подходит для недорогих компьютеров, общественного использования, мультимедийного контента. Но ее будущее все еще под вопросом.
8. CentOS
- Предназначение: разработка, личное и коммерческое использование.
- Стоимость: бесплатно.
- Веб-сайт: CentOS.
Очередная бесплатная операционная система, развитием которой занимается сообщество. Она пользуется спросом у программистов.
Особенности:
- обширный потенциал для разработчиков, желающих создавать софт и тестировать его;
- расширенные возможности для работы в сети, совместимости и безопасности, которые сейчас отсутствуют во многих других системах;
- инструменты совместимости для решения аппаратных и программных проблем;
- инструменты для тонкой настройки безопасности, управления процессами, настройки доступа к данным.
Вывод: операционную систему чаще всего выбирают разработчики программного обеспечения — для личного и домашнего использования она все же подходит не настолько хорошо. Платформа бесплатно предоставляет создателям приложений все необходимые инструменты для разработки.
9. Debian
- Предназначение: разработка приложений.
- Стоимость: бесплатно.
- Веб-сайт: Debian.
Еще одна бесплатная операционная система с открытым кодом, созданная на базе Linux. Она отличается максимальной легкостью для аппаратного обеспечения, простотой установки, удобным интерфейсом, а также десятками тысяч предварительно скомпилированных приложений в удобном формате.
Особенности:
- высокая скорость работы вне зависимости от «железа»;
- встроенный брандмауэр для защиты данных;
- максимально простая установка;
- расширенные возможности для работы с сетью.
Вывод: от других операционных систем Debian отличается куда меньшей универсальностью, поэтому устанавливать ее нужно лишь в том случае, если у вас есть представление по поводу ее возможностей. Тем не менее, она абсолютно бесплатна, поэтому ничего не мешает попробовать.
10. Deepin
- Предназначение: разработка приложений.
- Стоимость: бесплатно.
- Веб-сайт: Deepin.
Операционная система с открытым исходным кодом, которая основана на стабильной ветке Debian. Она отличается инструментом Deepin Desktop Environment, на базе которого создан удобный пользовательский интерфейс. Ее хвалят за эстетичный и привлекательный внешний вид.
Особенности:
- удобство, надежность и привлекательный интерфейс;
- расширенные возможности безопасности;
- простая установка;
- внушительный набор встроенного программного обеспечения, который включает установщик шрифтов, файловый менеджер, скриншотер, диктофон, просмотрщик изображений и плеер для фильмов.
Вывод: бесплатная операционная система, которая исправляет большинство недостатков Debian. У нее внушительное число модификаций, которые постепенно набирают популярность. Есть вероятность, что в будущем именно эта платформа сможет в полной мере конкурировать с macOS и Windows
Подводя итоги
Для домашнего использования лучше всего подходят Windows и macOS. Первая лучше для игр, а вторая отличается эксклюзивным программным обеспечением и продвинутой работой в экосистеме. Тем не менее, когда речь заходит про скорость работы, в лидеры уверенно выбивается Linux, которому не нужны аппаратные мощности. Чтобы работать на оптимальном уровне, ему даже производительный процессор не понадобится. Операционные системы на базе Linux часто используются в корпоративном секреторе — им отдают работы с массивами информации и базами данных.
Внимания также могут заслуживать менее популярные системы, которые не попали в подборку. Syllable — бесплатная альтернатива домашним платформам. ReactOS — когда-то клон Windows 95, а сегодня отдельная полноценная операционная система.
При работе над статьей использовались материалы Software Testing Help.
- Стандартные курсоры в Windows надоели — нашла 15 альтернатив. Рассказываю, как их установить
- Windows 7 мертва. Как стала лучшей и почему осталась такой до сих пор
- 10 приложений, которые нужно сразу установить на новый компьютер
- Эта скрытая опция Windows ощутимо ускоряет компьютер. Даже очень старый
- Как изменить значок пустой и полной корзины в Windows. Хоть на мемы
The usage share of operating systems is the percentage of computing devices that run each operating system (OS) at any particular time. All such figures are necessarily estimates because data about operating system share is difficult to obtain. There are few reliable primary sources and no agreed methodologies for its collection. Operating systems are used in numerous device types, from embedded devices without a screen through to supercomputers.
Most device types that people interact with access the web, so using web access statistics helps compare the usage share of operating systems across most device types, and also the usage share of operating systems used for the same types.
As of November 2022, Android, an operating system using the Linux kernel, is the world’s most-used operating system when judged by web use. It has 42% of the global market, followed by Windows with 30%, Apple iOS with 18%, macOS with 6%, then (desktop) Linux at 1.0% also using the Linux kernel.[1][2] These numbers do not include embedded devices or game consoles.
- For smartphones and other pocket-sized devices, Android leads with 71% market share, and Apple’s iOS has 28%.[3]
- For desktop and laptop computers, Windows is the most used at 76%, followed by Apple’s macOS at 16%, and Linux-based operating systems at 5% (i.e. «desktop Linux» at 2.6%, plus Google’s ChromeOS at 2.4%, in the US up to 6.2%).[4]
- For tablets, Apple’s iPadOS has 50.7% and Android has 49.18% worldwide[5] (Android is though more used in vast majority of countries;[6] and on occational days Android measures ahead or even, globally[7]).
For the above devices, smartphones and other pocket-sized devices make up 58%, desktops and laptops 40%, and tablets 2.0%.[8] Smartphones have the most use in virtually all countries, including in the US at 51% there with PC operating systems (including Windows) down to 46%.[9][10]
- Linux has completely dominated the supercomputer field since 2017, with all of the top 500 most powerful supercomputers in the world running a Linux distribution. Linux is also most used for (web) servers, and then most often Ubuntu used, the most common Linux distribution.
The most numerous type of device with an operating system are embedded systems. These use varied operating systems; a high percentage are standalone or do not have a web browser, which makes their usage share difficult to measure. Hypothetically some operating systems used in embedded systems are more popular than the ones mentioned above.
Worldwide device shipments[edit]
|
|
This section needs to be updated. Please help update this article to reflect recent events or newly available information. |
In May 2020, Gartner predicted a decline in all market segments for 2020 (from already declining market in 2019) due to COVID-19, predicting a decline by 13.6% for all devices, while «Work from Home Trend Saved PC Market from Collapse», with them only predicting to decline by 10.5% for PCs. However, in the end according to Gartner, PC shipments grew «10.7% in Fourth Quarter of 2020 and […] reached 275 million units in 2020, a 4.8% increase from 2019 and the highest growth in ten years.» Apple in 4th place for PCs had the largest growth in shipments for a company in Q4 of 31.3%, while «the fourth quarter of 2020 was another remarkable period of growth for Chromebooks, with shipments increasing around 200% year over year to reach 11.7 million units. In 2020, Chromebook shipments increased over 80% to total nearly 30 million units, largely due to demand from the North American education market.»[12] Chromebooks sold more than Apple’s Macs worldwide.
According to Gartner, the following is the worldwide device shipments (referring to wholesale) by operating system, which includes smartphones, tablets, laptops and PCs together.
| Source | Year | Android | iOS/macOS | Windows | Others |
|---|---|---|---|---|---|
| Gartner[13] | 2019 (2.161 bln) | ||||
| Gartner[14] | 2017 (2.278 bln) | ||||
| Gartner[15] | 2016 (2.332 bln) | 10.63% (248 mln) | 11.2% (260 mln) | ||
| Gartner[11] | 2015 (2.4 bln) | 54.16% (1.3 bln) | 12.37% (297 mln)
macOS = 1% |
11.79% (283 mln) | 21.66% |
| Gartner[16] | 2014 | 48.61% | 11.04% | 14.0% | 26.34% |
| Gartner[17] | 2013 | 38.51% | 10.12% | 13.98% | 37.41% |
| Gartner[18] | 2012 | 22.8% | 9.6% | 15.62% | 51.98% |
Shipments (to stores) do not mean sales to consumers (not necessarily in the year of shipment), therefore suggesting the numbers indicate popularity and/or usage could be misleading. Not only do smartphones sell in higher numbers than traditional PCs – but also as a whole a lot more, by dollar value – with the gap only projected to widen, to well over double.[19]
For 2015 (and earlier), Gartner reports for «the year, worldwide PC shipments declined for the fourth consecutive year, which started in 2012 with the launch of tablets» with an 8% decline in PC sales for 2015 (not including cumulative decline in sales over the previous years).[20] Gartner includes Macs (running macOS) in PC sales numbers (but not e.g. iPads and Androids), and they individually had a slight increase in sales in 2015.
On 28 May 2015, Google announced that there were 1.4 billion Android users and 1 billion Google play users active during that month.[21][22] This changed to 2 billion monthly active users in May 2017.[23][24]
On 27 January 2016, Paul Thurrott summarized the operating system market, the day after Apple announced «one billion devices»:
Apple’s «active installed base» is now one billion devices. [..] Granted, some of those Apple devices were probably sold into the market place years ago. But that 1 billion figure can and should be compared to the numbers Microsoft touts for Windows 10 (200 million, most recently) or Windows more generally (1.5 billion active users, a number that hasn’t moved, magically, in years), and that Google touts for Android (over 1.4 billion, as of September).
My understanding of iOS is that the user base was previously thought to be around 800 million strong, and when you factor out Macs and other non-iOS Apple devices, that’s probably about right. But as you can see, there are three big personal computing platforms.— Paul Thurrott[25]
Microsoft backed away from their goal of one billion Windows 10 devices in three years (or «by the middle of 2018»)[26] and reported on 26 September 2016 that Windows 10 was running on over 400 million devices,[27] and in March 2019 on more than 800 million.[28]
By late 2016, Android had been explained to be «killing» Apple’s iOS market share (i.e. its declining sales of smartphones, not just relatively but also by number of units, when the whole market is increasing) with
the gap between the two is growing ever larger all the time.
According to Gartner, Android now boasts a global market share of 86.2 percent. Apple’s iOS is a long way behind with a market share of just 12.9 percent. The rest may as well not even exist [..]
These figures, which cover the second quarter of 2016, show that Android has actually increased its market share by 4 percent over the last year. All other operating systems are down, with iOS losing 1.7 percent [..]
I think it’s fair to declare Android the winner in the mobile operating [system] wars at this point.
— makeuseof.com[29]
As of 9 May 2019, the biggest smartphone companies (by market share) were Samsung, Huawei and Apple, respectively.[30]
Gartner’s own press release said, «Apple continued its downward trend with a decline of 7.7 percent in the second quarter of 2016»,[31] which is their decline, based on absolute number of units, that underestimates the relative decline (with the market increasing), along with the misleading «1.7 percent [point]» decline. That point decline means an 11.6% relative decline (from 14.6% down to 12.9%).
Although in units sold Apple is declining, they are almost the only vendor making any profit in the smartphone sector from hardware sales alone. In Q3 2016 for example, they captured 103.6% of the market profits.[32]
There are more mobile phone owners than toothbrush owners,[33] with mobile phones the fastest growing technology in history.[citation needed] There are a billion more active mobile phones in the world than people (and many more than 10 billion sold so far with less than half still in use), explained by the fact that some people have more than one, such as an extra for work.[34] All the phones have an operating system, but only a fraction of them are smartphones with an OS capable of running modern applications. Currently 3.1 billion smartphones and tablets are in use across the world (with tablets, a small fraction of the total, generally running the same operating systems, Android or iOS, the latter being more popular on tablets. In 2019, a variant of iOS called iPadOS built for iPad tablets was released).
Tablet computers shipments[edit]
In 2015, eMarketer estimated at the beginning of the year that the tablet installed base would hit one billion[35] for the first time (with China’s use at 328 million, which Google Play doesn’t serve or track, and the United States’s use second at 156 million). At the end of the year, because of cheap tablets – not counted by all analysts – that goal was met (even excluding cumulative sales of previous years) as:
Sales quintupled to an expected 1 billion units worldwide this year, from 216 million units in 2014, according to projections from the Envisioneering Group.
While that number is far higher than the 200-plus million units globally projected by research firms IDC, Gartner and Forrester, Envisioneering analyst Richard Doherty says the rival estimates miss all the cheap Asian knockoff tablets that have been churning off assembly lines.[..]
Forrester says its definition of tablets «is relatively narrow» while IDC says it includes some tablets by Amazon — but not all.[..]
The top tech purchase of the year continued to be the smartphone, with an expected 1.5 billion sold worldwide, according to projections from researcher IDC. Last year saw some 1.2 billion sold.[..]
Computers didn’t fare as well, despite the introduction of Microsoft’s latest software upgrade, Windows 10, and the expected but not realized bump it would provide for consumers looking to skip the upgrade and just get a new computer instead.
Some 281 million PCs were expected to be sold, according to IDC, down from 308 million in 2014. Folks tend to be happy with the older computers and keep them for longer, as more of our daily computing activities have moved to the smartphone.[..]
While Windows 10 got good reviews from tech critics, only 11% of the 1-billion-plus Windows user base opted to do the upgrade, according to Microsoft. This suggests Microsoft has a ways to go before the software gets «hit» status. Apple’s new operating system El Capitan has been downloaded by 25% of Apple’s user base, according to Apple.
This conflicts with statistics from IDC that say the tablet market contracted by 10% in 2015 with only Huawei, ranked fifth, with big gains, more than doubling their share; for fourth quarter 2015, the five biggest vendors were the same except that Amazon Fire tablets ranked third worldwide, new on the list, enabled by its not quite tripling of market share to 7.9%, with its Fire OS Android-derivative.[37]
| Source | Year | Android | iOS | Windows | Others |
|---|---|---|---|---|---|
| Strategy Analytics[38] | Q2 2022 | 49% | 38% | 11% | 2% |
| Statista[39] | 2020 | 59.4% | 29.8% | 10.21% | 0.59% |
| Strategy Analytics[40] | 2015 | 68% | 22% | 10% | <0.1% |
| Gartner[41] | 2013 | 61.9% | 36.0% | 2.1% | <0.1% |
| Gartner[41] | 2012 | 45.8% | 52.8% | 1.0% | 0.3% |
Gartner excludes some devices from their tablet shipment statistic and includes them in a different category called «premium ultramobiles» with screen sizes of more than 10″ inches.[42]
Smartphone shipments[edit]
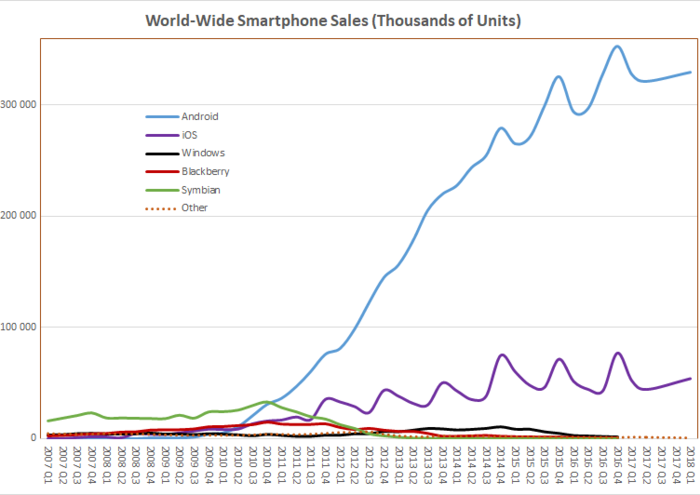
Worldwide smartphone sales to end users by operating systems, as measured by Gartner, International Data Corporation (IDG) and others:
| Source | Method | Quarter/month | Android (including forks) |
iOS | Windows (all versions) |
BlackBerry (all versions) |
Symbian | Others |
|---|---|---|---|---|---|---|---|---|
| Statista[43] | based on page views per month worldwide | 2022 Q4 | 71.1% | 28.3% | N/A | N/A | N/A | 0.6% |
| Gartner[44] | Units sold in quarter | 2018 Q1 | 85.9% | 14.1% | N/A | N/A | N/A | 0.0% |
| Gartner[45] | Units sold per year | 2017 | 85.9% | 14.0% | N/A | N/A | N/A | 0.1% |
| Gartner[46] | Units sold in quarter | 2017 Q1 | 86.1% | 13.7% | N/A | N/A | N/A | 0.2% |
| Gartner[47] | Units sold per year | 2016 | 84.8% | 14.4% | N/A | N/A | N/A | 0.8% |
| Gartner[48] | Units sold in quarter | 2016 Q4 | 81.7% | 17.9% | 0.3% | 0.0% | N/A | 0.1% |
| Gartner[49] | Units sold in quarter | 2016 Q3 | 87.8% | 11.5% | 0.4% | 0.1% | N/A | 0.2% |
| Gartner[50] | Units sold in quarter | 2016 Q2 | 86.2% | 12.9% | 0.6% | 0.1% | N/A | 0.2% |
| Gartner[51] | Units sold in quarter | 2016 Q1 | 84.1% | 14.8% | 0.7% | 0.2% | N/A | 0.2% |
| Gartner[52] | Units sold in quarter | 2015 Q4 | 80.7% | 17.7% | 1.1% | 0.2% | N/A | 0.2% |
| Gartner[53] | Units sold in quarter | 2015 Q2 | 82.2% | 14.6% | 2.5% | 0.3% | N/A | 0.4% |
| Gartner[54] | Units sold in quarter | 2014 Q4 | 76.0% | 20.4% | 2.8% | 0.5% | N/A | 0.4% |
| Strategy Analytics[55] | Units shipped in quarter | 2014 Q3 | 81.3% | 13.4% | 4.1% | 1.0% | N/A | 0.2% |
| Gartner[56] | Units sold in quarter | 2014 Q2 | 83.8% | 12.2% | 2.8% | 0.7% | N/A | 0.5% |
| Gartner[57] | Units sold in quarter | 2013 Q2 | 79.0% | 14.2% | 3.3% | 2.7% | 0.3% | 0.6% |
| Gartner[58] | Units sold in quarter | 2013 Q1 | 74.4% | 18.2% | 2.9% | 3.0% | 0.6% | 1.0% |
| International Data Corporation[59] | Units shipped in quarter | 2013 Q1 | 75.0% | 17.3% | 3.2% | 2.9% | 0.6% | 0.0% |
Web clients[edit]
|
|
This section needs to be updated. Please help update this article to reflect recent events or newly available information. |
| Web clients’ OS family statistics | ||
|---|---|---|
| Android (or based on) | 42.67% | |
| Windows | 29.56% | |
| Apple’s iOS | 17.38% | |
| Apple’s macOS | 6.07% | |
| Unknown | 2.04% | |
| Other | 1.25% | |
| Linux | 0.98% | |
| Web clients’ OS family market share according to StatCounter for April 2022.[60] The information on web clients is obtained from user agent information obtained through JavaScript code run by web browsers supplied to web servers. «Unknown» is probably mostly Windows operating systems.[citation needed] These figures have a large margin of error for a variety of reasons. For a discussion on the shortcomings see usage share of web browsers. |
The most recent data from various sources published during the last twelve months is summarized in the table below. All of these sources monitor a substantial number of web sites; statistics related to one web site only are excluded.
Android currently ranks highest,[61] above Windows (incl. Xbox console) systems. Windows Phone accounted for 0.51% of the web usage, before it was discontinued.[62]
Considering all personal computing devices, Microsoft Windows is well below 50% usage share on every continent, and at 30% in the US (24% single-day low) and in many countries lower, e.g. China, and in India at 19% (12% some days) and Windows’ lowest share globally was 29% in May 2022 (25% some days), and 29% in the US.[63]
iOS is slightly more popular than Windows in the US, and has been more used the last 6 months, on a monthly average basis,[64] or for up to 11 weeks in a row (weekly average).[65] That’s because it’s much more popular on the weekends, while Windows usually more used on weekdays. iOS has however been more used for up to almost 2 weeks, every day of that time-span, and even on some days, such as 29 May 2022, Android is also more used than Windows meaning iOS and Android are up to 2.6× more used than Windows there.[66] Worldwide, Android at 43.23% is 48% more used than Windows, next at 29.2%, and iOS third at 17.67% meaning the mobile operating systems Android and iOS are combined a bit over 2× more popular then Windows. In Africa, Android at 62.66% (for May alone is 3.3× (almost 4× with iOS) than Windows at 18.81 (and iOS third at 10.74%).[67] For a 12-month average Android is only 2.1× more popular than Windows in Africa.
Before iOS became the most popular operating system in any independent country, it was most popular in Guam, an unincorporated territory of the United States, for four consecutive quarters in 2017-18,[68][69] although Android is now the most popular there.[70] iOS has been the highest ranked OS in Jersey (a British Crown dependency in Europe) for years, by a wide margin, and iOS was also highest ranked in Falkland Islands, a British Overseas Territory, for one quarter in 2019, before being overtaken by Android in the following quarter.[71][72] iOS is competitive with Windows in Sweden, where some days it is more used.[73]
The designation of an «Unknown» operating system is strangely high in a few countries such as Madagascar where it was at 32.44% (no longer near as high).[74] This may be due to the fact that StatCounter uses browser detection to get OS statistics, and there the most common browsers are not often used. The version breakdown for browsers in Madagascar shows «Other» at 34.9%,[75] and Opera Mini 4.4 is the most popular known browser at 22.1% (plus e.g. 3.34% for Opera 7.6). However browser statistics without version-breakdown has Opera at 48.11% with the «Other» category very small.[76][clarification needed]
In China, Android got to be the highest ranked operating system in July 2016 (Windows has occasionally topped it since then, while since April 2016 it or all non-mobile operating systems haven’t outranked mobile operating systems, meaning Android plus iOS).[77] In the Asian continent as a whole, Android has been ranked highest since February 2016 and Android alone has the majority share,[78] because of a large majority in all the most populous countries of the continent, up to 84% in Bangladesh, where it has had over 70% share for over four years.[79] Since August 2015, Android is ranked first, at 48.36% in May 2016, in the African continent – when it took a big jump ahead of Windows 7,[80] and thereby Africa joined Asia as a mobile-majority continent. China is no longer a desktop-majority country,[81] joining India, which has a mobile-majority of 71%, confirming Asia’s significant mobile-majority.
Online usage of Linux kernel derivatives (Android + ChromeOS + other Linux) exceeds that of Windows. This has been true since some time between January and April 2016, according to W3Counter[82] and StatCounter.[83]
However, even before that, the figure for all Unix-like OSes, including those from Apple, was higher than that for Windows.
| Source | Date | Microsoft Windows (kernel): |
Apple Darwin: |
Linux kernel: |
Others:[b] | |||||||||
|---|---|---|---|---|---|---|---|---|---|---|---|---|---|---|
| 10 | 8/8.1 | 7 | Vista | XP | WP&RT | Other | macOS | iOS | Linux | Android | Other | |||
| W3Counter[84] | Oct 2022 | N/A | N/A | N/A | N/A | N/A | N/A | N/A | N/A | |||||
| W3Counter[85] | Oct
2020 |
20.55% |
N/A | 6.74% |
N/A | N/A | N/A | N/A | 8.06% |
13.67% |
N/A | 37.44% |
N/A | N/A |
| W3Counter[86] | Jun 2019 | N/A | N/A | N/A | N/A | N/A | N/A | N/A | N/A | |||||
| W3Counter[86] | Jun 2018 | N/A | N/A | N/A | N/A | N/A | N/A | N/A | N/A | |||||
| W3Counter[87] | Dec 2016 | N/A | N/A | N/A | N/A | N/A | ||||||||
| StatCounter Global Stats[88] | Mar 2017 | 0% | ||||||||||||
| StatCounter Global Stats[88] | Dec 2016 | |||||||||||||
| StatCounter Global Stats[89] | Oct 2016 | |||||||||||||
| StatCounter Global Stats[90] | May 2016 | |||||||||||||
| StatCounter Global Stats[90] | Dec 2015 | |||||||||||||
| Wikimedia[91] | Dec 2016 | 14.0% | 4.65% | 18.0% | 0.43% | 1.70% | 0.93% | 0.50% | 5.4% | 19.0% | 0.80% | 23.0% | 0.30% | 11.29% |
Desktop and laptop computers[edit]
|
|
This section needs to be updated. Please help update this article to reflect recent events or newly available information. |
Windows is still the dominant desktop OS, but the dominance varies by region and it has gradually lost market share to other desktop operating systems (not just to mobile) with the slide very noticeable in the US, where macOS usage has more than quadrupled from Jan. 2009 to Dec. 2020 to 30.62% (i.e. in Christmas month; and 34.72% in April 2020 in the middle of COVID-19, and iOS was more popular overall that year;[93] globally Windows lost to Android that year,[94] as for the two years prior), with Windows down to 61.136% and ChromeOS at 5.46%, plus traditional Linux at 1.73%.[95]
There is little openly published information on the device shipments of desktop and laptop computers. Gartner publishes estimates, but the way the estimates are calculated is not openly published. Another source of market share of various operating systems is StatCounter[96] basing its estimate on web use (although this may not be very accurate). Also, sales may overstate usage. Most computers are sold with a pre-installed operating system, with some users replacing that OS with a different one due to personal preference, or installing another OS alongside it and using both. Conversely, sales underestimate usage by not counting unauthorized copies. For example, in 2009, approximately 80% of software sold in China consisted of illegitimate copies.[97] In 2007, the statistics from an automated update of IE7 for registered Windows computers differed with the observed web browser share, leading one writer to estimate that 25–35% of all Windows XP installations were unlicensed.[98]
The usage share of Microsoft’s (then latest operating system) Windows 10 has slowly increased since July/August 2016, reaching around 27.15% (of all Windows versions, not all desktop or all operating systems) in December 2016. It eventually reached 79.79% on 5 October 2021, the same day on which its successor Windows 11 was released.
Web analysis shows significant variation in different parts of the world. For example, macOS use varies a lot by region, in North America claims 16.82%[99] (17.52%[100] in the US) whereas in Asia it is only 4.4%.[101] In the United States usage of Windows XP has dropped to 0.38% (of all Windows versions), and its global average to 0.59%, while in Africa it is still at 2.71%, and it still has double-digit share in at least one country.[102]
Since mid-2020, the world uses smartphones more than desktop (including laptop) computers.[103][104][105] For global statistics it’s every day of the week. It has also happened for all individual continents (at least for some weeks, and also for the United States[106][107][108][109] where the smartphone share has gone up to 54%, both on July 9, 2019, a Sunday,[110] and also that high in 2021). The proportions do vary widely by region (more so than by the day), e.g. in Africa the smartphone share is highest at 69%, in Asia at 65% and in South America at 50.19%, while in the United States it’s at 46% and desktop at 50%. On some continents, e.g. North America and the US, smartphone use may only go over 50% on weekends, since smartphones usage increases on weekends,[111][112][113][114] while the smartphone share has gone up to 54% for a single day (Thanksgiving), and on average over 50% for full week.[115][116]
Smartphones (58.01%)
Desktops/Laptops (39.49%)
Tablets (2.46%)
Console (0.06%)
The 2019 Stack Overflow developer survey provides no detail about particular versions of Windows. The desktop operating system share among those identifying as professional developers was:[117]
- Windows: 45.3%
- macOS: 29.2%
- Linux: 25.3%
- BSD/Unix: 0.1%
Microsoft data on Windows usage[edit]
In June 2016, Microsoft claimed Windows 10 had half the market share of all Windows installations in the US and UK, as quoted by BetaNews:
Microsoft’s Windows trends page [shows] Windows 10 hit 50 percent in the US (51 percent in the UK, 39 percent globally), while … Windows 7 was on 38 percent (36 percent in the UK, 46 percent globally).
A big reason for the difference in numbers comes down to how they are recorded. … actual OS usage (based on web browsing), while Microsoft records the number of devices Windows 10 is installed on. … Microsoft also only records Windows 7, Windows 8, Windows 8.1 and Windows 10, while NetMarketShare includes both XP and Vista.— BetaNews[118]
Desktop computer games[edit]
The digital video game distribution platform Steam publishes a monthly «Hardware & Software Survey», with the statistics below:
| Month | Microsoft Windows | Mac OS† | Linux† | Other |
|---|---|---|---|---|
| December 2022[119] | 96.15% | 2.48% | 1.38% | |
| December 2021 | 96.19% | 2.70% | 1.11% | |
| December 2020[119] | 96.41% | 2.82% | 0.78% | |
| December 2019[120] | 96.89% | 2.47% | 0.67% | |
| January 2019[121] | 95.92% | 3.27% | 0.82% | |
| January 2018[122] | 98.38% | 1.31% | 0.25% | |
| January 2017[123] | 95.79% | 3.31% | 0.80% | |
| January 2016[124] | 95.39% | 3.55% | 0.95% | |
| January 2015[125] | 95.48% | 3.32% | 1.09% | |
| January 2014[126] | 94.93% | 3.47% | 0.86% | 0.74% |
^† These figures, as reported by Steam, do not include SteamOS statistics.[127]
Mobile devices[edit]
Smartphones OS by usage[edit]

By Q1 2018, mobile operating systems on smartphones included Google’s dominant Android (and variants) and Apple’s iOS which combined had an almost 100% market share.[128]
Smartphone penetration vs. desktop use differs substantially by country. Some countries, like Russia, still have smartphone use as low as 22.35% (as a fraction of all web use),[129] but in most western countries, smartphone use is close to 50% of all web use. This doesn’t mean that only half of the population has a smartphone, could mean almost all have, just that other platforms have about equal use. Smartphone usage share in developing countries is much higher – in Bangladesh, for example, Android smartphones had up to 84% and currently 70% share,[79] and in Mali smartphones had over 90% (up to 95%) share for almost two years.[130][131] (A section below has more information on regional trends on the move to smartphones.)
There is a clear correlation between the GDP per capita of a country and that country’s respective smartphone OS market share, with users in the richest countries being much more likely to choose Apple’s iPhone, with Google’s Android being predominant elsewhere.[132][133][134]
| Source | Method | Quarter/month | Android (including forks) |
iOS | Windows (all versions) |
BlackBerry (all versions) |
Symbian | Others |
|---|---|---|---|---|---|---|---|---|
| StatCounter Global Stats[135] | Browsing (page view) | 2021, Oct | 71.09% | 28.21% | 0.01% | N/A | N/A | 0.69% |
| StatCounter Global Stats[136] | Browsing (page view) | 2020, Oct | 72.93% | 26.53% | 0.03% | N/A | N/A | 0.51% |
| StatCounter Global Stats | Browsing (page view) | 2019, Sep | 76.24% | 22.48% | 0.17% | 0.02% | 0.02% | 1.07% |
| StatCounter Global Stats[137] | Browsing (page view) | 2015, Mar | 61.94% | 22.64% | 2.27% | NA | 6.00% | 7.09% |
| StatCounter Global Stats[137] | Browsing (page view) | 2014, Aug | 54.87% | 23.57% | 2.36% | 1.59% | 9.73% | 7.87% |
| StatCounter Global Stats[137] | Browsing (page view) | 2014, Feb | 47.57% | 22.97% | 2.22% | 2.62% | 14.86% | 6.08% |
| Wikimedia (includes tablets)[d] | Browsing (page view) | 2013, Mar | 25.93% | 66.53% | 1.85% | 2.02% | 3.03% | 1.12% |
| Source | Method | Quarter/month | Android (including forks) |
iOS | Windows (all versions) |
BlackBerry (all versions) |
Symbian | Others |
|---|---|---|---|---|---|---|---|---|
| comScore[138] (US only) | US subscribers | 2017, Jan | 52.0% | 43.9% | 1.5% | 0.5% | N/A | N/A |
| comScore[139] (US only) | US subscribers | 2016, Jan | 52.8% | 43.6% | 2.7% | 0.8% | N/A | N/A |
| comScore[140] (US only) | US subscribers | 2015, Jan | 53.2% | 41.3% | 3.6% | 1.8% | 0.1% | N/A |
| comScore[141] (US only) | US subscribers | 2014, Jan | 51.7% | 41.6% | 3.2% | 3.1% | 0.2% | N/A |
| comScore[142] (US only) | US subscribers | 2012, Feb | 50.1% | 30.2% | 3.9% | 13.4% | 1.5% | N/A |
| comScore[143] (US only) | US subscribers | 2010, Dec | 28.7% | 25.0% | 8.4% | 31.6% | N/A | 3.7% |
Tablet computers OS by usage[edit]
|
|
This section needs to be updated. Please help update this article to reflect recent events or newly available information. |
Tablet computers, or simply tablets, became a significant OS market share category starting with Apple’s iPad. In Q1 2018, iOS had 65.03% market share and Android had 34.58% market share.[144] Windows tablets may not get classified as such by some analysts, and thus barely register; e.g. 2-in-1 PCs may get classified as «desktops», not tablets.
Since 2016, in South America (and Cuba[145] in North America), Android tablets have gained majority,[146] and in Asia in 2017 Android was slightly more popular than the iPad, which was at 49.05% usage share in October 2015.[147][148][149] In Africa, Android tablets are much more popular while elsewhere the iPad has a safe margin.
As of March 2015, Android has made steady gains to becoming the most popular tablet operating system:[150] that is the trend in many countries, having already gained the majority in large countries (India at 63.25%,[151] and in Indonesia at 62.22%[152]) and in the African continent with Android at 62.22% (first to gain Android majority in late 2014),[153] with steady gains from 20.98% in August 2012[154] (Egypt at 62.37%,[155] Zimbabwe at 62.04%[155]), and South America at 51.09% in July 2015.[156] (Peru at 52.96%[157]). Asia is at 46%.[158] In Nepal, Android gained majority lead in November 2014 but lost it down to 41.35% with iOS at 56.51%.[159] In Taiwan, as of October 2016, Android after having gained a confident majority, has been on a losing streak.[160] China is a major exception to Android gaining market share in Asia (there Android phablets are much more popular than Android tablets, while similar devices get classified as smartphones) where the iPad/iOS is at 82.84% in March 2015.[161]
| Source | Month | iOS | Android | Windows | Others |
|---|---|---|---|---|---|
| StatCounter[162] | Oct 2020 | 58.86% | 41.02% | 0.08% | 0.04% |
| StatCounter[163] | Dec 2019 | 63.11% | 36.65% | 0.15% | 0.09% |
| StatCounter[164] | Jul 2018 | 65.03% | 34.58% | 0.21% | 0.18% |
| StatCounter[165] | Jul 2015 | 65.51% | 31.36% | 0.78% | 2.93% |
| StatCounter[166] | Feb 2015 | 66.47% | 29.6% | 1.16% | 2.73% |
| StatCounter[167] | Oct 2014 | 71.67% | 25.62% | 0.08% | 2.63% |
[edit]
|
|
This section needs to be updated. Please help update this article to reflect recent events or newly available information. |
According to StatCounter web use statistics (a proxy for all use), smartphones are more popular than desktop computers globally (and Android in particular more popular than Windows). Including tablets with mobiles/smartphones, as they also run so-called mobile operating systems, even in the United States (and most countries) are mobiles including tablets more popular than other (older originally made for desktops) operating systems (such as Windows and macOS). Windows in the US (at 33.42%) has only 8% head-start (2.55-percentage points) over iOS only; with Android, that mobile operating system and iOS have 52.14% majority.[168] Alternatively, Apple, with iOS plus their non-mobile macOS (9.33%) has 20% more share (6.7-percentage points more) than Microsoft’s Windows in the country where both companies were built.
Although desktop computers are still popular in many countries (while overall down to 44.9% in the first quarter of 2017[169]), smartphones are more popular even in many developed countries. A few countries on all continents are desktop-minority with Android more popular than Windows; many, e.g. Poland in Europe, and about half of the countries in South America, and many in North America, e.g. Guatemala, Honduras, Haiti; up to most countries in Asia and Africa[170] with smartphone-majority because of Android, Poland and Turkey in Europe highest with 57.68% and 62.33%, respectively. In Ireland, smartphone use at 45.55% outnumbers desktop use and mobile as a whole gains majority when including the tablet share at 9.12%.[171][172] Spain was also slightly desktop-minority. As of July 2019, Sweden had been desktop-minority for eight weeks in a row.[173]
The range of measured mobile web use varies a lot by country, and a StatCounter press release recognizes «India amongst world leaders in use of mobile to surf the internet»[174] (of the big countries) where the share is around (or over) 80%[175] and desktop is at 19.56%, with Russia trailing with 17.8% mobile use (and desktop the rest).
Smartphones (discounting tablets), first gained majority in December 2016 (desktop-majority was lost the month before),[where?] and it wasn’t a Christmas-time fluke, as while close to majority after smartphone majority happened again in March 2017.[176][clarification needed]
In the week of 7–13 November 2016, smartphones alone (without tablets) overtook desktop for the first time, albeit for a short period.[177] Examples of mobile-majority countries include Paraguay in South America, Poland in Europe and Turkey and most of Asia and Africa. Some of the world is still desktop-majority, with for example the United States at 54.89% (but not on all days).[178] However, in some territories of the United States, such as Puerto Rico,[179] desktop is significantly under majority, with Windows just under 25%, overtaken by Android.
On 22 October 2016 (and subsequent weekends), mobile showed majority.[180] Since 27 October, the desktop hasn’t had a majority, including on weekdays. Smartphones alone have showed majority since 23 December to the end of the year, with the share topping at 58.22% on Christmas Day.[181] To the «mobile»-majority share of smartphones, tablets could be added giving a 63.22% majority. While an unusually high top, a similar high also occurred on Monday 17 April 2017, with the smartphone share slightly lower and tablet share slightly higher, combining to 62.88%.
Formerly, according to a StatCounter press release, the world has turned desktop-minority;[182] as of October 2016, at about 49% desktop use for that month, but mobile wasn’t ranked higher, tablet share had to be added to it to exceed desktop share.
For the Christmas season (i.e. temporarily, while desktop-minority remains and smartphone-majority on weekends[183][184]), the last two weeks in December 2016, Australia (and Oceania in general)[185] was desktop-minority for the first time for an extended period, i.e. every day from 23 December.[186]
In South America, smartphones alone took majority from desktops on Christmas Day,[184] but for a full-week-average, desktop is still at least at 58%.[187]
The UK desktop-minority dropped down to 44.02% on Christmas Day and for the eight days to the end of the year.[188] Ireland joined some other European countries with smartphone-majority, for three days after Christmas, topping that day at 55.39%.[189][190]
In the US, desktop-minority happened for three days on and around Christmas (while a longer four-day stretch happened in November, and happens frequently on weekends).[191]
According to StatCounter web use statistics (a proxy for all use), in the week from 7–13 November 2016, «mobile» (meaning smartphones) alone (without tablets) overtook desktop, for the first time, with them highest ranked at 52.13% (on 27 November 2016)[192] or up to 49.02% for a full week.[193][194] Mobile-majority applies to countries such as Paraguay in South America, Poland in Europe and Turkey; and the continents Asia and Africa. Large regions of the rest of the world are still desktop-majority, while on some days, the United States,[195] (and North America as a whole)[196] isn’t; the US is desktop-minority up to four days in a row,[197] and up to a five-day average.[198] Other examples, of desktop-minority on some days, include the UK,[196] Ireland,[199] Australia[200] (and Oceania as a whole); in fact, at least one country on every continent[201][202][203] has turned desktop-minority (for at least a month). On 22 October 2016 (and subsequent weekends), mobile has shown majority.[204]
Previously, according to a StatCounter press release, the world has turned desktop-minority;[205] as of October 2016, at about 49% desktop use for that month,[206][207] with desktop-minority stretching up to an 18-weeks/4-months period from 28 June to 31 October 2016,[208][209] while whole of July, August or September 2016, showed desktop-majority (and many other long sub-periods in the long stretch showed desktop-minority; similarly only Fridays, Saturdays and Sundays are desktop-minority). The biggest continents, Asia and Africa, have shown vast mobile-majority for long time (any day of the week), as well as several individual countries elsewhere have also turned mobile-majority: Poland, Albania (and Turkey)[210] in Europe and Paraguay and Bolivia[211] in South America.[212]
According to StatCounter’s web use statistics, Saturday 28 May 2016, was the day when smartphones («mobile» at StatCounter, that now counts tablets separately) became a most used platform, ranking first, at 47.27%, above desktops.[213][214] The next day, desktops slightly outnumbered «mobile» (unless counting tablets: some analysts count tablets with smartphones or separately while others with desktops – even when most tablets are iPad or Android, not Windows devices).[215]
Since Sunday 27 March 2016, the first day the world dipped to desktop-minority,[216] it has happened almost every week, and by week of 11–17 July 2016, the world was desktop-minority,[217] followed by the next week, and thereon also for a three-week period.[218] The trend is still stronger on weekends, with e.g. 17 July 2016 showed desktop at 44.67%, «mobile» at 49.5% plus tablets at 5.7%.[219] Recent weekly data shows a downward trend for desktops.[220][221]
According to StatCounter web use statistics (a proxy for overall use), on weekends desktops worldwide lose about 5 percent points, e.g. down to 51.46% on 15 August 2015, with the loss in (relative) web use going to mobile (and also a minuscule increase for tablets),[222] mostly because Windows 7, ranked 1st on workdays, declines in web use, with it shifting to Android and lesser degree to iOS.[223]
Two continents, have already crossed over to mobile-majority (because of Android), based on StatCounters web use statistics. In June 2015, Asia became the first continent where mobile overtook desktop[224] (followed by Africa in August;[225] while Nigeria had mobile majority in October 2011,[226][227] because of Symbian – that later had 51% share, then Series 40 dominating, followed by Android as dominating operating system[228]) and as far back as October 2014, they had reported this trend on a large scale in a press release: «Mobile usage has already overtaken desktop in several countries including India, South Africa and Saudi Arabia».[229] In India, desktop went from majority, in July 2012, down to 32%.[230] In Bangladesh desktop went from majority, in May 2013, down to 17%, with Android alone now accounting for majority web use.[231] Only a few African countries were still desktop-majority[232] and many have a large mobile majority including Ethiopia and Kenya, where mobile usage is over 72%.[233]
The popularity of mobile use worldwide has been driven by the huge popularity increase of Android in Asian countries, where Android is the highest ranked operating system statistically in virtually every south-east Asian country,[234] while it also ranks most popular in almost every African country. Poland has been desktop-minority since April 2015,[235] because of Android being vastly more popular there,[236] and other European countries, such as Albania (and Turkey), have also crossed over. The South America continent is somewhat far from losing desktop-majority, but Paraguay had lost it as of March 2015.[237] Android and mobile browsing in general has also become hugely popular in all other continents where desktop has a large desktop base and the trend to mobile is not as clear as a fraction of the total web use.
While some analysts count tablets with desktops (as some of them run Windows), others count them with mobile phones (as the vast majority of tablets run so-called mobile operating systems, such as Android or iOS on the iPad). iPad has a clear lead globally, but has clearly lost the majority to Android in South America,[238] and a number of Eastern European countries such as Poland; lost virtually all African countries and has lost the majority twice in Asia, but gained the majority back (while many individual countries, e.g. India and most of the middle East have clear Android majority on tablets).[239] Android on tablets is thus second most popular after the iPad.[240]
In March 2015, for the first time in the US the number of mobile-only adult internet users exceeded the number of desktop-only internet users with 11.6% of the digital population only using mobile compared to 10.6% only using desktop; this also means the majority, 78%, use both desktop and mobile to access the internet.[241] A few smaller countries in North America, such as Haiti (because of Android) have gone mobile majority (mobile went to up to 72.35%, and is at 64.43% in February 2016).[242]
Revenue[edit]
The region with the largest Android usage[61] also has the largest mobile revenue.[243]
| 2020[244] | |
|---|---|
| Asia Pacific | $85.3B |
| North and South America | $74.5B |
| Europe, Middle East, and Africa | $29.1B |
Public servers on the Internet[edit]
Internet based servers’ market share can be measured with statistical surveys of publicly accessible servers, such as web servers, mail servers[245] or DNS servers on the Internet: the operating systems powering such servers are found by inspecting raw response messages. This method gives insight only into market share of operating systems that are publicly accessible on the Internet.
There will be differences in the result depending on how the sample is done and observations weighted. Usually the surveys are not based on a random sample of all IP addresses, domain names, hosts or organisations, but on servers found by some other method.[citation needed] Additionally, many domains and IP addresses may be served by one host and some domains may be served by several hosts or by one host with several IP addresses.
| Source | Date | Unix, Unix-like | Microsoft Windows | References |
|---|---|---|---|---|
| W3Techs | 14 July 2022 | 80.1% | 20.1% | [246][247] |
| Security Space | Feb 2014 | <79.3% | >20.7% | [248][249] |
|
- Note
- Revenue comparisons often include «operating system software, other bundled software»[251] and are not appropriate for usage comparison as the Linux operating system costs nothing (including «other bundled software»), except if optionally using commercial distributions such as Red Hat Enterprise Linux (in that case, cost of software for all software bundled with hardware has to be known for all operating systems involved, and subtracted). In cases where no-cost Linux is used, such comparisons underestimate Linux server popularity and overestimate other proprietary operating systems such as Unix and Windows.
Mainframes[edit]
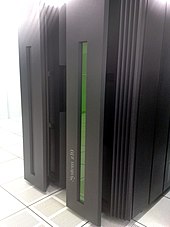
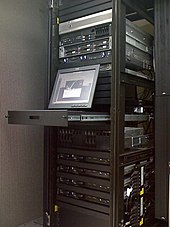
Mainframes are larger and more powerful than servers, but not supercomputers. They are used to process large sets of data, for example enterprise resource planning or credit card transactions.
The most common operating system for mainframes is IBM’s z/OS.[citation needed] Operating systems for IBM Z generation hardware include IBM’s proprietary z/OS,[252] Linux on IBM Z, z/TPF, z/VSE and z/VM.
Gartner reported on 23 December 2008, that Linux on System z was used on approximately 28% of the «customer z base» and that they expected this to increase to over 50% in the following five years.[253] Of Linux on IBM Z, Red Hat and Micro Focus compete to sell RHEL and SLES respectively:
- Prior to 2006, Novell claimed a market share of 85% or more for SUSE Linux Enterprise Server.
- Red Hat has since claimed 18.4% in 2007 and 37% in 2008.[254]
- Gartner reported at the end of 2008 that Novell’s SUSE Linux Enterprise Server had an 80% share of mainframe Linux.[253][dead link]
Decline[edit]
Like today’s trend of mobile devices from personal computers,[241] in 1984 for the first time estimated sales of desktop computers ($11.6 billion) exceeded mainframe computers ($11.4 billion). IBM received the vast majority of mainframe revenue.[255]
From 1991 to 1996, AT&T Corporation briefly owned NCR, one of the major original mainframe producers. During the same period, companies found that servers based on microcomputer designs could be deployed at a fraction of the acquisition price and offer local users much greater control over their own systems given the IT policies and practices at that time. Terminals used for interacting with mainframe systems were gradually replaced by personal computers. Consequently, demand plummeted and new mainframe installations were restricted mainly to financial services and government. In the early 1990s, there was a rough consensus among industry analysts that the mainframe was a dying market as mainframe platforms were increasingly replaced by personal computer networks.[256]
In 2012, NASA powered down its last mainframe, an IBM System z9.[257] However, IBM’s successor to the z9, the z10, led a New York Times reporter to state four years earlier that «mainframe technology—hardware, software and services—remains a large and lucrative business for IBM, and mainframes are still the back-office engines behind the world’s financial markets and much of global commerce».[258] As of 2010, while mainframe technology represented less than 3% of IBM’s revenues, it «continue[d] to play an outsized role in Big Blue’s results».[259]
Supercomputers[edit]
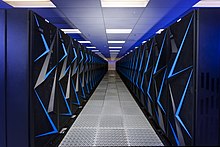
Sierra helps to assure the safety, reliability and effectiveness of the United States’ nuclear weapons.
The TOP500 project lists and ranks the 500 fastest supercomputers for which benchmark results are submitted. Since the early 1990s, the field of supercomputers has been dominated by Unix or Unix-like operating systems, and starting in 2017, every top 500 fastest supercomputer uses Linux as its supercomputer operating system.
The last supercomputer to rank #1 while using an operating system other than Linux was ASCI White, which ran AIX. It held the title from November 2000 to November 2001,[260] and was decommissioned in 2006. Then in June 2017, two AIX computers held rank 493 and 494,[261] the last non-Linux systems before they dropped off the list.

Supercomputer OS family – 1993–2021 systems share according to TOP500[262]
Historically all kinds of Unix operating systems dominated, and in the end ultimately Linux remains.
[edit]
| Category | Source | Date | Linux | UNIX and Unix-like (not incl. Linux) | Windows | In‑house | Other |
|---|---|---|---|---|---|---|---|
| Desktop, laptop | Net Applications[263] | Apr 2020 | 2.87% (excl. ChromeOS) plus 0.4% ChromeOS | 9.75% (macOS) | 86.92% (all versions) | 0.06% | |
| Embedded[e] | EE Times[264] | Mar 2019 | 38.42% (embedded Linux, Ubuntu, Android, other) | 2.82% (QNX, LynxOS) | 10.73% (Windows 10, Windows Embedded Compact) | 10.73% | 37.30% |
| Mainframe | Gartner[254] | Dec 2008 | 28% (SLES, RHEL) | 72% (z/OS)[f] | |||
| Server (web) | W3Techs[265] | Sep 2021 | Likely 77.4% (39.8% confirmed)[g] (Ubuntu, CentOS, Debian, Gentoo, RHEL, …)[266] | Less than 1% is confirmed to be UNIX or Unix-like and non-Linux. The top operating systems in order are: 0.3% BSD (97.8% of which is FreeBSD),[267] <0.1% Darwin,[268] <0.1% HP-UX,[269] <0.1% Solaris,[270] and <0.1% Minix.[271][g] | 22.7% (Windows Server 2019, WS2016, WS2012, WS2008) Microsoft’s own webserver runs 6.6% of websites.[272] |
||
| Smartphone, tablet | StatCounter Global Stats[273] | Apr 2020 | 70.80% (Android, KaiOS) | 28.79% (iOS) | 0.07% | 0.34% | |
| Supercomputer | TOP500[274] | Nov 2019 | 100% (Custom) |
See also[edit]
- Comparison of operating systems
- List of operating systems
- Timeline of operating systems
- Usage share of web browsers
- Mobile OS market share
Notes[edit]
- ^ «Shipments refer to sell-in», that is, wholesale.
- ^ The ‘Others’ column is obtained by summing all percentage data and subtracting from 100%.
- ^ Table is only showing mobile OS market share – not the overall market share.
- ^ Wikimedia Foundation statistics consider tablets as part of the mobile OS market share.
- ^ Embedded is a vast category, which has subcategories that include automotive, avionics, health, medical equipment, consumer electronics, intelligent homes, and telecommunications. The aggregated information above may be very different for each subcategory taken separately.
- ^ z/OS’s UNIX environment coexists with its native environment, which dates back to OS/360.
- ^ a b «UNIX and Unix-like (including Linux)» represents 77.4% of the total web server/website market share however 48.2% of that market share does not show «more specifically» which operating system.
References[edit]
- ^ «Operating System Market Share Worldwide». StatCounter Global Stats. Retrieved 7 November 2022.
- ^ «Operating System Market Share Worldwide April 2022». statcounter Global Stats.
- ^ «Mobile Operating System Market Share Worldwide — August 2022». statcounter Global Stats. Retrieved 4 May 2022.
- ^ «Desktop Operating System Market Share Worldwide — August 2022». statcounter Global Stats. Retrieved 13 September 2022.
- ^ «Tablet Operating System Market Share Worldwide». StatCounter Global Stats. Retrieved 7 November 2022.
- ^ «Tablet Operating System Market Share Worldwide». StatCounter Global Stats. Retrieved 7 November 2022.
- ^ «Tablet Operating System Market Share Worldwide». StatCounter Global Stats. Retrieved 7 November 2022.
- ^ «Desktop vs Mobile vs Tablet vs Console Market Share Worldwide — August 2022». statcounter Global Stats. Retrieved 4 May 2022.
- ^ «Desktop vs Mobile vs Tablet vs Console Market Share Worldwide». StatCounter Global Stats. Retrieved 4 May 2022.
- ^ «Desktop vs Mobile vs Tablet vs Console Market Share United States Of America». StatCounter Global Stats. Retrieved 4 May 2022.
- ^ a b «Windows comes up third in OS clash two years early». 1 April 2016. Retrieved 12 April 2016.
- ^ «Gartner Says Worldwide PC Shipments Grew 10.7% in Fourth Quarter of 2020 and 4.8% for the Year». Gartner. Retrieved 3 March 2021.
- ^ «Gartner Forecasts Worldwide Device Shipments to Decline 14% in 2020 Due to Coronavirus Impact». Gartner. Retrieved 3 March 2021.
- ^ «Gartner Says Worldwide Device Shipments Will Increase 2.1 Percent in 2018». 29 January 2018. Retrieved 18 December 2019.
- ^ «Gartner: Windows OS device shipments will falter in 2017». 10 January 2017. Retrieved 18 December 2019.
- ^ «Gartner Says Tablet Sales Continue to Be Slow in 2015». 5 January 2015. Archived from the original on 7 January 2015. Retrieved 6 March 2015.
- ^ «Gartner Says Worldwide Traditional PC, Tablet, Ultramobile and Mobile Phone Shipments to Grow 4.2 Percent in 2014». 7 July 2014. Archived from the original on 11 July 2014. Retrieved 6 March 2015.
- ^ «Gartner Says Worldwide PC, Tablet and Mobile Phone Shipments to Grow 4.5 Percent in 2013 as Lower-Priced Devices Drive Growth». 21 October 2013. Archived from the original on 21 October 2013. Retrieved 6 March 2015.
- ^ «Gartner Says Worldwide End-User Spending on Devices Will Grow 2 Percent in 2017, While Unit Shipments Remain Flat». Retrieved 7 December 2017.
- ^ «Gartner Says Worldwide PC Shipments Declined 8.3 Percent in Fourth Quarter of 2015: Holiday Sales Provided Little Cheer to PC Vendors in 2015» (Press release). 12 January 2016. Retrieved 15 March 2016.
- ^ «Android is now used by 1.4 billion people». The Verge. 29 September 2015.
- ^ «Google I/O website: Keynote». Archived from the original on 18 June 2015. Retrieved 20 January 2016.
- ^ Protalinski, Emil (17 May 2017). «Android passes 2 billion monthly active devices». VentureBeat. Retrieved 17 May 2017.
- ^ Ng, Alfred (17 May 2017). «Google’s Android now powers more than 2 billion devices». CNET. CBS Interactive. Retrieved 17 May 2017.
- ^ Thurrott, Paul (27 January 2016). «Apple’s active installed base is now over 1 billion strong». Retrieved 16 August 2016.
there are three big personal computing platforms. And only one of them is actually declining. We’ll see how Windows 10 fares over the long term, but even if Microsoft hits the 1 billion figure in 1-2 years as promised, it will by then still be the smallest of those three platforms.
- ^ Fuscaldo, Donna (18 July 2016). «Microsoft Backs Away From Windows 10 Goal (MSFT)». investopedia.com. Retrieved 22 March 2017.
- ^ Foley, Mary Jo. «Microsoft: Windows 10 now on 400 million devices». ZDNet.
- ^ Foley, Mary Jo. «Microsoft says Windows 10 is now on more than 800 million devices». ZDNet. Retrieved 11 March 2019.
- ^ Parrack, Dave (18 August 2016). «Android Is Killing iOS, Uber Launches Self-Driving Cars… [Tech News Digest]».
- ^ Gadgets Now Bureau, «World’s 5 biggest smartphone companies», Gadgets Now, 1 Aug 2018, 02.51 PM IST
- ^ «Gartner Says Five of Top 10 Worldwide Mobile Phone Vendors Increased Sales in Second Quarter of 2016: Global Sales of Smartphones Grew 4.3 Percent Year on Year» (Press release). Gartner. 19 August 2016.
- ^ Patrick, Seitz (3 November 2016). «Apple iPhone Grabs 104% Of Smartphone Industry Profit In Q3». Investor’s Business Daily.
- ^ «Are there Really More Mobile Phone Owners than Toothbrush Owners?». www.linkedin.com. Retrieved 15 June 2019.
- ^ Turner, Ash (10 July 2018). «1 Billion More Phones Than People In The World! BankMyCell». BankMyCell. Retrieved 15 June 2019.
- ^ «Tablet Users to Surpass 1 Billion Worldwide in 2015 — eMarketer». emarketer.com. Retrieved 22 March 2017.
- ^ «Tablets have banner 2015». 1 January 2016.
- ^ «IDC: Tablet Shipments Decline For Fifth Straight Quarter — Androidheadlines.com». androidheadlines.com. 1 February 2016. Retrieved 22 March 2017.
- ^ Eric Smith (29 July 2022). «Strategy Analytics: Android Tablet Market Share Falls Below 50% for First Time in 10 Years». Strategy Analytics. Retrieved 9 October 2022.
- ^ «Global tablet shipments by OS 2010-2020». Statista. Retrieved 16 November 2020.
- ^ Eric Smith (23 November 2015). «Tablets: Windows fast becoming a premium OS, says Strategy Analytics». Strategy Analytics. Retrieved 31 March 2016.
- ^ a b Lunden, Ingrid (3 March 2014). «Gartner: 195M Tablets Sold In 2013, Android Grabs Top Spot From iPad With 62% Share». Retrieved 21 July 2014.
- ^ «Ultramobiles». Gartner, Inc. Retrieved 9 October 2022.
- ^ «Mobile operating systems’ market share worldwide from 1st quarter 2009 to 4th quarter 2022». Retrieved 1 December 2022.
- ^ «Gartner Says Worldwide Sales of Smartphones Returned to Growth in First Quarter of 2018». 28 May 2018. Retrieved 22 September 2022.
- ^ «GGartner Says Worldwide Sales of Smartphones Recorded First Ever Decline During the Fourth Quarter of 2017» (Press release). 22 February 2018. Retrieved 22 September 2022.
- ^ «Gartner Says Worldwide Sales of Smartphones Grew 9 Percent in First Quarter of 2017». Retrieved 2 February 2018.
- ^ «GGartner Says Worldwide Sales of Smartphones Recorded First Ever Decline During the Fourth Quarter of 2017» (Press release). 22 February 2018. Retrieved 22 September 2022.
- ^ «Gartner Says Worldwide Sales of Smartphones Grew 7 Percent in the Fourth Quarter of 2016». Retrieved 2 February 2018.
- ^ «Gartner Says Chinese Smartphone Vendors Were Only Vendors in the Global Top Five to Increase Sales in the Third Quarter of 2016» (Press release). Retrieved 9 December 2016.
- ^ «Gartner Says Five of Top 10 Worldwide Mobile Phone Vendors Increased Sales in Second Quarter of 2016» (Press release). Retrieved 9 December 2016.
- ^ «Gartner Says Worldwide Smartphone Sales Grew 3.9 Percent in First Quarter of 2016» (Press release). Retrieved 9 December 2016.
- ^ «Gartner Says Worldwide Smartphone Sales Grew 9.7 Percent in Fourth Quarter of 2015» (Press release). 18 February 2016. Retrieved 22 September 2022.
- ^ «Gartner Says Worldwide Smartphone Sales Recorded Slowest Growth Rate Since 2013» (Press release). 20 August 2015. Retrieved 22 September 2022.
- ^ «Gartner Says Worldwide Smartphone Sales Grew 9.7 Percent in Fourth Quarter of 2015» (Press release). 18 February 2016. Retrieved 22 September 2022.
- ^ «Android Captures Record 81 Percent Share of Global Smartphone Shipments in Q3 2013». Archived from the original on 1 November 2013. Retrieved 1 November 2013.
- ^ «Gartner Says Worldwide Smartphone Sales Recorded Slowest Growth Rate Since 2013» (Press release). 20 August 2015. Retrieved 22 September 2022.
- ^ «Worldwide Smartphone Sales to End Users by Operating System in 2Q13» (Press release).
- ^ «Worldwide Smartphone Sales to End Users by Operating System in 1Q13» (Press release).
- ^ «Android and iOS Combine for 92.3% of All Smartphone Operating System Shipments in the First Quarter While Windows Phone Leapfrogs BlackBerry, According to IDC». www.businesswire.com. 16 May 2013.
- ^ Statcounter. «Operating System Market Share Worldwide: April 2022». gs.statcounter.com. Retrieved 4 May 2022.
- ^ a b «Android overtakes Windows for first time: «Milestone in technology history and end of an era» as Microsoft no longer owns dominant OS» (Press release).
- ^ «StatCounter Global Stats — Browser, OS, Search Engine including Mobile Usage Share». statcounter.com. Retrieved 19 April 2017.
- ^ «Operating System Market Share South America». StatCounter Global Stats. Retrieved 1 October 2020.
- ^ «Operating System Market Share United States Of America». StatCounter Global Stats. Retrieved 19 June 2022.
- ^ «Operating System Market Share United States Of America». StatCounter Global Stats. Retrieved 19 June 2022.
- ^ «Operating System Market Share United States Of America». StatCounter Global Stats. Retrieved 19 June 2022.
- ^ «Operating System Market Share Africa». StatCounter Global Stats. Retrieved 19 June 2022.
- ^ «Operating System Market Share Guam». StatCounter Global Stats. Retrieved 4 December 2019.
- ^ «Operating System Market Share Guam». StatCounter Global Stats. Retrieved 14 July 2019.
- ^ «Operating System Market Share Guam». StatCounter Global Stats. Retrieved 4 December 2019.
- ^ «Operating System Market Share Falkland Islands (malvinas): Q3 2018 — Q2 2019». StatCounter Global Stats. Retrieved 14 July 2019.
- ^ «Operating System Market Share Falkland Islands (malvinas)». StatCounter Global Stats. Retrieved 14 July 2019.
- ^ «Operating System Market Share Sweden». StatCounter Global Stats. Retrieved 14 July 2019.
- ^ «Operating System Market Share Madagascar». StatCounter Global Stats. Retrieved 15 July 2019.
- ^ «Browser Version Market Share Madagascar». StatCounter Global Stats.
- ^ «Browser Market Share Madagascar». StatCounter Global Stats.
- ^ «StatCounter Global Stats — Browser, OS, Search Engine including Mobile Usage Share». statcounter.com. Retrieved 16 October 2019.
- ^ «Top 8 Operating Systems in Asia from July 2014 to September 2019». statcounter.com.
- ^ a b «Operating System Market Share Bangladesh». StatCounter Global Stats. Retrieved 16 October 2019.
- ^ «Top 8 Operating Systems in Africa from July 2014 to Apr 2016». statcounter.com.
- ^ «StatCounter Global Stats — Browser, OS, Search Engine including Mobile Usage Share». statcounter.com. Retrieved 22 March 2017.
- ^ «Global stats». W3 Counter.
- ^ «StatCounter Global Stats — Browser, OS, Search Engine including Mobile Usage Share». statcounter.com. Retrieved 22 March 2017.
- ^ «W3Counter: Global Web Stats — October 2022». www.w3counter.com. Retrieved 1 December 2022.
- ^ «W3Counter: Global Web Stats — October 2020». www.w3counter.com. Retrieved 16 November 2020.
- ^ a b «Global stats». W3 Counter.
- ^ «Global stats». W3 Counter.
- ^ a b «StatCounter Stats through Dec 2016». www.statcounter.com. Retrieved 5 December 2016.
- ^ «Worldwide user OS families in Jul 2016».
- ^ a b «Worldwide user OS families in Dec 2015».
- ^ «Wikimedia Traffic Analysis Report — Operating Systems, 28Nov2016-1Jan2017».
- ^ «Desktop Operating System Market Share Worldwide». StatCounter Global Stats.
- ^ «Operating System Market Share United States Of America». StatCounter Global Stats. Retrieved 5 January 2021.
- ^ «Operating System Market Share Worldwide». StatCounter Global Stats. Retrieved 5 January 2021.
- ^ «Desktop Operating System Market Share United States Of America». StatCounter Global Stats. Retrieved 5 January 2021.
- ^ https://gs.statcounter.com/#desktop-os-ww-monthly-201508-201508-bar StatCounter
- ^ «Software Pirates in China Beat Microsoft to the Punch». The New York Times. 19 October 2009.
- ^ «Around 25–35% of Windows XP systems are pirated (calculations included)». Archived from the original on 4 March 2016.
- ^ «StatCounter Global Stats — Browser, OS, Search Engine including Mobile Usage Share». statcounter.com. Retrieved 22 March 2017.
- ^ «StatCounter Global Stats — Browser, OS, Search Engine including Mobile Usage Share». statcounter.com. Retrieved 22 March 2017.
- ^ «Top 7 Desktop OSs in Asia on May 2016». StatCounter. May 2016. Retrieved 9 April 2016.
- ^ «Desktop Windows Version Market Share Armenia». StatCounter Global Stats. Retrieved 4 October 2021.
- ^ «Desktop vs Mobile vs Tablet vs Console Market Share Worldwide». StatCounter Global Stats. Retrieved 2 October 2021.
- ^ «Desktop vs Mobile vs Tablet vs Console Market Share Worldwide». StatCounter Global Stats. Retrieved 16 November 2020.
- ^ «Desktop vs Mobile vs Tablet vs Console Market Share Worldwide». StatCounter Global Stats. Retrieved 1 October 2020.
- ^ «Desktop vs Mobile vs Tablet vs Console Market Share United States Of America». StatCounter Global Stats. Retrieved 4 October 2021.
- ^ «Desktop vs Mobile vs Tablet vs Console Market Share Oceania». StatCounter Global Stats. Retrieved 4 October 2021.
- ^ «Desktop vs Mobile vs Tablet vs Console Market Share Europe». StatCounter Global Stats. Retrieved 4 October 2021.
- ^ «Desktop vs Mobile vs Tablet vs Console Market Share North America». StatCounter Global Stats. Retrieved 4 October 2021.
- ^ «Desktop vs Mobile vs Tablet vs Console Market Share United States Of America». StatCounter Global Stats. Retrieved 1 July 2019.
- ^ «Desktop vs Mobile vs Tablet vs Console Market Share United States Of America». StatCounter Global Stats. Retrieved 18 October 2021.
- ^ «Desktop vs Mobile vs Tablet vs Console Market Share United States Of America». StatCounter Global Stats. Retrieved 18 October 2021.
- ^ «Desktop vs Mobile vs Tablet vs Console Market Share United States Of America». StatCounter Global Stats. Retrieved 18 October 2021.
- ^ «Desktop vs Mobile vs Tablet vs Console Market Share Worldwide». StatCounter Global Stats. Retrieved 1 July 2019.
- ^ «Desktop vs Mobile vs Tablet vs Console Market Share United States Of America». StatCounter Global Stats. Retrieved 13 December 2021.
- ^ «Desktop vs Mobile vs Tablet vs Console Market Share United States Of America». StatCounter Global Stats. Retrieved 13 December 2021.
- ^ «Stack Overflow Developer Survey 2019, Primary Operating System». stackoverflow. Retrieved 30 April 2019.
- ^ «Windows 10 has over 50 percent market share, according to Microsoft — wait, what?». BetaNews. 29 August 2016.
- ^ a b Steam Hardware & Software Survey: December 2022, archived from the original on 4 January 2021, retrieved 31 January 2023
- ^ Steam Hardware & Software Survey: December 2019, archived from the original on 2 January 2020
- ^ Steam Hardware & Software Survey: January 2019, archived from the original on 11 February 2019
- ^ Steam Hardware & Software Survey: December 2018, archived from the original on 1 March 2018
- ^ Steam Hardware & Software Survey, archived from the original on 12 February 2017
- ^ Steam Hardware & Software Survey, archived from the original on 10 February 2016
- ^ Steam Hardware & Software Survey, archived from the original on 16 February 2015
- ^ Steam Hardware & Software Survey, archived from the original on 15 February 2014
- ^ «Linux gaming is much healthier than Steam’s Hardware Survey implies». pcworld.com. Retrieved 22 March 2017.
- ^ «Gartner Says Worldwide Sales of Smartphones Returned to Growth in First Quarter of 2018». Gartner, Inc. Gartner. 29 May 2018. Archived from the original on 13 June 2018. Retrieved 25 August 2018.
- ^ «Desktop vs Mobile vs Tablet vs Console Market Share Russian Federation | StatCounter Global Stats». StatCounter Global Stats. Retrieved 16 October 2019.
- ^ «Desktop vs Mobile vs Tablet vs Console Market Share Mali | StatCounter Global Stats». StatCounter Global Stats. Retrieved 16 October 2019.
- ^ «Operating System Market Share Mali». StatCounter Global Stats. Retrieved 15 July 2019.
- ^ Bates, Adam. «InsightPortal | Higher GDP per capita corresponds with more Apple devices, stats suggest». www.insightportal.io. Retrieved 18 October 2017.
- ^ «Google Mobile App Marketing Insights: Asia» (PDF). storage.googleapis.com.
- ^ «Mobile Operating System Market Share India». StatCounter Global Stats. Retrieved 23 January 2019.
- ^ «Mobile Operating System Market Share Worldwide». StatCounter Global Stats. Retrieved 8 October 2022.
- ^ «Mobile Operating System Market Share Worldwide». StatCounter Global Stats. Retrieved 16 November 2020.
- ^ a b c «StatCounter Global Stats — Browser, OS, Search Engine including Mobile Usage Share». StatCounter Global Stats.
- ^ «Comscore Reports April 2017 U.S. Smartphone Subscriber Market Share». comScore, Inc. 8 June 2017. Retrieved 8 October 2022.
- ^ «comScore Reports January 2016 U.S. Smartphone Subscriber Market Share». comScore, Inc. Retrieved 9 December 2016.
- ^ «comScore Reports January 2015 U.S. Smartphone Subscriber Market Share». comScore. 4 March 2015. Retrieved 5 May 2015.
- ^ «comScore Reports January 2014 U.S. Smartphone Subscriber Market Share — comScore, Inc». comScore. 7 March 2014. Retrieved 30 March 2014.
- ^ «Comscore Reports February 2012 U.S. Mobile Subscriber Market Share: Android Captures Majority Share of U.S. Smartphone Market». comScore, Inc. 3 April 2012. Retrieved 8 October 2022.
- ^ «comScore Reports December 2010 U.S. Mobile Subscriber Market Share: Number of Smartphone Users Up 60 Percent Versus Year Agoe». comScore, Inc. 7 February 2011. Retrieved 8 October 2022.
- ^ «Tablet Operating System Market Share Worldwide — July 2018». StatCounter. StatCounter. 29 May 2018. Retrieved 25 August 2018.
- ^ «StatCounter Global Stats — Browser, OS, Search Engine including Mobile Usage Share». statcounter.com. Retrieved 22 March 2017.
- ^ «StatCounter Global Stats — Browser, OS, Search Engine including Mobile Usage Share». statcounter.com. Retrieved 20 October 2017.
- ^ «StatCounter Global Stats — Browser, OS, Search Engine including Mobile Usage Share». statcounter.com. Retrieved 20 October 2017.
- ^ «StatCounter Global Stats — Browser, OS, Search Engine including Mobile Usage Share». statcounter.com. Retrieved 22 March 2017.
- ^ «StatCounter Global Stats — Browser, OS, Search Engine including Mobile Usage Share». statcounter.com. Retrieved 22 March 2017.
- ^ «StatCounter Global Stats — Browser, OS, Search Engine including Mobile Usage Share». statcounter.com.
- ^ «StatCounter Global Stats — Browser, OS, Search Engine including Mobile Usage Share». statcounter.com.
- ^ «StatCounter Global Stats — Browser, OS, Search Engine including Mobile Usage Share». statcounter.com.
- ^ «StatCounter Global Stats — Browser, OS, Search Engine including Mobile Usage Share». statcounter.com.
- ^ «StatCounter Global Stats — Browser, OS, Search Engine including Mobile Usage Share». statcounter.com.
- ^ a b «StatCounter Global Stats — Browser, OS, Search Engine including Mobile Usage Share». statcounter.com.
- ^ «Top 7 Tablet OSes in South America from Aug 2012 to Aug 2015». statcounter.com.
- ^ «StatCounter Global Stats — Browser, OS, Search Engine including Mobile Usage Share». statcounter.com.
- ^ «Top 7 Tablet OSes in South America from Aug 2012 to Sep 2015». statcounter.com.
- ^ «StatCounter Global Stats — Browser, OS, Search Engine including Mobile Usage Share». statcounter.com.
- ^ «StatCounter Global Stats — Browser, OS, Search Engine including Mobile Usage Share». statcounter.com.
- ^ «StatCounter Global Stats — Browser, OS, Search Engine including Mobile Usage Share». statcounter.com.
- ^ «Tablet Operating System Market Share Worldwide». StatCounter Global Stats. Retrieved 16 November 2020.
- ^ «Tablet Operating System Market Share Worldwide». StatCounter Global Stats. Retrieved 16 November 2020.
- ^ «Tablet Operating System Market Share Worldwide». StatCounter Global Stats. Retrieved 16 November 2020.
- ^ Global Stats Top 7 Tablet OSs from Jan to Aug 2015. Retrieved 20 September 2015.
- ^ Global Stats Top 7 Tablet OSs from Feb 2015. Retrieved 16 March 2015.
- ^ Global Stats Top 7 Tablet OSs from Oct 2014. Retrieved 7 March 2015.
- ^ «Operating System Market Share United States Of America». StatCounter Global Stats. Retrieved 16 October 2019.
- ^ «Desktop vs mobile vs tablet vs console market share Worldwide — StatCounter Global Stats». StatCounter Global Stats.
- ^ «Operating System Market Share Worldwide | StatCounter Global Stats». StatCounter Global Stats. Retrieved 10 April 2018.
- ^ «Desktop vs mobile vs tablet vs console market share in Europe — StatCounter Global Stats». StatCounter Global Stats.
- ^ «Desktop vs mobile vs tablet vs console market share Worldwide — StatCounter Global Stats». StatCounter Global Stats.
- ^ «Desktop vs Mobile vs Tablet vs Console Market Share Sweden». StatCounter Global Stats. Retrieved 12 July 2019.
- ^ «India amongst world leaders in use of mobile to surf the internet» (Press release). 28 March 2017.
- ^ «Operating system market share in India — StatCounter Global Stats». StatCounter Global Stats.
- ^ «Desktop vs mobile vs tablet vs console market share Worldwide — StatCounter Global Stats». StatCounter Global Stats.
- ^ «Comparison from W34 to W45 2015». StatCounter Global Stats.
- ^ «StatCounter Global Stats — Browser, OS, Search Engine including Mobile Usage Share».
- ^ «Operating system market share in Puerto Rico — StatCounter Global Stats». StatCounter Global Stats.
- ^ «StatCounter Global Stats — Browser, OS, Search Engine including Mobile Usage Share».
- ^ «StatCounter Global Stats — Browser, OS, Search Engine including Mobile Usage Share». statcounter.com. Retrieved 22 March 2017.
- ^ «Mobile and tablet Internet usage exceeds desktop for first time worldwide». StatCounter (Press release).
- ^ «Desktop vs mobile vs tablet vs console market share Worldwide — StatCounter Global Stats». statcounter.com. Retrieved 3 April 2017.
- ^ a b «Desktop vs mobile vs tablet vs console market share Worldwide — StatCounter Global Stats». statcounter.com. Retrieved 22 March 2017.
- ^ «StatCounter Global Stats — Browser, OS, Search Engine including Mobile Usage Share». statcounter.com. Retrieved 22 March 2017.
- ^ «StatCounter Global Stats — Browser, OS, Search Engine including Mobile Usage Share». statcounter.com. Retrieved 22 March 2017.
- ^ «StatCounter Global Stats — Browser, OS, Search Engine including Mobile Usage Share». statcounter.com. Retrieved 22 March 2017.
- ^ «StatCounter Global Stats — Browser, OS, Search Engine including Mobile Usage Share». statcounter.com. Retrieved 22 March 2017.
- ^ «StatCounter Global Stats — Browser, OS, Search Engine including Mobile Usage Share». statcounter.com. Retrieved 22 March 2017.
- ^ «StatCounter Global Stats — Browser, OS, Search Engine including Mobile Usage Share». statcounter.com. Retrieved 22 March 2017.
- ^ «StatCounter Global Stats — Browser, OS, Search Engine including Mobile Usage Share». statcounter.com. Retrieved 22 March 2017.
- ^ «StatCounter Global Stats — Browser, OS, Search Engine including Mobile Usage Share». statcounter.com. Retrieved 22 March 2017.
- ^ «StatCounter Global Stats — Browser, OS, Search Engine including Mobile Usage Share». statcounter.com. Retrieved 22 March 2017.
- ^ «Comparison from W34 to W47 2016». StatCounter Global Stats.
- ^ «StatCounter Global Stats — Browser, OS, Search Engine including Mobile Usage Share». statcounter.com. Retrieved 22 March 2017.
- ^ a b «StatCounter Global Stats — Browser, OS, Search Engine including Mobile Usage Share». statcounter.com. Retrieved 22 March 2017.
- ^ «StatCounter Global Stats — Browser, OS, Search Engine including Mobile Usage Share». statcounter.com. Retrieved 22 March 2017.
- ^ «StatCounter Global Stats — Browser, OS, Search Engine including Mobile Usage Share». statcounter.com. Retrieved 22 March 2017.
- ^ «StatCounter Global Stats — Browser, OS, Search Engine including Mobile Usage Share». statcounter.com. Retrieved 22 March 2017.
- ^ «StatCounter Global Stats — Browser, OS, Search Engine including Mobile Usage Share». statcounter.com. Retrieved 22 March 2017.
- ^ «StatCounter Global Stats — Browser, OS, Search Engine including Mobile Usage Share». statcounter.com. Retrieved 22 March 2017.
- ^ «StatCounter Global Stats — Browser, OS, Search Engine including Mobile Usage Share». statcounter.com. Retrieved 22 March 2017.
- ^ «StatCounter Global Stats — Browser, OS, Search Engine including Mobile Usage Share». statcounter.com. Retrieved 22 March 2017.
- ^ «StatCounter Global Stats — Browser, OS, Search Engine including Mobile Usage Share». statcounter.com. Retrieved 22 March 2017.
- ^ «Mobile and tablet internet usage exceeds desktop for first time worldwide». StatCounter (Press release).
- ^ «StatCounter Global Stats — Browser, OS, Search Engine including Mobile Usage Share». statcounter.com. Retrieved 22 March 2017.
- ^ «StatCounter Global Stats — Browser, OS, Search Engine including Mobile Usage Share». statcounter.com. Retrieved 22 March 2017.
- ^ «StatCounter Global Stats — Browser, OS, Search Engine including Mobile Usage Share». statcounter.com. Retrieved 22 March 2017.
- ^ «StatCounter Global Stats — Browser, OS, Search Engine including Mobile Usage Share». statcounter.com. Retrieved 22 March 2017.
- ^ «StatCounter Global Stats — Browser, OS, Search Engine including Mobile Usage Share». statcounter.com. Retrieved 22 March 2017.
- ^ «StatCounter Global Stats — Browser, OS, Search Engine including Mobile Usage Share». statcounter.com. Retrieved 22 March 2017.
- ^ «StatCounter Global Stats — Browser, OS, Search Engine including Mobile Usage Share». statcounter.com. Retrieved 22 March 2017.
- ^ «StatCounter Global Stats — Browser, OS, Search Engine including Mobile Usage Share». statcounter.com. Retrieved 22 March 2017.
- ^ «StatCounter Global Stats — Browser, OS, Search Engine including Mobile Usage Share». statcounter.com. Retrieved 22 March 2017.
- ^ «StatCounter Global Stats — Browser, OS, Search Engine including Mobile Usage Share». statcounter.com. Retrieved 22 March 2017.
- ^ https://gs.statcounter.com/#all-comparison-ww-daily-20150701-20160724 Comparison from 1 July 2015 to 24 July 2016
- ^ «StatCounter Global Stats — Browser, OS, Search Engine including Mobile Usage Share». statcounter.com. Retrieved 22 March 2017.
- ^ «StatCounter Global Stats — Browser, OS, Search Engine including Mobile Usage Share». statcounter.com. Retrieved 22 March 2017.
- ^ «StatCounter Global Stats — Browser, OS, Search Engine including Mobile Usage Share». statcounter.com. Retrieved 22 March 2017.
- ^ «StatCounter Global Stats — Browser, OS, Search Engine including Mobile Usage Share». statcounter.com. Retrieved 22 March 2017.
- ^ «StatCounter Global Stats — Browser, OS, Search Engine including Mobile Usage Share». statcounter.com. Retrieved 22 March 2017.
- ^ «StatCounter Global Stats — Browser, OS, Search Engine including Mobile Usage Share». statcounter.com.
- ^ «StatCounter Global Stats — Browser, OS, Search Engine including Mobile Usage Share». statcounter.com.
- ^ «StatCounter Global Stats — Browser, OS, Search Engine including Mobile Usage Share». statcounter.com.
- ^ «StatCounter Global Stats — Browser, OS, Search Engine including Mobile Usage Share». statcounter.com.
- ^ «StatCounter Global Stats — Browser, OS, Search Engine including Mobile Usage Share». statcounter.com.
- ^ «StatCounter Global Stats — Browser, OS, Search Engine including Mobile Usage Share». statcounter.com.
- ^ «StatCounter Global Stats — Browser, OS, Search Engine including Mobile Usage Share». statcounter.com.
- ^ «Mobile internet usage soars by 67%» (Press release). Retrieved 21 October 2014.
- ^ «StatCounter Global Stats — Browser, OS, Search Engine including Mobile Usage Share». statcounter.com.
- ^ «StatCounter Global Stats — Browser, OS, Search Engine including Mobile Usage Share». statcounter.com.
- ^ «StatCounter Global Stats — Browser, OS, Search Engine including Mobile Usage Share». statcounter.com.
- ^ «StatCounter Global Stats — Browser, OS, Search Engine including Mobile Usage Share». statcounter.com.
- ^ «StatCounter Global Stats — Browser, OS, Search Engine including Mobile Usage Share». statcounter.com.
- ^ «StatCounter Global Stats — Browser, OS, Search Engine including Mobile Usage Share». statcounter.com. Retrieved 22 March 2017.
- ^ «StatCounter Global Stats — Browser, OS, Search Engine including Mobile Usage Share». statcounter.com.
- ^ «StatCounter Global Stats — Browser, OS, Search Engine including Mobile Usage Share». statcounter.com. Retrieved 22 March 2017.
- ^ «StatCounter Global Stats — Browser, OS, Search Engine including Mobile Usage Share». statcounter.com. Retrieved 22 March 2017.
- ^ «StatCounter Global Stats — Browser, OS, Search Engine including Mobile Usage Share». statcounter.com. Retrieved 22 March 2017.
- ^ «StatCounter Global Stats — Browser, OS, Search Engine including Mobile Usage Share». statcounter.com. Retrieved 22 March 2017.
- ^ a b Number of Mobile-Only Internet Users Now Exceeds Desktop-Only in the U.S.. Retrieved 5 May 2015.
- ^ «StatCounter Global Stats — Browser, OS, Search Engine including Mobile Usage Share». statcounter.com. Retrieved 22 March 2017.
- ^ «Forecast: Mobile App Store Revenue to Exceed $139B in 2021». appannie.com.
- ^ «Worldwide mobile app revenues by region 2020». Statista. Retrieved 16 November 2020.
- ^ «Mail Server Survey». Security Space. August 2011.
- ^ «Usage of operating systems for websites». W3Techs. Retrieved 14 July 2022.
- ^ «Usage of Unix for websites». W3Techs. Retrieved 14 July 2022.
- ^ «Web Server Survey». Security Space. 1 March 2014.
- ^ «OS/Linux Distributions using Apache». Security Space. 1 March 2014.
- ^ «Web Technologies Statistics and Trends». W3Techs. December 2013.
- ^ «Worldwide Server Market Revenues Decline −3.7% in the Third Quarter as Weak Unix Server Demand Weights on the Market, According to IDC». International Data Corporation. Archived from the original on 8 February 2014. Retrieved 24 February 2014.
- ^ «IBM Tightens Stranglehold Over Mainframe Market; Gets Hit with Antitrust Complaint in Europe». Computer & Communications Industry Association. 2 July 2008. Archived from the original on 6 July 2010. Retrieved 27 May 2015.
- ^ a b «Vendor Rating: Novell, 2008». Gartner RAS Core Research Note G00162399. 23 December 2008. Retrieved 23 November 2009.[dead link]
- ^ a b Claybrook, Bill (1 September 2009). «Red Hat bolsters Linux for mainframes, tries to catch Novell». SearchDataCenter.com. Retrieved 23 November 2009.
- ^ Sanger, David E. (5 February 1984). «Bailing Out of the Mainframe Industry». The New York Times. p. Section 3, Page 1. ISSN 0362-4331. Retrieved 2 March 2020.
- ^ Also, Stewart (8 March 1993). «IBM still has brains to be player in client/server platforms». InfoWorld. Retrieved 26 December 2013.
- ^ Cureton, Linda (11 February 2012). The End of the Mainframe Era at NASA. NASA. Retrieved 31 January 2014.
- ^ Lohr, Steve (23 March 2008). «Why Old Technologies Are Still Kicking». The New York Times. Retrieved 25 December 2013.
- ^ Ante, Spencer E. (22 July 2010). «IBM Calculates New Mainframes Into Its Future Sales Growth». The Wall Street Journal. Retrieved 25 December 2013.
- ^ «No. 1 system from November 2000 to November 2001». top500.org. Retrieved 22 May 2019.
- ^ «Linux is Running on Almost all of the Supercomputers». TechFAE. 25 June 2017.
- ^ «Operating system Family — Systems share». Top 500 project.
- ^ «Operating System Market Share». Net Applications.
- ^ «Embedded Markets Study» (PDF). March 2019.
- ^ «Usage Statistics and Market Share of Operating Systems for Websites, September 20212020». W3Techs. Retrieved 8 September 2021.
- ^ «Usage Statistics and Market Share of Linux for Websites, September 2021». W3Techs. Retrieved 8 September 2021.
- ^ «Usage Statistics and Market Share of BSD for Websites, September 2021». W3Techs. Retrieved 8 September 2021.
- ^ «Usage Statistics and Market Share of Darwin for Websites, September 2021». W3Techs. Retrieved 8 September 2021.
- ^ «Usage Statistics and Market Share of HP-UX for Websites, September 2021». W3Techs. Retrieved 8 September 2021.
- ^ «Usage Statistics and Market Share of Solaris for Websites, September 2021». W3Techs. Retrieved 8 September 2021.
- ^ «Usage Statistics and Market Share of Minix for Websites, September 2021». W3Techs. Retrieved 8 September 2021.
- ^ «Usage Statistics and Market Share of Web Servers, September 2021». W3Techs. Retrieved 8 September 2021.
- ^ «StatCounter Global Stats: Top 8 Mobile Operating Systems on April 2020».
- ^ «Operating system Family (Linux)». www.top500.org. Retrieved 12 May 2020.
The usage share of operating systems is the percentage of computing devices that run each operating system (OS) at any particular time. All such figures are necessarily estimates because data about operating system share is difficult to obtain. There are few reliable primary sources and no agreed methodologies for its collection. Operating systems are used in numerous device types, from embedded devices without a screen through to supercomputers.
Most device types that people interact with access the web, so using web access statistics helps compare the usage share of operating systems across most device types, and also the usage share of operating systems used for the same types.
As of November 2022, Android, an operating system using the Linux kernel, is the world’s most-used operating system when judged by web use. It has 42% of the global market, followed by Windows with 30%, Apple iOS with 18%, macOS with 6%, then (desktop) Linux at 1.0% also using the Linux kernel.[1][2] These numbers do not include embedded devices or game consoles.
- For smartphones and other pocket-sized devices, Android leads with 71% market share, and Apple’s iOS has 28%.[3]
- For desktop and laptop computers, Windows is the most used at 76%, followed by Apple’s macOS at 16%, and Linux-based operating systems at 5% (i.e. «desktop Linux» at 2.6%, plus Google’s ChromeOS at 2.4%, in the US up to 6.2%).[4]
- For tablets, Apple’s iPadOS has 50.7% and Android has 49.18% worldwide[5] (Android is though more used in vast majority of countries;[6] and on occational days Android measures ahead or even, globally[7]).
For the above devices, smartphones and other pocket-sized devices make up 58%, desktops and laptops 40%, and tablets 2.0%.[8] Smartphones have the most use in virtually all countries, including in the US at 51% there with PC operating systems (including Windows) down to 46%.[9][10]
- Linux has completely dominated the supercomputer field since 2017, with all of the top 500 most powerful supercomputers in the world running a Linux distribution. Linux is also most used for (web) servers, and then most often Ubuntu used, the most common Linux distribution.
The most numerous type of device with an operating system are embedded systems. These use varied operating systems; a high percentage are standalone or do not have a web browser, which makes their usage share difficult to measure. Hypothetically some operating systems used in embedded systems are more popular than the ones mentioned above.
Worldwide device shipments[edit]
|
|
This section needs to be updated. Please help update this article to reflect recent events or newly available information. |
In May 2020, Gartner predicted a decline in all market segments for 2020 (from already declining market in 2019) due to COVID-19, predicting a decline by 13.6% for all devices, while «Work from Home Trend Saved PC Market from Collapse», with them only predicting to decline by 10.5% for PCs. However, in the end according to Gartner, PC shipments grew «10.7% in Fourth Quarter of 2020 and […] reached 275 million units in 2020, a 4.8% increase from 2019 and the highest growth in ten years.» Apple in 4th place for PCs had the largest growth in shipments for a company in Q4 of 31.3%, while «the fourth quarter of 2020 was another remarkable period of growth for Chromebooks, with shipments increasing around 200% year over year to reach 11.7 million units. In 2020, Chromebook shipments increased over 80% to total nearly 30 million units, largely due to demand from the North American education market.»[12] Chromebooks sold more than Apple’s Macs worldwide.
According to Gartner, the following is the worldwide device shipments (referring to wholesale) by operating system, which includes smartphones, tablets, laptops and PCs together.
| Source | Year | Android | iOS/macOS | Windows | Others |
|---|---|---|---|---|---|
| Gartner[13] | 2019 (2.161 bln) | ||||
| Gartner[14] | 2017 (2.278 bln) | ||||
| Gartner[15] | 2016 (2.332 bln) | 10.63% (248 mln) | 11.2% (260 mln) | ||
| Gartner[11] | 2015 (2.4 bln) | 54.16% (1.3 bln) | 12.37% (297 mln)
macOS = 1% |
11.79% (283 mln) | 21.66% |
| Gartner[16] | 2014 | 48.61% | 11.04% | 14.0% | 26.34% |
| Gartner[17] | 2013 | 38.51% | 10.12% | 13.98% | 37.41% |
| Gartner[18] | 2012 | 22.8% | 9.6% | 15.62% | 51.98% |
Shipments (to stores) do not mean sales to consumers (not necessarily in the year of shipment), therefore suggesting the numbers indicate popularity and/or usage could be misleading. Not only do smartphones sell in higher numbers than traditional PCs – but also as a whole a lot more, by dollar value – with the gap only projected to widen, to well over double.[19]
For 2015 (and earlier), Gartner reports for «the year, worldwide PC shipments declined for the fourth consecutive year, which started in 2012 with the launch of tablets» with an 8% decline in PC sales for 2015 (not including cumulative decline in sales over the previous years).[20] Gartner includes Macs (running macOS) in PC sales numbers (but not e.g. iPads and Androids), and they individually had a slight increase in sales in 2015.
On 28 May 2015, Google announced that there were 1.4 billion Android users and 1 billion Google play users active during that month.[21][22] This changed to 2 billion monthly active users in May 2017.[23][24]
On 27 January 2016, Paul Thurrott summarized the operating system market, the day after Apple announced «one billion devices»:
Apple’s «active installed base» is now one billion devices. [..] Granted, some of those Apple devices were probably sold into the market place years ago. But that 1 billion figure can and should be compared to the numbers Microsoft touts for Windows 10 (200 million, most recently) or Windows more generally (1.5 billion active users, a number that hasn’t moved, magically, in years), and that Google touts for Android (over 1.4 billion, as of September).
My understanding of iOS is that the user base was previously thought to be around 800 million strong, and when you factor out Macs and other non-iOS Apple devices, that’s probably about right. But as you can see, there are three big personal computing platforms.— Paul Thurrott[25]
Microsoft backed away from their goal of one billion Windows 10 devices in three years (or «by the middle of 2018»)[26] and reported on 26 September 2016 that Windows 10 was running on over 400 million devices,[27] and in March 2019 on more than 800 million.[28]
By late 2016, Android had been explained to be «killing» Apple’s iOS market share (i.e. its declining sales of smartphones, not just relatively but also by number of units, when the whole market is increasing) with
the gap between the two is growing ever larger all the time.
According to Gartner, Android now boasts a global market share of 86.2 percent. Apple’s iOS is a long way behind with a market share of just 12.9 percent. The rest may as well not even exist [..]
These figures, which cover the second quarter of 2016, show that Android has actually increased its market share by 4 percent over the last year. All other operating systems are down, with iOS losing 1.7 percent [..]
I think it’s fair to declare Android the winner in the mobile operating [system] wars at this point.
— makeuseof.com[29]
As of 9 May 2019, the biggest smartphone companies (by market share) were Samsung, Huawei and Apple, respectively.[30]
Gartner’s own press release said, «Apple continued its downward trend with a decline of 7.7 percent in the second quarter of 2016»,[31] which is their decline, based on absolute number of units, that underestimates the relative decline (with the market increasing), along with the misleading «1.7 percent [point]» decline. That point decline means an 11.6% relative decline (from 14.6% down to 12.9%).
Although in units sold Apple is declining, they are almost the only vendor making any profit in the smartphone sector from hardware sales alone. In Q3 2016 for example, they captured 103.6% of the market profits.[32]
There are more mobile phone owners than toothbrush owners,[33] with mobile phones the fastest growing technology in history.[citation needed] There are a billion more active mobile phones in the world than people (and many more than 10 billion sold so far with less than half still in use), explained by the fact that some people have more than one, such as an extra for work.[34] All the phones have an operating system, but only a fraction of them are smartphones with an OS capable of running modern applications. Currently 3.1 billion smartphones and tablets are in use across the world (with tablets, a small fraction of the total, generally running the same operating systems, Android or iOS, the latter being more popular on tablets. In 2019, a variant of iOS called iPadOS built for iPad tablets was released).
Tablet computers shipments[edit]
In 2015, eMarketer estimated at the beginning of the year that the tablet installed base would hit one billion[35] for the first time (with China’s use at 328 million, which Google Play doesn’t serve or track, and the United States’s use second at 156 million). At the end of the year, because of cheap tablets – not counted by all analysts – that goal was met (even excluding cumulative sales of previous years) as:
Sales quintupled to an expected 1 billion units worldwide this year, from 216 million units in 2014, according to projections from the Envisioneering Group.
While that number is far higher than the 200-plus million units globally projected by research firms IDC, Gartner and Forrester, Envisioneering analyst Richard Doherty says the rival estimates miss all the cheap Asian knockoff tablets that have been churning off assembly lines.[..]
Forrester says its definition of tablets «is relatively narrow» while IDC says it includes some tablets by Amazon — but not all.[..]
The top tech purchase of the year continued to be the smartphone, with an expected 1.5 billion sold worldwide, according to projections from researcher IDC. Last year saw some 1.2 billion sold.[..]
Computers didn’t fare as well, despite the introduction of Microsoft’s latest software upgrade, Windows 10, and the expected but not realized bump it would provide for consumers looking to skip the upgrade and just get a new computer instead.
Some 281 million PCs were expected to be sold, according to IDC, down from 308 million in 2014. Folks tend to be happy with the older computers and keep them for longer, as more of our daily computing activities have moved to the smartphone.[..]
While Windows 10 got good reviews from tech critics, only 11% of the 1-billion-plus Windows user base opted to do the upgrade, according to Microsoft. This suggests Microsoft has a ways to go before the software gets «hit» status. Apple’s new operating system El Capitan has been downloaded by 25% of Apple’s user base, according to Apple.
This conflicts with statistics from IDC that say the tablet market contracted by 10% in 2015 with only Huawei, ranked fifth, with big gains, more than doubling their share; for fourth quarter 2015, the five biggest vendors were the same except that Amazon Fire tablets ranked third worldwide, new on the list, enabled by its not quite tripling of market share to 7.9%, with its Fire OS Android-derivative.[37]
| Source | Year | Android | iOS | Windows | Others |
|---|---|---|---|---|---|
| Strategy Analytics[38] | Q2 2022 | 49% | 38% | 11% | 2% |
| Statista[39] | 2020 | 59.4% | 29.8% | 10.21% | 0.59% |
| Strategy Analytics[40] | 2015 | 68% | 22% | 10% | <0.1% |
| Gartner[41] | 2013 | 61.9% | 36.0% | 2.1% | <0.1% |
| Gartner[41] | 2012 | 45.8% | 52.8% | 1.0% | 0.3% |
Gartner excludes some devices from their tablet shipment statistic and includes them in a different category called «premium ultramobiles» with screen sizes of more than 10″ inches.[42]
Smartphone shipments[edit]
Worldwide smartphone sales to end users by operating systems, as measured by Gartner, International Data Corporation (IDG) and others:
| Source | Method | Quarter/month | Android (including forks) |
iOS | Windows (all versions) |
BlackBerry (all versions) |
Symbian | Others |
|---|---|---|---|---|---|---|---|---|
| Statista[43] | based on page views per month worldwide | 2022 Q4 | 71.1% | 28.3% | N/A | N/A | N/A | 0.6% |
| Gartner[44] | Units sold in quarter | 2018 Q1 | 85.9% | 14.1% | N/A | N/A | N/A | 0.0% |
| Gartner[45] | Units sold per year | 2017 | 85.9% | 14.0% | N/A | N/A | N/A | 0.1% |
| Gartner[46] | Units sold in quarter | 2017 Q1 | 86.1% | 13.7% | N/A | N/A | N/A | 0.2% |
| Gartner[47] | Units sold per year | 2016 | 84.8% | 14.4% | N/A | N/A | N/A | 0.8% |
| Gartner[48] | Units sold in quarter | 2016 Q4 | 81.7% | 17.9% | 0.3% | 0.0% | N/A | 0.1% |
| Gartner[49] | Units sold in quarter | 2016 Q3 | 87.8% | 11.5% | 0.4% | 0.1% | N/A | 0.2% |
| Gartner[50] | Units sold in quarter | 2016 Q2 | 86.2% | 12.9% | 0.6% | 0.1% | N/A | 0.2% |
| Gartner[51] | Units sold in quarter | 2016 Q1 | 84.1% | 14.8% | 0.7% | 0.2% | N/A | 0.2% |
| Gartner[52] | Units sold in quarter | 2015 Q4 | 80.7% | 17.7% | 1.1% | 0.2% | N/A | 0.2% |
| Gartner[53] | Units sold in quarter | 2015 Q2 | 82.2% | 14.6% | 2.5% | 0.3% | N/A | 0.4% |
| Gartner[54] | Units sold in quarter | 2014 Q4 | 76.0% | 20.4% | 2.8% | 0.5% | N/A | 0.4% |
| Strategy Analytics[55] | Units shipped in quarter | 2014 Q3 | 81.3% | 13.4% | 4.1% | 1.0% | N/A | 0.2% |
| Gartner[56] | Units sold in quarter | 2014 Q2 | 83.8% | 12.2% | 2.8% | 0.7% | N/A | 0.5% |
| Gartner[57] | Units sold in quarter | 2013 Q2 | 79.0% | 14.2% | 3.3% | 2.7% | 0.3% | 0.6% |
| Gartner[58] | Units sold in quarter | 2013 Q1 | 74.4% | 18.2% | 2.9% | 3.0% | 0.6% | 1.0% |
| International Data Corporation[59] | Units shipped in quarter | 2013 Q1 | 75.0% | 17.3% | 3.2% | 2.9% | 0.6% | 0.0% |
Web clients[edit]
|
|
This section needs to be updated. Please help update this article to reflect recent events or newly available information. |
| Web clients’ OS family statistics | ||
|---|---|---|
| Android (or based on) | 42.67% | |
| Windows | 29.56% | |
| Apple’s iOS | 17.38% | |
| Apple’s macOS | 6.07% | |
| Unknown | 2.04% | |
| Other | 1.25% | |
| Linux | 0.98% | |
| Web clients’ OS family market share according to StatCounter for April 2022.[60] The information on web clients is obtained from user agent information obtained through JavaScript code run by web browsers supplied to web servers. «Unknown» is probably mostly Windows operating systems.[citation needed] These figures have a large margin of error for a variety of reasons. For a discussion on the shortcomings see usage share of web browsers. |
The most recent data from various sources published during the last twelve months is summarized in the table below. All of these sources monitor a substantial number of web sites; statistics related to one web site only are excluded.
Android currently ranks highest,[61] above Windows (incl. Xbox console) systems. Windows Phone accounted for 0.51% of the web usage, before it was discontinued.[62]
Considering all personal computing devices, Microsoft Windows is well below 50% usage share on every continent, and at 30% in the US (24% single-day low) and in many countries lower, e.g. China, and in India at 19% (12% some days) and Windows’ lowest share globally was 29% in May 2022 (25% some days), and 29% in the US.[63]
iOS is slightly more popular than Windows in the US, and has been more used the last 6 months, on a monthly average basis,[64] or for up to 11 weeks in a row (weekly average).[65] That’s because it’s much more popular on the weekends, while Windows usually more used on weekdays. iOS has however been more used for up to almost 2 weeks, every day of that time-span, and even on some days, such as 29 May 2022, Android is also more used than Windows meaning iOS and Android are up to 2.6× more used than Windows there.[66] Worldwide, Android at 43.23% is 48% more used than Windows, next at 29.2%, and iOS third at 17.67% meaning the mobile operating systems Android and iOS are combined a bit over 2× more popular then Windows. In Africa, Android at 62.66% (for May alone is 3.3× (almost 4× with iOS) than Windows at 18.81 (and iOS third at 10.74%).[67] For a 12-month average Android is only 2.1× more popular than Windows in Africa.
Before iOS became the most popular operating system in any independent country, it was most popular in Guam, an unincorporated territory of the United States, for four consecutive quarters in 2017-18,[68][69] although Android is now the most popular there.[70] iOS has been the highest ranked OS in Jersey (a British Crown dependency in Europe) for years, by a wide margin, and iOS was also highest ranked in Falkland Islands, a British Overseas Territory, for one quarter in 2019, before being overtaken by Android in the following quarter.[71][72] iOS is competitive with Windows in Sweden, where some days it is more used.[73]
The designation of an «Unknown» operating system is strangely high in a few countries such as Madagascar where it was at 32.44% (no longer near as high).[74] This may be due to the fact that StatCounter uses browser detection to get OS statistics, and there the most common browsers are not often used. The version breakdown for browsers in Madagascar shows «Other» at 34.9%,[75] and Opera Mini 4.4 is the most popular known browser at 22.1% (plus e.g. 3.34% for Opera 7.6). However browser statistics without version-breakdown has Opera at 48.11% with the «Other» category very small.[76][clarification needed]
In China, Android got to be the highest ranked operating system in July 2016 (Windows has occasionally topped it since then, while since April 2016 it or all non-mobile operating systems haven’t outranked mobile operating systems, meaning Android plus iOS).[77] In the Asian continent as a whole, Android has been ranked highest since February 2016 and Android alone has the majority share,[78] because of a large majority in all the most populous countries of the continent, up to 84% in Bangladesh, where it has had over 70% share for over four years.[79] Since August 2015, Android is ranked first, at 48.36% in May 2016, in the African continent – when it took a big jump ahead of Windows 7,[80] and thereby Africa joined Asia as a mobile-majority continent. China is no longer a desktop-majority country,[81] joining India, which has a mobile-majority of 71%, confirming Asia’s significant mobile-majority.
Online usage of Linux kernel derivatives (Android + ChromeOS + other Linux) exceeds that of Windows. This has been true since some time between January and April 2016, according to W3Counter[82] and StatCounter.[83]
However, even before that, the figure for all Unix-like OSes, including those from Apple, was higher than that for Windows.
| Source | Date | Microsoft Windows (kernel): |
Apple Darwin: |
Linux kernel: |
Others:[b] | |||||||||
|---|---|---|---|---|---|---|---|---|---|---|---|---|---|---|
| 10 | 8/8.1 | 7 | Vista | XP | WP&RT | Other | macOS | iOS | Linux | Android | Other | |||
| W3Counter[84] | Oct 2022 | N/A | N/A | N/A | N/A | N/A | N/A | N/A | N/A | |||||
| W3Counter[85] | Oct
2020 |
20.55% |
N/A | 6.74% |
N/A | N/A | N/A | N/A | 8.06% |
13.67% |
N/A | 37.44% |
N/A | N/A |
| W3Counter[86] | Jun 2019 | N/A | N/A | N/A | N/A | N/A | N/A | N/A | N/A | |||||
| W3Counter[86] | Jun 2018 | N/A | N/A | N/A | N/A | N/A | N/A | N/A | N/A | |||||
| W3Counter[87] | Dec 2016 | N/A | N/A | N/A | N/A | N/A | ||||||||
| StatCounter Global Stats[88] | Mar 2017 | 0% | ||||||||||||
| StatCounter Global Stats[88] | Dec 2016 | |||||||||||||
| StatCounter Global Stats[89] | Oct 2016 | |||||||||||||
| StatCounter Global Stats[90] | May 2016 | |||||||||||||
| StatCounter Global Stats[90] | Dec 2015 | |||||||||||||
| Wikimedia[91] | Dec 2016 | 14.0% | 4.65% | 18.0% | 0.43% | 1.70% | 0.93% | 0.50% | 5.4% | 19.0% | 0.80% | 23.0% | 0.30% | 11.29% |
Desktop and laptop computers[edit]
|
|
This section needs to be updated. Please help update this article to reflect recent events or newly available information. |
Windows is still the dominant desktop OS, but the dominance varies by region and it has gradually lost market share to other desktop operating systems (not just to mobile) with the slide very noticeable in the US, where macOS usage has more than quadrupled from Jan. 2009 to Dec. 2020 to 30.62% (i.e. in Christmas month; and 34.72% in April 2020 in the middle of COVID-19, and iOS was more popular overall that year;[93] globally Windows lost to Android that year,[94] as for the two years prior), with Windows down to 61.136% and ChromeOS at 5.46%, plus traditional Linux at 1.73%.[95]
There is little openly published information on the device shipments of desktop and laptop computers. Gartner publishes estimates, but the way the estimates are calculated is not openly published. Another source of market share of various operating systems is StatCounter[96] basing its estimate on web use (although this may not be very accurate). Also, sales may overstate usage. Most computers are sold with a pre-installed operating system, with some users replacing that OS with a different one due to personal preference, or installing another OS alongside it and using both. Conversely, sales underestimate usage by not counting unauthorized copies. For example, in 2009, approximately 80% of software sold in China consisted of illegitimate copies.[97] In 2007, the statistics from an automated update of IE7 for registered Windows computers differed with the observed web browser share, leading one writer to estimate that 25–35% of all Windows XP installations were unlicensed.[98]
The usage share of Microsoft’s (then latest operating system) Windows 10 has slowly increased since July/August 2016, reaching around 27.15% (of all Windows versions, not all desktop or all operating systems) in December 2016. It eventually reached 79.79% on 5 October 2021, the same day on which its successor Windows 11 was released.
Web analysis shows significant variation in different parts of the world. For example, macOS use varies a lot by region, in North America claims 16.82%[99] (17.52%[100] in the US) whereas in Asia it is only 4.4%.[101] In the United States usage of Windows XP has dropped to 0.38% (of all Windows versions), and its global average to 0.59%, while in Africa it is still at 2.71%, and it still has double-digit share in at least one country.[102]
Since mid-2020, the world uses smartphones more than desktop (including laptop) computers.[103][104][105] For global statistics it’s every day of the week. It has also happened for all individual continents (at least for some weeks, and also for the United States[106][107][108][109] where the smartphone share has gone up to 54%, both on July 9, 2019, a Sunday,[110] and also that high in 2021). The proportions do vary widely by region (more so than by the day), e.g. in Africa the smartphone share is highest at 69%, in Asia at 65% and in South America at 50.19%, while in the United States it’s at 46% and desktop at 50%. On some continents, e.g. North America and the US, smartphone use may only go over 50% on weekends, since smartphones usage increases on weekends,[111][112][113][114] while the smartphone share has gone up to 54% for a single day (Thanksgiving), and on average over 50% for full week.[115][116]
Smartphones (58.01%)
Desktops/Laptops (39.49%)
Tablets (2.46%)
Console (0.06%)
The 2019 Stack Overflow developer survey provides no detail about particular versions of Windows. The desktop operating system share among those identifying as professional developers was:[117]
- Windows: 45.3%
- macOS: 29.2%
- Linux: 25.3%
- BSD/Unix: 0.1%
Microsoft data on Windows usage[edit]
In June 2016, Microsoft claimed Windows 10 had half the market share of all Windows installations in the US and UK, as quoted by BetaNews:
Microsoft’s Windows trends page [shows] Windows 10 hit 50 percent in the US (51 percent in the UK, 39 percent globally), while … Windows 7 was on 38 percent (36 percent in the UK, 46 percent globally).
A big reason for the difference in numbers comes down to how they are recorded. … actual OS usage (based on web browsing), while Microsoft records the number of devices Windows 10 is installed on. … Microsoft also only records Windows 7, Windows 8, Windows 8.1 and Windows 10, while NetMarketShare includes both XP and Vista.— BetaNews[118]
Desktop computer games[edit]
The digital video game distribution platform Steam publishes a monthly «Hardware & Software Survey», with the statistics below:
| Month | Microsoft Windows | Mac OS† | Linux† | Other |
|---|---|---|---|---|
| December 2022[119] | 96.15% | 2.48% | 1.38% | |
| December 2021 | 96.19% | 2.70% | 1.11% | |
| December 2020[119] | 96.41% | 2.82% | 0.78% | |
| December 2019[120] | 96.89% | 2.47% | 0.67% | |
| January 2019[121] | 95.92% | 3.27% | 0.82% | |
| January 2018[122] | 98.38% | 1.31% | 0.25% | |
| January 2017[123] | 95.79% | 3.31% | 0.80% | |
| January 2016[124] | 95.39% | 3.55% | 0.95% | |
| January 2015[125] | 95.48% | 3.32% | 1.09% | |
| January 2014[126] | 94.93% | 3.47% | 0.86% | 0.74% |
^† These figures, as reported by Steam, do not include SteamOS statistics.[127]
Mobile devices[edit]
Smartphones OS by usage[edit]
By Q1 2018, mobile operating systems on smartphones included Google’s dominant Android (and variants) and Apple’s iOS which combined had an almost 100% market share.[128]
Smartphone penetration vs. desktop use differs substantially by country. Some countries, like Russia, still have smartphone use as low as 22.35% (as a fraction of all web use),[129] but in most western countries, smartphone use is close to 50% of all web use. This doesn’t mean that only half of the population has a smartphone, could mean almost all have, just that other platforms have about equal use. Smartphone usage share in developing countries is much higher – in Bangladesh, for example, Android smartphones had up to 84% and currently 70% share,[79] and in Mali smartphones had over 90% (up to 95%) share for almost two years.[130][131] (A section below has more information on regional trends on the move to smartphones.)
There is a clear correlation between the GDP per capita of a country and that country’s respective smartphone OS market share, with users in the richest countries being much more likely to choose Apple’s iPhone, with Google’s Android being predominant elsewhere.[132][133][134]
| Source | Method | Quarter/month | Android (including forks) |
iOS | Windows (all versions) |
BlackBerry (all versions) |
Symbian | Others |
|---|---|---|---|---|---|---|---|---|
| StatCounter Global Stats[135] | Browsing (page view) | 2021, Oct | 71.09% | 28.21% | 0.01% | N/A | N/A | 0.69% |
| StatCounter Global Stats[136] | Browsing (page view) | 2020, Oct | 72.93% | 26.53% | 0.03% | N/A | N/A | 0.51% |
| StatCounter Global Stats | Browsing (page view) | 2019, Sep | 76.24% | 22.48% | 0.17% | 0.02% | 0.02% | 1.07% |
| StatCounter Global Stats[137] | Browsing (page view) | 2015, Mar | 61.94% | 22.64% | 2.27% | NA | 6.00% | 7.09% |
| StatCounter Global Stats[137] | Browsing (page view) | 2014, Aug | 54.87% | 23.57% | 2.36% | 1.59% | 9.73% | 7.87% |
| StatCounter Global Stats[137] | Browsing (page view) | 2014, Feb | 47.57% | 22.97% | 2.22% | 2.62% | 14.86% | 6.08% |
| Wikimedia (includes tablets)[d] | Browsing (page view) | 2013, Mar | 25.93% | 66.53% | 1.85% | 2.02% | 3.03% | 1.12% |
| Source | Method | Quarter/month | Android (including forks) |
iOS | Windows (all versions) |
BlackBerry (all versions) |
Symbian | Others |
|---|---|---|---|---|---|---|---|---|
| comScore[138] (US only) | US subscribers | 2017, Jan | 52.0% | 43.9% | 1.5% | 0.5% | N/A | N/A |
| comScore[139] (US only) | US subscribers | 2016, Jan | 52.8% | 43.6% | 2.7% | 0.8% | N/A | N/A |
| comScore[140] (US only) | US subscribers | 2015, Jan | 53.2% | 41.3% | 3.6% | 1.8% | 0.1% | N/A |
| comScore[141] (US only) | US subscribers | 2014, Jan | 51.7% | 41.6% | 3.2% | 3.1% | 0.2% | N/A |
| comScore[142] (US only) | US subscribers | 2012, Feb | 50.1% | 30.2% | 3.9% | 13.4% | 1.5% | N/A |
| comScore[143] (US only) | US subscribers | 2010, Dec | 28.7% | 25.0% | 8.4% | 31.6% | N/A | 3.7% |
Tablet computers OS by usage[edit]
|
|
This section needs to be updated. Please help update this article to reflect recent events or newly available information. |
Tablet computers, or simply tablets, became a significant OS market share category starting with Apple’s iPad. In Q1 2018, iOS had 65.03% market share and Android had 34.58% market share.[144] Windows tablets may not get classified as such by some analysts, and thus barely register; e.g. 2-in-1 PCs may get classified as «desktops», not tablets.
Since 2016, in South America (and Cuba[145] in North America), Android tablets have gained majority,[146] and in Asia in 2017 Android was slightly more popular than the iPad, which was at 49.05% usage share in October 2015.[147][148][149] In Africa, Android tablets are much more popular while elsewhere the iPad has a safe margin.
As of March 2015, Android has made steady gains to becoming the most popular tablet operating system:[150] that is the trend in many countries, having already gained the majority in large countries (India at 63.25%,[151] and in Indonesia at 62.22%[152]) and in the African continent with Android at 62.22% (first to gain Android majority in late 2014),[153] with steady gains from 20.98% in August 2012[154] (Egypt at 62.37%,[155] Zimbabwe at 62.04%[155]), and South America at 51.09% in July 2015.[156] (Peru at 52.96%[157]). Asia is at 46%.[158] In Nepal, Android gained majority lead in November 2014 but lost it down to 41.35% with iOS at 56.51%.[159] In Taiwan, as of October 2016, Android after having gained a confident majority, has been on a losing streak.[160] China is a major exception to Android gaining market share in Asia (there Android phablets are much more popular than Android tablets, while similar devices get classified as smartphones) where the iPad/iOS is at 82.84% in March 2015.[161]
| Source | Month | iOS | Android | Windows | Others |
|---|---|---|---|---|---|
| StatCounter[162] | Oct 2020 | 58.86% | 41.02% | 0.08% | 0.04% |
| StatCounter[163] | Dec 2019 | 63.11% | 36.65% | 0.15% | 0.09% |
| StatCounter[164] | Jul 2018 | 65.03% | 34.58% | 0.21% | 0.18% |
| StatCounter[165] | Jul 2015 | 65.51% | 31.36% | 0.78% | 2.93% |
| StatCounter[166] | Feb 2015 | 66.47% | 29.6% | 1.16% | 2.73% |
| StatCounter[167] | Oct 2014 | 71.67% | 25.62% | 0.08% | 2.63% |
[edit]
|
|
This section needs to be updated. Please help update this article to reflect recent events or newly available information. |
According to StatCounter web use statistics (a proxy for all use), smartphones are more popular than desktop computers globally (and Android in particular more popular than Windows). Including tablets with mobiles/smartphones, as they also run so-called mobile operating systems, even in the United States (and most countries) are mobiles including tablets more popular than other (older originally made for desktops) operating systems (such as Windows and macOS). Windows in the US (at 33.42%) has only 8% head-start (2.55-percentage points) over iOS only; with Android, that mobile operating system and iOS have 52.14% majority.[168] Alternatively, Apple, with iOS plus their non-mobile macOS (9.33%) has 20% more share (6.7-percentage points more) than Microsoft’s Windows in the country where both companies were built.
Although desktop computers are still popular in many countries (while overall down to 44.9% in the first quarter of 2017[169]), smartphones are more popular even in many developed countries. A few countries on all continents are desktop-minority with Android more popular than Windows; many, e.g. Poland in Europe, and about half of the countries in South America, and many in North America, e.g. Guatemala, Honduras, Haiti; up to most countries in Asia and Africa[170] with smartphone-majority because of Android, Poland and Turkey in Europe highest with 57.68% and 62.33%, respectively. In Ireland, smartphone use at 45.55% outnumbers desktop use and mobile as a whole gains majority when including the tablet share at 9.12%.[171][172] Spain was also slightly desktop-minority. As of July 2019, Sweden had been desktop-minority for eight weeks in a row.[173]
The range of measured mobile web use varies a lot by country, and a StatCounter press release recognizes «India amongst world leaders in use of mobile to surf the internet»[174] (of the big countries) where the share is around (or over) 80%[175] and desktop is at 19.56%, with Russia trailing with 17.8% mobile use (and desktop the rest).
Smartphones (discounting tablets), first gained majority in December 2016 (desktop-majority was lost the month before),[where?] and it wasn’t a Christmas-time fluke, as while close to majority after smartphone majority happened again in March 2017.[176][clarification needed]
In the week of 7–13 November 2016, smartphones alone (without tablets) overtook desktop for the first time, albeit for a short period.[177] Examples of mobile-majority countries include Paraguay in South America, Poland in Europe and Turkey and most of Asia and Africa. Some of the world is still desktop-majority, with for example the United States at 54.89% (but not on all days).[178] However, in some territories of the United States, such as Puerto Rico,[179] desktop is significantly under majority, with Windows just under 25%, overtaken by Android.
On 22 October 2016 (and subsequent weekends), mobile showed majority.[180] Since 27 October, the desktop hasn’t had a majority, including on weekdays. Smartphones alone have showed majority since 23 December to the end of the year, with the share topping at 58.22% on Christmas Day.[181] To the «mobile»-majority share of smartphones, tablets could be added giving a 63.22% majority. While an unusually high top, a similar high also occurred on Monday 17 April 2017, with the smartphone share slightly lower and tablet share slightly higher, combining to 62.88%.
Formerly, according to a StatCounter press release, the world has turned desktop-minority;[182] as of October 2016, at about 49% desktop use for that month, but mobile wasn’t ranked higher, tablet share had to be added to it to exceed desktop share.
For the Christmas season (i.e. temporarily, while desktop-minority remains and smartphone-majority on weekends[183][184]), the last two weeks in December 2016, Australia (and Oceania in general)[185] was desktop-minority for the first time for an extended period, i.e. every day from 23 December.[186]
In South America, smartphones alone took majority from desktops on Christmas Day,[184] but for a full-week-average, desktop is still at least at 58%.[187]
The UK desktop-minority dropped down to 44.02% on Christmas Day and for the eight days to the end of the year.[188] Ireland joined some other European countries with smartphone-majority, for three days after Christmas, topping that day at 55.39%.[189][190]
In the US, desktop-minority happened for three days on and around Christmas (while a longer four-day stretch happened in November, and happens frequently on weekends).[191]
According to StatCounter web use statistics (a proxy for all use), in the week from 7–13 November 2016, «mobile» (meaning smartphones) alone (without tablets) overtook desktop, for the first time, with them highest ranked at 52.13% (on 27 November 2016)[192] or up to 49.02% for a full week.[193][194] Mobile-majority applies to countries such as Paraguay in South America, Poland in Europe and Turkey; and the continents Asia and Africa. Large regions of the rest of the world are still desktop-majority, while on some days, the United States,[195] (and North America as a whole)[196] isn’t; the US is desktop-minority up to four days in a row,[197] and up to a five-day average.[198] Other examples, of desktop-minority on some days, include the UK,[196] Ireland,[199] Australia[200] (and Oceania as a whole); in fact, at least one country on every continent[201][202][203] has turned desktop-minority (for at least a month). On 22 October 2016 (and subsequent weekends), mobile has shown majority.[204]
Previously, according to a StatCounter press release, the world has turned desktop-minority;[205] as of October 2016, at about 49% desktop use for that month,[206][207] with desktop-minority stretching up to an 18-weeks/4-months period from 28 June to 31 October 2016,[208][209] while whole of July, August or September 2016, showed desktop-majority (and many other long sub-periods in the long stretch showed desktop-minority; similarly only Fridays, Saturdays and Sundays are desktop-minority). The biggest continents, Asia and Africa, have shown vast mobile-majority for long time (any day of the week), as well as several individual countries elsewhere have also turned mobile-majority: Poland, Albania (and Turkey)[210] in Europe and Paraguay and Bolivia[211] in South America.[212]
According to StatCounter’s web use statistics, Saturday 28 May 2016, was the day when smartphones («mobile» at StatCounter, that now counts tablets separately) became a most used platform, ranking first, at 47.27%, above desktops.[213][214] The next day, desktops slightly outnumbered «mobile» (unless counting tablets: some analysts count tablets with smartphones or separately while others with desktops – even when most tablets are iPad or Android, not Windows devices).[215]
Since Sunday 27 March 2016, the first day the world dipped to desktop-minority,[216] it has happened almost every week, and by week of 11–17 July 2016, the world was desktop-minority,[217] followed by the next week, and thereon also for a three-week period.[218] The trend is still stronger on weekends, with e.g. 17 July 2016 showed desktop at 44.67%, «mobile» at 49.5% plus tablets at 5.7%.[219] Recent weekly data shows a downward trend for desktops.[220][221]
According to StatCounter web use statistics (a proxy for overall use), on weekends desktops worldwide lose about 5 percent points, e.g. down to 51.46% on 15 August 2015, with the loss in (relative) web use going to mobile (and also a minuscule increase for tablets),[222] mostly because Windows 7, ranked 1st on workdays, declines in web use, with it shifting to Android and lesser degree to iOS.[223]
Two continents, have already crossed over to mobile-majority (because of Android), based on StatCounters web use statistics. In June 2015, Asia became the first continent where mobile overtook desktop[224] (followed by Africa in August;[225] while Nigeria had mobile majority in October 2011,[226][227] because of Symbian – that later had 51% share, then Series 40 dominating, followed by Android as dominating operating system[228]) and as far back as October 2014, they had reported this trend on a large scale in a press release: «Mobile usage has already overtaken desktop in several countries including India, South Africa and Saudi Arabia».[229] In India, desktop went from majority, in July 2012, down to 32%.[230] In Bangladesh desktop went from majority, in May 2013, down to 17%, with Android alone now accounting for majority web use.[231] Only a few African countries were still desktop-majority[232] and many have a large mobile majority including Ethiopia and Kenya, where mobile usage is over 72%.[233]
The popularity of mobile use worldwide has been driven by the huge popularity increase of Android in Asian countries, where Android is the highest ranked operating system statistically in virtually every south-east Asian country,[234] while it also ranks most popular in almost every African country. Poland has been desktop-minority since April 2015,[235] because of Android being vastly more popular there,[236] and other European countries, such as Albania (and Turkey), have also crossed over. The South America continent is somewhat far from losing desktop-majority, but Paraguay had lost it as of March 2015.[237] Android and mobile browsing in general has also become hugely popular in all other continents where desktop has a large desktop base and the trend to mobile is not as clear as a fraction of the total web use.
While some analysts count tablets with desktops (as some of them run Windows), others count them with mobile phones (as the vast majority of tablets run so-called mobile operating systems, such as Android or iOS on the iPad). iPad has a clear lead globally, but has clearly lost the majority to Android in South America,[238] and a number of Eastern European countries such as Poland; lost virtually all African countries and has lost the majority twice in Asia, but gained the majority back (while many individual countries, e.g. India and most of the middle East have clear Android majority on tablets).[239] Android on tablets is thus second most popular after the iPad.[240]
In March 2015, for the first time in the US the number of mobile-only adult internet users exceeded the number of desktop-only internet users with 11.6% of the digital population only using mobile compared to 10.6% only using desktop; this also means the majority, 78%, use both desktop and mobile to access the internet.[241] A few smaller countries in North America, such as Haiti (because of Android) have gone mobile majority (mobile went to up to 72.35%, and is at 64.43% in February 2016).[242]
Revenue[edit]
The region with the largest Android usage[61] also has the largest mobile revenue.[243]
| 2020[244] | |
|---|---|
| Asia Pacific | $85.3B |
| North and South America | $74.5B |
| Europe, Middle East, and Africa | $29.1B |
Public servers on the Internet[edit]
Internet based servers’ market share can be measured with statistical surveys of publicly accessible servers, such as web servers, mail servers[245] or DNS servers on the Internet: the operating systems powering such servers are found by inspecting raw response messages. This method gives insight only into market share of operating systems that are publicly accessible on the Internet.
There will be differences in the result depending on how the sample is done and observations weighted. Usually the surveys are not based on a random sample of all IP addresses, domain names, hosts or organisations, but on servers found by some other method.[citation needed] Additionally, many domains and IP addresses may be served by one host and some domains may be served by several hosts or by one host with several IP addresses.
| Source | Date | Unix, Unix-like | Microsoft Windows | References |
|---|---|---|---|---|
| W3Techs | 14 July 2022 | 80.1% | 20.1% | [246][247] |
| Security Space | Feb 2014 | <79.3% | >20.7% | [248][249] |
|
- Note
- Revenue comparisons often include «operating system software, other bundled software»[251] and are not appropriate for usage comparison as the Linux operating system costs nothing (including «other bundled software»), except if optionally using commercial distributions such as Red Hat Enterprise Linux (in that case, cost of software for all software bundled with hardware has to be known for all operating systems involved, and subtracted). In cases where no-cost Linux is used, such comparisons underestimate Linux server popularity and overestimate other proprietary operating systems such as Unix and Windows.
Mainframes[edit]
Mainframes are larger and more powerful than servers, but not supercomputers. They are used to process large sets of data, for example enterprise resource planning or credit card transactions.
The most common operating system for mainframes is IBM’s z/OS.[citation needed] Operating systems for IBM Z generation hardware include IBM’s proprietary z/OS,[252] Linux on IBM Z, z/TPF, z/VSE and z/VM.
Gartner reported on 23 December 2008, that Linux on System z was used on approximately 28% of the «customer z base» and that they expected this to increase to over 50% in the following five years.[253] Of Linux on IBM Z, Red Hat and Micro Focus compete to sell RHEL and SLES respectively:
- Prior to 2006, Novell claimed a market share of 85% or more for SUSE Linux Enterprise Server.
- Red Hat has since claimed 18.4% in 2007 and 37% in 2008.[254]
- Gartner reported at the end of 2008 that Novell’s SUSE Linux Enterprise Server had an 80% share of mainframe Linux.[253][dead link]
Decline[edit]
Like today’s trend of mobile devices from personal computers,[241] in 1984 for the first time estimated sales of desktop computers ($11.6 billion) exceeded mainframe computers ($11.4 billion). IBM received the vast majority of mainframe revenue.[255]
From 1991 to 1996, AT&T Corporation briefly owned NCR, one of the major original mainframe producers. During the same period, companies found that servers based on microcomputer designs could be deployed at a fraction of the acquisition price and offer local users much greater control over their own systems given the IT policies and practices at that time. Terminals used for interacting with mainframe systems were gradually replaced by personal computers. Consequently, demand plummeted and new mainframe installations were restricted mainly to financial services and government. In the early 1990s, there was a rough consensus among industry analysts that the mainframe was a dying market as mainframe platforms were increasingly replaced by personal computer networks.[256]
In 2012, NASA powered down its last mainframe, an IBM System z9.[257] However, IBM’s successor to the z9, the z10, led a New York Times reporter to state four years earlier that «mainframe technology—hardware, software and services—remains a large and lucrative business for IBM, and mainframes are still the back-office engines behind the world’s financial markets and much of global commerce».[258] As of 2010, while mainframe technology represented less than 3% of IBM’s revenues, it «continue[d] to play an outsized role in Big Blue’s results».[259]
Supercomputers[edit]
Sierra helps to assure the safety, reliability and effectiveness of the United States’ nuclear weapons.
The TOP500 project lists and ranks the 500 fastest supercomputers for which benchmark results are submitted. Since the early 1990s, the field of supercomputers has been dominated by Unix or Unix-like operating systems, and starting in 2017, every top 500 fastest supercomputer uses Linux as its supercomputer operating system.
The last supercomputer to rank #1 while using an operating system other than Linux was ASCI White, which ran AIX. It held the title from November 2000 to November 2001,[260] and was decommissioned in 2006. Then in June 2017, two AIX computers held rank 493 and 494,[261] the last non-Linux systems before they dropped off the list.
Supercomputer OS family – 1993–2021 systems share according to TOP500[262]
Historically all kinds of Unix operating systems dominated, and in the end ultimately Linux remains.
[edit]
| Category | Source | Date | Linux | UNIX and Unix-like (not incl. Linux) | Windows | In‑house | Other |
|---|---|---|---|---|---|---|---|
| Desktop, laptop | Net Applications[263] | Apr 2020 | 2.87% (excl. ChromeOS) plus 0.4% ChromeOS | 9.75% (macOS) | 86.92% (all versions) | 0.06% | |
| Embedded[e] | EE Times[264] | Mar 2019 | 38.42% (embedded Linux, Ubuntu, Android, other) | 2.82% (QNX, LynxOS) | 10.73% (Windows 10, Windows Embedded Compact) | 10.73% | 37.30% |
| Mainframe | Gartner[254] | Dec 2008 | 28% (SLES, RHEL) | 72% (z/OS)[f] | |||
| Server (web) | W3Techs[265] | Sep 2021 | Likely 77.4% (39.8% confirmed)[g] (Ubuntu, CentOS, Debian, Gentoo, RHEL, …)[266] | Less than 1% is confirmed to be UNIX or Unix-like and non-Linux. The top operating systems in order are: 0.3% BSD (97.8% of which is FreeBSD),[267] <0.1% Darwin,[268] <0.1% HP-UX,[269] <0.1% Solaris,[270] and <0.1% Minix.[271][g] | 22.7% (Windows Server 2019, WS2016, WS2012, WS2008) Microsoft’s own webserver runs 6.6% of websites.[272] |
||
| Smartphone, tablet | StatCounter Global Stats[273] | Apr 2020 | 70.80% (Android, KaiOS) | 28.79% (iOS) | 0.07% | 0.34% | |
| Supercomputer | TOP500[274] | Nov 2019 | 100% (Custom) |
See also[edit]
- Comparison of operating systems
- List of operating systems
- Timeline of operating systems
- Usage share of web browsers
- Mobile OS market share
Notes[edit]
- ^ «Shipments refer to sell-in», that is, wholesale.
- ^ The ‘Others’ column is obtained by summing all percentage data and subtracting from 100%.
- ^ Table is only showing mobile OS market share – not the overall market share.
- ^ Wikimedia Foundation statistics consider tablets as part of the mobile OS market share.
- ^ Embedded is a vast category, which has subcategories that include automotive, avionics, health, medical equipment, consumer electronics, intelligent homes, and telecommunications. The aggregated information above may be very different for each subcategory taken separately.
- ^ z/OS’s UNIX environment coexists with its native environment, which dates back to OS/360.
- ^ a b «UNIX and Unix-like (including Linux)» represents 77.4% of the total web server/website market share however 48.2% of that market share does not show «more specifically» which operating system.
References[edit]
- ^ «Operating System Market Share Worldwide». StatCounter Global Stats. Retrieved 7 November 2022.
- ^ «Operating System Market Share Worldwide April 2022». statcounter Global Stats.
- ^ «Mobile Operating System Market Share Worldwide — August 2022». statcounter Global Stats. Retrieved 4 May 2022.
- ^ «Desktop Operating System Market Share Worldwide — August 2022». statcounter Global Stats. Retrieved 13 September 2022.
- ^ «Tablet Operating System Market Share Worldwide». StatCounter Global Stats. Retrieved 7 November 2022.
- ^ «Tablet Operating System Market Share Worldwide». StatCounter Global Stats. Retrieved 7 November 2022.
- ^ «Tablet Operating System Market Share Worldwide». StatCounter Global Stats. Retrieved 7 November 2022.
- ^ «Desktop vs Mobile vs Tablet vs Console Market Share Worldwide — August 2022». statcounter Global Stats. Retrieved 4 May 2022.
- ^ «Desktop vs Mobile vs Tablet vs Console Market Share Worldwide». StatCounter Global Stats. Retrieved 4 May 2022.
- ^ «Desktop vs Mobile vs Tablet vs Console Market Share United States Of America». StatCounter Global Stats. Retrieved 4 May 2022.
- ^ a b «Windows comes up third in OS clash two years early». 1 April 2016. Retrieved 12 April 2016.
- ^ «Gartner Says Worldwide PC Shipments Grew 10.7% in Fourth Quarter of 2020 and 4.8% for the Year». Gartner. Retrieved 3 March 2021.
- ^ «Gartner Forecasts Worldwide Device Shipments to Decline 14% in 2020 Due to Coronavirus Impact». Gartner. Retrieved 3 March 2021.
- ^ «Gartner Says Worldwide Device Shipments Will Increase 2.1 Percent in 2018». 29 January 2018. Retrieved 18 December 2019.
- ^ «Gartner: Windows OS device shipments will falter in 2017». 10 January 2017. Retrieved 18 December 2019.
- ^ «Gartner Says Tablet Sales Continue to Be Slow in 2015». 5 January 2015. Archived from the original on 7 January 2015. Retrieved 6 March 2015.
- ^ «Gartner Says Worldwide Traditional PC, Tablet, Ultramobile and Mobile Phone Shipments to Grow 4.2 Percent in 2014». 7 July 2014. Archived from the original on 11 July 2014. Retrieved 6 March 2015.
- ^ «Gartner Says Worldwide PC, Tablet and Mobile Phone Shipments to Grow 4.5 Percent in 2013 as Lower-Priced Devices Drive Growth». 21 October 2013. Archived from the original on 21 October 2013. Retrieved 6 March 2015.
- ^ «Gartner Says Worldwide End-User Spending on Devices Will Grow 2 Percent in 2017, While Unit Shipments Remain Flat». Retrieved 7 December 2017.
- ^ «Gartner Says Worldwide PC Shipments Declined 8.3 Percent in Fourth Quarter of 2015: Holiday Sales Provided Little Cheer to PC Vendors in 2015» (Press release). 12 January 2016. Retrieved 15 March 2016.
- ^ «Android is now used by 1.4 billion people». The Verge. 29 September 2015.
- ^ «Google I/O website: Keynote». Archived from the original on 18 June 2015. Retrieved 20 January 2016.
- ^ Protalinski, Emil (17 May 2017). «Android passes 2 billion monthly active devices». VentureBeat. Retrieved 17 May 2017.
- ^ Ng, Alfred (17 May 2017). «Google’s Android now powers more than 2 billion devices». CNET. CBS Interactive. Retrieved 17 May 2017.
- ^ Thurrott, Paul (27 January 2016). «Apple’s active installed base is now over 1 billion strong». Retrieved 16 August 2016.
there are three big personal computing platforms. And only one of them is actually declining. We’ll see how Windows 10 fares over the long term, but even if Microsoft hits the 1 billion figure in 1-2 years as promised, it will by then still be the smallest of those three platforms.
- ^ Fuscaldo, Donna (18 July 2016). «Microsoft Backs Away From Windows 10 Goal (MSFT)». investopedia.com. Retrieved 22 March 2017.
- ^ Foley, Mary Jo. «Microsoft: Windows 10 now on 400 million devices». ZDNet.
- ^ Foley, Mary Jo. «Microsoft says Windows 10 is now on more than 800 million devices». ZDNet. Retrieved 11 March 2019.
- ^ Parrack, Dave (18 August 2016). «Android Is Killing iOS, Uber Launches Self-Driving Cars… [Tech News Digest]».
- ^ Gadgets Now Bureau, «World’s 5 biggest smartphone companies», Gadgets Now, 1 Aug 2018, 02.51 PM IST
- ^ «Gartner Says Five of Top 10 Worldwide Mobile Phone Vendors Increased Sales in Second Quarter of 2016: Global Sales of Smartphones Grew 4.3 Percent Year on Year» (Press release). Gartner. 19 August 2016.
- ^ Patrick, Seitz (3 November 2016). «Apple iPhone Grabs 104% Of Smartphone Industry Profit In Q3». Investor’s Business Daily.
- ^ «Are there Really More Mobile Phone Owners than Toothbrush Owners?». www.linkedin.com. Retrieved 15 June 2019.
- ^ Turner, Ash (10 July 2018). «1 Billion More Phones Than People In The World! BankMyCell». BankMyCell. Retrieved 15 June 2019.
- ^ «Tablet Users to Surpass 1 Billion Worldwide in 2015 — eMarketer». emarketer.com. Retrieved 22 March 2017.
- ^ «Tablets have banner 2015». 1 January 2016.
- ^ «IDC: Tablet Shipments Decline For Fifth Straight Quarter — Androidheadlines.com». androidheadlines.com. 1 February 2016. Retrieved 22 March 2017.
- ^ Eric Smith (29 July 2022). «Strategy Analytics: Android Tablet Market Share Falls Below 50% for First Time in 10 Years». Strategy Analytics. Retrieved 9 October 2022.
- ^ «Global tablet shipments by OS 2010-2020». Statista. Retrieved 16 November 2020.
- ^ Eric Smith (23 November 2015). «Tablets: Windows fast becoming a premium OS, says Strategy Analytics». Strategy Analytics. Retrieved 31 March 2016.
- ^ a b Lunden, Ingrid (3 March 2014). «Gartner: 195M Tablets Sold In 2013, Android Grabs Top Spot From iPad With 62% Share». Retrieved 21 July 2014.
- ^ «Ultramobiles». Gartner, Inc. Retrieved 9 October 2022.
- ^ «Mobile operating systems’ market share worldwide from 1st quarter 2009 to 4th quarter 2022». Retrieved 1 December 2022.
- ^ «Gartner Says Worldwide Sales of Smartphones Returned to Growth in First Quarter of 2018». 28 May 2018. Retrieved 22 September 2022.
- ^ «GGartner Says Worldwide Sales of Smartphones Recorded First Ever Decline During the Fourth Quarter of 2017» (Press release). 22 February 2018. Retrieved 22 September 2022.
- ^ «Gartner Says Worldwide Sales of Smartphones Grew 9 Percent in First Quarter of 2017». Retrieved 2 February 2018.
- ^ «GGartner Says Worldwide Sales of Smartphones Recorded First Ever Decline During the Fourth Quarter of 2017» (Press release). 22 February 2018. Retrieved 22 September 2022.
- ^ «Gartner Says Worldwide Sales of Smartphones Grew 7 Percent in the Fourth Quarter of 2016». Retrieved 2 February 2018.
- ^ «Gartner Says Chinese Smartphone Vendors Were Only Vendors in the Global Top Five to Increase Sales in the Third Quarter of 2016» (Press release). Retrieved 9 December 2016.
- ^ «Gartner Says Five of Top 10 Worldwide Mobile Phone Vendors Increased Sales in Second Quarter of 2016» (Press release). Retrieved 9 December 2016.
- ^ «Gartner Says Worldwide Smartphone Sales Grew 3.9 Percent in First Quarter of 2016» (Press release). Retrieved 9 December 2016.
- ^ «Gartner Says Worldwide Smartphone Sales Grew 9.7 Percent in Fourth Quarter of 2015» (Press release). 18 February 2016. Retrieved 22 September 2022.
- ^ «Gartner Says Worldwide Smartphone Sales Recorded Slowest Growth Rate Since 2013» (Press release). 20 August 2015. Retrieved 22 September 2022.
- ^ «Gartner Says Worldwide Smartphone Sales Grew 9.7 Percent in Fourth Quarter of 2015» (Press release). 18 February 2016. Retrieved 22 September 2022.
- ^ «Android Captures Record 81 Percent Share of Global Smartphone Shipments in Q3 2013». Archived from the original on 1 November 2013. Retrieved 1 November 2013.
- ^ «Gartner Says Worldwide Smartphone Sales Recorded Slowest Growth Rate Since 2013» (Press release). 20 August 2015. Retrieved 22 September 2022.
- ^ «Worldwide Smartphone Sales to End Users by Operating System in 2Q13» (Press release).
- ^ «Worldwide Smartphone Sales to End Users by Operating System in 1Q13» (Press release).
- ^ «Android and iOS Combine for 92.3% of All Smartphone Operating System Shipments in the First Quarter While Windows Phone Leapfrogs BlackBerry, According to IDC». www.businesswire.com. 16 May 2013.
- ^ Statcounter. «Operating System Market Share Worldwide: April 2022». gs.statcounter.com. Retrieved 4 May 2022.
- ^ a b «Android overtakes Windows for first time: «Milestone in technology history and end of an era» as Microsoft no longer owns dominant OS» (Press release).
- ^ «StatCounter Global Stats — Browser, OS, Search Engine including Mobile Usage Share». statcounter.com. Retrieved 19 April 2017.
- ^ «Operating System Market Share South America». StatCounter Global Stats. Retrieved 1 October 2020.
- ^ «Operating System Market Share United States Of America». StatCounter Global Stats. Retrieved 19 June 2022.
- ^ «Operating System Market Share United States Of America». StatCounter Global Stats. Retrieved 19 June 2022.
- ^ «Operating System Market Share United States Of America». StatCounter Global Stats. Retrieved 19 June 2022.
- ^ «Operating System Market Share Africa». StatCounter Global Stats. Retrieved 19 June 2022.
- ^ «Operating System Market Share Guam». StatCounter Global Stats. Retrieved 4 December 2019.
- ^ «Operating System Market Share Guam». StatCounter Global Stats. Retrieved 14 July 2019.
- ^ «Operating System Market Share Guam». StatCounter Global Stats. Retrieved 4 December 2019.
- ^ «Operating System Market Share Falkland Islands (malvinas): Q3 2018 — Q2 2019». StatCounter Global Stats. Retrieved 14 July 2019.
- ^ «Operating System Market Share Falkland Islands (malvinas)». StatCounter Global Stats. Retrieved 14 July 2019.
- ^ «Operating System Market Share Sweden». StatCounter Global Stats. Retrieved 14 July 2019.
- ^ «Operating System Market Share Madagascar». StatCounter Global Stats. Retrieved 15 July 2019.
- ^ «Browser Version Market Share Madagascar». StatCounter Global Stats.
- ^ «Browser Market Share Madagascar». StatCounter Global Stats.
- ^ «StatCounter Global Stats — Browser, OS, Search Engine including Mobile Usage Share». statcounter.com. Retrieved 16 October 2019.
- ^ «Top 8 Operating Systems in Asia from July 2014 to September 2019». statcounter.com.
- ^ a b «Operating System Market Share Bangladesh». StatCounter Global Stats. Retrieved 16 October 2019.
- ^ «Top 8 Operating Systems in Africa from July 2014 to Apr 2016». statcounter.com.
- ^ «StatCounter Global Stats — Browser, OS, Search Engine including Mobile Usage Share». statcounter.com. Retrieved 22 March 2017.
- ^ «Global stats». W3 Counter.
- ^ «StatCounter Global Stats — Browser, OS, Search Engine including Mobile Usage Share». statcounter.com. Retrieved 22 March 2017.
- ^ «W3Counter: Global Web Stats — October 2022». www.w3counter.com. Retrieved 1 December 2022.
- ^ «W3Counter: Global Web Stats — October 2020». www.w3counter.com. Retrieved 16 November 2020.
- ^ a b «Global stats». W3 Counter.
- ^ «Global stats». W3 Counter.
- ^ a b «StatCounter Stats through Dec 2016». www.statcounter.com. Retrieved 5 December 2016.
- ^ «Worldwide user OS families in Jul 2016».
- ^ a b «Worldwide user OS families in Dec 2015».
- ^ «Wikimedia Traffic Analysis Report — Operating Systems, 28Nov2016-1Jan2017».
- ^ «Desktop Operating System Market Share Worldwide». StatCounter Global Stats.
- ^ «Operating System Market Share United States Of America». StatCounter Global Stats. Retrieved 5 January 2021.
- ^ «Operating System Market Share Worldwide». StatCounter Global Stats. Retrieved 5 January 2021.
- ^ «Desktop Operating System Market Share United States Of America». StatCounter Global Stats. Retrieved 5 January 2021.
- ^ https://gs.statcounter.com/#desktop-os-ww-monthly-201508-201508-bar StatCounter
- ^ «Software Pirates in China Beat Microsoft to the Punch». The New York Times. 19 October 2009.
- ^ «Around 25–35% of Windows XP systems are pirated (calculations included)». Archived from the original on 4 March 2016.
- ^ «StatCounter Global Stats — Browser, OS, Search Engine including Mobile Usage Share». statcounter.com. Retrieved 22 March 2017.
- ^ «StatCounter Global Stats — Browser, OS, Search Engine including Mobile Usage Share». statcounter.com. Retrieved 22 March 2017.
- ^ «Top 7 Desktop OSs in Asia on May 2016». StatCounter. May 2016. Retrieved 9 April 2016.
- ^ «Desktop Windows Version Market Share Armenia». StatCounter Global Stats. Retrieved 4 October 2021.
- ^ «Desktop vs Mobile vs Tablet vs Console Market Share Worldwide». StatCounter Global Stats. Retrieved 2 October 2021.
- ^ «Desktop vs Mobile vs Tablet vs Console Market Share Worldwide». StatCounter Global Stats. Retrieved 16 November 2020.
- ^ «Desktop vs Mobile vs Tablet vs Console Market Share Worldwide». StatCounter Global Stats. Retrieved 1 October 2020.
- ^ «Desktop vs Mobile vs Tablet vs Console Market Share United States Of America». StatCounter Global Stats. Retrieved 4 October 2021.
- ^ «Desktop vs Mobile vs Tablet vs Console Market Share Oceania». StatCounter Global Stats. Retrieved 4 October 2021.
- ^ «Desktop vs Mobile vs Tablet vs Console Market Share Europe». StatCounter Global Stats. Retrieved 4 October 2021.
- ^ «Desktop vs Mobile vs Tablet vs Console Market Share North America». StatCounter Global Stats. Retrieved 4 October 2021.
- ^ «Desktop vs Mobile vs Tablet vs Console Market Share United States Of America». StatCounter Global Stats. Retrieved 1 July 2019.
- ^ «Desktop vs Mobile vs Tablet vs Console Market Share United States Of America». StatCounter Global Stats. Retrieved 18 October 2021.
- ^ «Desktop vs Mobile vs Tablet vs Console Market Share United States Of America». StatCounter Global Stats. Retrieved 18 October 2021.
- ^ «Desktop vs Mobile vs Tablet vs Console Market Share United States Of America». StatCounter Global Stats. Retrieved 18 October 2021.
- ^ «Desktop vs Mobile vs Tablet vs Console Market Share Worldwide». StatCounter Global Stats. Retrieved 1 July 2019.
- ^ «Desktop vs Mobile vs Tablet vs Console Market Share United States Of America». StatCounter Global Stats. Retrieved 13 December 2021.
- ^ «Desktop vs Mobile vs Tablet vs Console Market Share United States Of America». StatCounter Global Stats. Retrieved 13 December 2021.
- ^ «Stack Overflow Developer Survey 2019, Primary Operating System». stackoverflow. Retrieved 30 April 2019.
- ^ «Windows 10 has over 50 percent market share, according to Microsoft — wait, what?». BetaNews. 29 August 2016.
- ^ a b Steam Hardware & Software Survey: December 2022, archived from the original on 4 January 2021, retrieved 31 January 2023
- ^ Steam Hardware & Software Survey: December 2019, archived from the original on 2 January 2020
- ^ Steam Hardware & Software Survey: January 2019, archived from the original on 11 February 2019
- ^ Steam Hardware & Software Survey: December 2018, archived from the original on 1 March 2018
- ^ Steam Hardware & Software Survey, archived from the original on 12 February 2017
- ^ Steam Hardware & Software Survey, archived from the original on 10 February 2016
- ^ Steam Hardware & Software Survey, archived from the original on 16 February 2015
- ^ Steam Hardware & Software Survey, archived from the original on 15 February 2014
- ^ «Linux gaming is much healthier than Steam’s Hardware Survey implies». pcworld.com. Retrieved 22 March 2017.
- ^ «Gartner Says Worldwide Sales of Smartphones Returned to Growth in First Quarter of 2018». Gartner, Inc. Gartner. 29 May 2018. Archived from the original on 13 June 2018. Retrieved 25 August 2018.
- ^ «Desktop vs Mobile vs Tablet vs Console Market Share Russian Federation | StatCounter Global Stats». StatCounter Global Stats. Retrieved 16 October 2019.
- ^ «Desktop vs Mobile vs Tablet vs Console Market Share Mali | StatCounter Global Stats». StatCounter Global Stats. Retrieved 16 October 2019.
- ^ «Operating System Market Share Mali». StatCounter Global Stats. Retrieved 15 July 2019.
- ^ Bates, Adam. «InsightPortal | Higher GDP per capita corresponds with more Apple devices, stats suggest». www.insightportal.io. Retrieved 18 October 2017.
- ^ «Google Mobile App Marketing Insights: Asia» (PDF). storage.googleapis.com.
- ^ «Mobile Operating System Market Share India». StatCounter Global Stats. Retrieved 23 January 2019.
- ^ «Mobile Operating System Market Share Worldwide». StatCounter Global Stats. Retrieved 8 October 2022.
- ^ «Mobile Operating System Market Share Worldwide». StatCounter Global Stats. Retrieved 16 November 2020.
- ^ a b c «StatCounter Global Stats — Browser, OS, Search Engine including Mobile Usage Share». StatCounter Global Stats.
- ^ «Comscore Reports April 2017 U.S. Smartphone Subscriber Market Share». comScore, Inc. 8 June 2017. Retrieved 8 October 2022.
- ^ «comScore Reports January 2016 U.S. Smartphone Subscriber Market Share». comScore, Inc. Retrieved 9 December 2016.
- ^ «comScore Reports January 2015 U.S. Smartphone Subscriber Market Share». comScore. 4 March 2015. Retrieved 5 May 2015.
- ^ «comScore Reports January 2014 U.S. Smartphone Subscriber Market Share — comScore, Inc». comScore. 7 March 2014. Retrieved 30 March 2014.
- ^ «Comscore Reports February 2012 U.S. Mobile Subscriber Market Share: Android Captures Majority Share of U.S. Smartphone Market». comScore, Inc. 3 April 2012. Retrieved 8 October 2022.
- ^ «comScore Reports December 2010 U.S. Mobile Subscriber Market Share: Number of Smartphone Users Up 60 Percent Versus Year Agoe». comScore, Inc. 7 February 2011. Retrieved 8 October 2022.
- ^ «Tablet Operating System Market Share Worldwide — July 2018». StatCounter. StatCounter. 29 May 2018. Retrieved 25 August 2018.
- ^ «StatCounter Global Stats — Browser, OS, Search Engine including Mobile Usage Share». statcounter.com. Retrieved 22 March 2017.
- ^ «StatCounter Global Stats — Browser, OS, Search Engine including Mobile Usage Share». statcounter.com. Retrieved 20 October 2017.
- ^ «StatCounter Global Stats — Browser, OS, Search Engine including Mobile Usage Share». statcounter.com. Retrieved 20 October 2017.
- ^ «StatCounter Global Stats — Browser, OS, Search Engine including Mobile Usage Share». statcounter.com. Retrieved 22 March 2017.
- ^ «StatCounter Global Stats — Browser, OS, Search Engine including Mobile Usage Share». statcounter.com. Retrieved 22 March 2017.
- ^ «StatCounter Global Stats — Browser, OS, Search Engine including Mobile Usage Share». statcounter.com.
- ^ «StatCounter Global Stats — Browser, OS, Search Engine including Mobile Usage Share». statcounter.com.
- ^ «StatCounter Global Stats — Browser, OS, Search Engine including Mobile Usage Share». statcounter.com.
- ^ «StatCounter Global Stats — Browser, OS, Search Engine including Mobile Usage Share». statcounter.com.
- ^ «StatCounter Global Stats — Browser, OS, Search Engine including Mobile Usage Share». statcounter.com.
- ^ a b «StatCounter Global Stats — Browser, OS, Search Engine including Mobile Usage Share». statcounter.com.
- ^ «Top 7 Tablet OSes in South America from Aug 2012 to Aug 2015». statcounter.com.
- ^ «StatCounter Global Stats — Browser, OS, Search Engine including Mobile Usage Share». statcounter.com.
- ^ «Top 7 Tablet OSes in South America from Aug 2012 to Sep 2015». statcounter.com.
- ^ «StatCounter Global Stats — Browser, OS, Search Engine including Mobile Usage Share». statcounter.com.
- ^ «StatCounter Global Stats — Browser, OS, Search Engine including Mobile Usage Share». statcounter.com.
- ^ «StatCounter Global Stats — Browser, OS, Search Engine including Mobile Usage Share». statcounter.com.
- ^ «Tablet Operating System Market Share Worldwide». StatCounter Global Stats. Retrieved 16 November 2020.
- ^ «Tablet Operating System Market Share Worldwide». StatCounter Global Stats. Retrieved 16 November 2020.
- ^ «Tablet Operating System Market Share Worldwide». StatCounter Global Stats. Retrieved 16 November 2020.
- ^ Global Stats Top 7 Tablet OSs from Jan to Aug 2015. Retrieved 20 September 2015.
- ^ Global Stats Top 7 Tablet OSs from Feb 2015. Retrieved 16 March 2015.
- ^ Global Stats Top 7 Tablet OSs from Oct 2014. Retrieved 7 March 2015.
- ^ «Operating System Market Share United States Of America». StatCounter Global Stats. Retrieved 16 October 2019.
- ^ «Desktop vs mobile vs tablet vs console market share Worldwide — StatCounter Global Stats». StatCounter Global Stats.
- ^ «Operating System Market Share Worldwide | StatCounter Global Stats». StatCounter Global Stats. Retrieved 10 April 2018.
- ^ «Desktop vs mobile vs tablet vs console market share in Europe — StatCounter Global Stats». StatCounter Global Stats.
- ^ «Desktop vs mobile vs tablet vs console market share Worldwide — StatCounter Global Stats». StatCounter Global Stats.
- ^ «Desktop vs Mobile vs Tablet vs Console Market Share Sweden». StatCounter Global Stats. Retrieved 12 July 2019.
- ^ «India amongst world leaders in use of mobile to surf the internet» (Press release). 28 March 2017.
- ^ «Operating system market share in India — StatCounter Global Stats». StatCounter Global Stats.
- ^ «Desktop vs mobile vs tablet vs console market share Worldwide — StatCounter Global Stats». StatCounter Global Stats.
- ^ «Comparison from W34 to W45 2015». StatCounter Global Stats.
- ^ «StatCounter Global Stats — Browser, OS, Search Engine including Mobile Usage Share».
- ^ «Operating system market share in Puerto Rico — StatCounter Global Stats». StatCounter Global Stats.
- ^ «StatCounter Global Stats — Browser, OS, Search Engine including Mobile Usage Share».
- ^ «StatCounter Global Stats — Browser, OS, Search Engine including Mobile Usage Share». statcounter.com. Retrieved 22 March 2017.
- ^ «Mobile and tablet Internet usage exceeds desktop for first time worldwide». StatCounter (Press release).
- ^ «Desktop vs mobile vs tablet vs console market share Worldwide — StatCounter Global Stats». statcounter.com. Retrieved 3 April 2017.
- ^ a b «Desktop vs mobile vs tablet vs console market share Worldwide — StatCounter Global Stats». statcounter.com. Retrieved 22 March 2017.
- ^ «StatCounter Global Stats — Browser, OS, Search Engine including Mobile Usage Share». statcounter.com. Retrieved 22 March 2017.
- ^ «StatCounter Global Stats — Browser, OS, Search Engine including Mobile Usage Share». statcounter.com. Retrieved 22 March 2017.
- ^ «StatCounter Global Stats — Browser, OS, Search Engine including Mobile Usage Share». statcounter.com. Retrieved 22 March 2017.
- ^ «StatCounter Global Stats — Browser, OS, Search Engine including Mobile Usage Share». statcounter.com. Retrieved 22 March 2017.
- ^ «StatCounter Global Stats — Browser, OS, Search Engine including Mobile Usage Share». statcounter.com. Retrieved 22 March 2017.
- ^ «StatCounter Global Stats — Browser, OS, Search Engine including Mobile Usage Share». statcounter.com. Retrieved 22 March 2017.
- ^ «StatCounter Global Stats — Browser, OS, Search Engine including Mobile Usage Share». statcounter.com. Retrieved 22 March 2017.
- ^ «StatCounter Global Stats — Browser, OS, Search Engine including Mobile Usage Share». statcounter.com. Retrieved 22 March 2017.
- ^ «StatCounter Global Stats — Browser, OS, Search Engine including Mobile Usage Share». statcounter.com. Retrieved 22 March 2017.
- ^ «Comparison from W34 to W47 2016». StatCounter Global Stats.
- ^ «StatCounter Global Stats — Browser, OS, Search Engine including Mobile Usage Share». statcounter.com. Retrieved 22 March 2017.
- ^ a b «StatCounter Global Stats — Browser, OS, Search Engine including Mobile Usage Share». statcounter.com. Retrieved 22 March 2017.
- ^ «StatCounter Global Stats — Browser, OS, Search Engine including Mobile Usage Share». statcounter.com. Retrieved 22 March 2017.
- ^ «StatCounter Global Stats — Browser, OS, Search Engine including Mobile Usage Share». statcounter.com. Retrieved 22 March 2017.
- ^ «StatCounter Global Stats — Browser, OS, Search Engine including Mobile Usage Share». statcounter.com. Retrieved 22 March 2017.
- ^ «StatCounter Global Stats — Browser, OS, Search Engine including Mobile Usage Share». statcounter.com. Retrieved 22 March 2017.
- ^ «StatCounter Global Stats — Browser, OS, Search Engine including Mobile Usage Share». statcounter.com. Retrieved 22 March 2017.
- ^ «StatCounter Global Stats — Browser, OS, Search Engine including Mobile Usage Share». statcounter.com. Retrieved 22 March 2017.
- ^ «StatCounter Global Stats — Browser, OS, Search Engine including Mobile Usage Share». statcounter.com. Retrieved 22 March 2017.
- ^ «StatCounter Global Stats — Browser, OS, Search Engine including Mobile Usage Share». statcounter.com. Retrieved 22 March 2017.
- ^ «Mobile and tablet internet usage exceeds desktop for first time worldwide». StatCounter (Press release).
- ^ «StatCounter Global Stats — Browser, OS, Search Engine including Mobile Usage Share». statcounter.com. Retrieved 22 March 2017.
- ^ «StatCounter Global Stats — Browser, OS, Search Engine including Mobile Usage Share». statcounter.com. Retrieved 22 March 2017.
- ^ «StatCounter Global Stats — Browser, OS, Search Engine including Mobile Usage Share». statcounter.com. Retrieved 22 March 2017.
- ^ «StatCounter Global Stats — Browser, OS, Search Engine including Mobile Usage Share». statcounter.com. Retrieved 22 March 2017.
- ^ «StatCounter Global Stats — Browser, OS, Search Engine including Mobile Usage Share». statcounter.com. Retrieved 22 March 2017.
- ^ «StatCounter Global Stats — Browser, OS, Search Engine including Mobile Usage Share». statcounter.com. Retrieved 22 March 2017.
- ^ «StatCounter Global Stats — Browser, OS, Search Engine including Mobile Usage Share». statcounter.com. Retrieved 22 March 2017.
- ^ «StatCounter Global Stats — Browser, OS, Search Engine including Mobile Usage Share». statcounter.com. Retrieved 22 March 2017.
- ^ «StatCounter Global Stats — Browser, OS, Search Engine including Mobile Usage Share». statcounter.com. Retrieved 22 March 2017.
- ^ «StatCounter Global Stats — Browser, OS, Search Engine including Mobile Usage Share». statcounter.com. Retrieved 22 March 2017.
- ^ https://gs.statcounter.com/#all-comparison-ww-daily-20150701-20160724 Comparison from 1 July 2015 to 24 July 2016
- ^ «StatCounter Global Stats — Browser, OS, Search Engine including Mobile Usage Share». statcounter.com. Retrieved 22 March 2017.
- ^ «StatCounter Global Stats — Browser, OS, Search Engine including Mobile Usage Share». statcounter.com. Retrieved 22 March 2017.
- ^ «StatCounter Global Stats — Browser, OS, Search Engine including Mobile Usage Share». statcounter.com. Retrieved 22 March 2017.
- ^ «StatCounter Global Stats — Browser, OS, Search Engine including Mobile Usage Share». statcounter.com. Retrieved 22 March 2017.
- ^ «StatCounter Global Stats — Browser, OS, Search Engine including Mobile Usage Share». statcounter.com. Retrieved 22 March 2017.
- ^ «StatCounter Global Stats — Browser, OS, Search Engine including Mobile Usage Share». statcounter.com.
- ^ «StatCounter Global Stats — Browser, OS, Search Engine including Mobile Usage Share». statcounter.com.
- ^ «StatCounter Global Stats — Browser, OS, Search Engine including Mobile Usage Share». statcounter.com.
- ^ «StatCounter Global Stats — Browser, OS, Search Engine including Mobile Usage Share». statcounter.com.
- ^ «StatCounter Global Stats — Browser, OS, Search Engine including Mobile Usage Share». statcounter.com.
- ^ «StatCounter Global Stats — Browser, OS, Search Engine including Mobile Usage Share». statcounter.com.
- ^ «StatCounter Global Stats — Browser, OS, Search Engine including Mobile Usage Share». statcounter.com.
- ^ «Mobile internet usage soars by 67%» (Press release). Retrieved 21 October 2014.
- ^ «StatCounter Global Stats — Browser, OS, Search Engine including Mobile Usage Share». statcounter.com.
- ^ «StatCounter Global Stats — Browser, OS, Search Engine including Mobile Usage Share». statcounter.com.
- ^ «StatCounter Global Stats — Browser, OS, Search Engine including Mobile Usage Share». statcounter.com.
- ^ «StatCounter Global Stats — Browser, OS, Search Engine including Mobile Usage Share». statcounter.com.
- ^ «StatCounter Global Stats — Browser, OS, Search Engine including Mobile Usage Share». statcounter.com.
- ^ «StatCounter Global Stats — Browser, OS, Search Engine including Mobile Usage Share». statcounter.com. Retrieved 22 March 2017.
- ^ «StatCounter Global Stats — Browser, OS, Search Engine including Mobile Usage Share». statcounter.com.
- ^ «StatCounter Global Stats — Browser, OS, Search Engine including Mobile Usage Share». statcounter.com. Retrieved 22 March 2017.
- ^ «StatCounter Global Stats — Browser, OS, Search Engine including Mobile Usage Share». statcounter.com. Retrieved 22 March 2017.
- ^ «StatCounter Global Stats — Browser, OS, Search Engine including Mobile Usage Share». statcounter.com. Retrieved 22 March 2017.
- ^ «StatCounter Global Stats — Browser, OS, Search Engine including Mobile Usage Share». statcounter.com. Retrieved 22 March 2017.
- ^ a b Number of Mobile-Only Internet Users Now Exceeds Desktop-Only in the U.S.. Retrieved 5 May 2015.
- ^ «StatCounter Global Stats — Browser, OS, Search Engine including Mobile Usage Share». statcounter.com. Retrieved 22 March 2017.
- ^ «Forecast: Mobile App Store Revenue to Exceed $139B in 2021». appannie.com.
- ^ «Worldwide mobile app revenues by region 2020». Statista. Retrieved 16 November 2020.
- ^ «Mail Server Survey». Security Space. August 2011.
- ^ «Usage of operating systems for websites». W3Techs. Retrieved 14 July 2022.
- ^ «Usage of Unix for websites». W3Techs. Retrieved 14 July 2022.
- ^ «Web Server Survey». Security Space. 1 March 2014.
- ^ «OS/Linux Distributions using Apache». Security Space. 1 March 2014.
- ^ «Web Technologies Statistics and Trends». W3Techs. December 2013.
- ^ «Worldwide Server Market Revenues Decline −3.7% in the Third Quarter as Weak Unix Server Demand Weights on the Market, According to IDC». International Data Corporation. Archived from the original on 8 February 2014. Retrieved 24 February 2014.
- ^ «IBM Tightens Stranglehold Over Mainframe Market; Gets Hit with Antitrust Complaint in Europe». Computer & Communications Industry Association. 2 July 2008. Archived from the original on 6 July 2010. Retrieved 27 May 2015.
- ^ a b «Vendor Rating: Novell, 2008». Gartner RAS Core Research Note G00162399. 23 December 2008. Retrieved 23 November 2009.[dead link]
- ^ a b Claybrook, Bill (1 September 2009). «Red Hat bolsters Linux for mainframes, tries to catch Novell». SearchDataCenter.com. Retrieved 23 November 2009.
- ^ Sanger, David E. (5 February 1984). «Bailing Out of the Mainframe Industry». The New York Times. p. Section 3, Page 1. ISSN 0362-4331. Retrieved 2 March 2020.
- ^ Also, Stewart (8 March 1993). «IBM still has brains to be player in client/server platforms». InfoWorld. Retrieved 26 December 2013.
- ^ Cureton, Linda (11 February 2012). The End of the Mainframe Era at NASA. NASA. Retrieved 31 January 2014.
- ^ Lohr, Steve (23 March 2008). «Why Old Technologies Are Still Kicking». The New York Times. Retrieved 25 December 2013.
- ^ Ante, Spencer E. (22 July 2010). «IBM Calculates New Mainframes Into Its Future Sales Growth». The Wall Street Journal. Retrieved 25 December 2013.
- ^ «No. 1 system from November 2000 to November 2001». top500.org. Retrieved 22 May 2019.
- ^ «Linux is Running on Almost all of the Supercomputers». TechFAE. 25 June 2017.
- ^ «Operating system Family — Systems share». Top 500 project.
- ^ «Operating System Market Share». Net Applications.
- ^ «Embedded Markets Study» (PDF). March 2019.
- ^ «Usage Statistics and Market Share of Operating Systems for Websites, September 20212020». W3Techs. Retrieved 8 September 2021.
- ^ «Usage Statistics and Market Share of Linux for Websites, September 2021». W3Techs. Retrieved 8 September 2021.
- ^ «Usage Statistics and Market Share of BSD for Websites, September 2021». W3Techs. Retrieved 8 September 2021.
- ^ «Usage Statistics and Market Share of Darwin for Websites, September 2021». W3Techs. Retrieved 8 September 2021.
- ^ «Usage Statistics and Market Share of HP-UX for Websites, September 2021». W3Techs. Retrieved 8 September 2021.
- ^ «Usage Statistics and Market Share of Solaris for Websites, September 2021». W3Techs. Retrieved 8 September 2021.
- ^ «Usage Statistics and Market Share of Minix for Websites, September 2021». W3Techs. Retrieved 8 September 2021.
- ^ «Usage Statistics and Market Share of Web Servers, September 2021». W3Techs. Retrieved 8 September 2021.
- ^ «StatCounter Global Stats: Top 8 Mobile Operating Systems on April 2020».
- ^ «Operating system Family (Linux)». www.top500.org. Retrieved 12 May 2020.
В этой статье мы опишем и обсудим самые популярные операционные системы (ОС) для различных типов устройств, таких как компьютеры, ноутбуки, мобильные телефоны и планшеты. Но прежде чем продолжить, давайте сначала определим и кратко опишем, что такое операционная система.
Что такое операционная система?
Операционная система используется всеми, кто пользуется ПК, смартфоном или планшетом. Но что такое операционная система и для чего она предназначена? Каждое вычислительное устройство оснащено аппаратными компонентами, которые выполняют различные функции — от вычисления данных до отображения сложной графики. Однако для того, чтобы использовать преимущества этих компонентов, необходимо, чтобы люди, использующие устройство, могли взаимодействовать с аппаратным обеспечением.
Операционная система выполняет функцию промежуточного звена и помогает связать аппаратные компоненты компьютера с человеком, использующим ПК, смартфон или планшет. ОС — это промежуточное программное обеспечение, которое управляет аппаратными компонентами и предоставляет пользователю возможности программного обеспечения и приложений.
Представьте себе попытку общения с другим человеком, который говорит на сложном и иностранном языке. Сотрудничество и понимание и в данном сценарии были бы практически невозможны, если бы не присутствовал переводчик, который мог бы передать информацию.
Аналогично, человек не может свободно владеть языком компьютера без дополнительной помощи третьей стороны. По этой причине операционные системы являются жизненно важным компонентом всех новейших электронных устройств и делают возможными такие вещи, как интернет-браузеры, приложения и игры. Ниже приведена информация о наиболее популярных на сегодняшний день операционных системах и их применении в различных устройствах, таких как ноутбуки, настольные компьютеры, смартфоны и планшеты.
Самые популярные ОС для компьютеров и ноутбуков

В настоящее время существует три основных игрока в области операционных систем, используемых в настольных и портативных компьютерах. Microsoft Windows, macOS и Linux делят между собой часть рынка, но имеют некоторые заметные различия.
1. Microsoft Windows 10
Компания Microsoft существует уже несколько десятилетий, впервые Windows была представлена в 1985 году. С тех пор популярность платформы резко возросла благодаря нескольким обновлениям и появлению новых и улучшенных функций. Windows 95, Windows XP и Windows 7 обычно считаются лучшими версиями ОС компании Microsoft.
Однако Windows 10 зарекомендовала себя как надежная и многофункциональная операционная система, сохранившая популярное меню «Пуск» и другие любимые пользователями функции. Благодаря новому браузеру Microsoft Edge пользователи могут пользоваться безопасным и быстрым веб-серфингом с несколькими новыми опциями.
Для тех, кто знаком с виртуальными помощниками, такими как Siri или Google Now, Microsoft представила Cortana, которая может отвечать на вопросы, помогать управлять встречами в календаре и многое другое. Среди других примечательных функций Windows 10 — виртуальный рабочий стол, который позволяет более эффективно управлять открытыми окнами в тяжелые моменты многозадачности.
С долей рынка около 75%, Windows доминирует на рынке по сравнению с macOS и Linux. Хотя большинство пользователей до сих пор работают на Windows 10, компания Microsoft активно работает над 11-й версией и сделала ее доступной для тех, кто хочет перейти на данную ОС.
2. macOS
Компания Apple впервые представила свою операционную систему на компьютере Macintosh в 1984 году. Благодаря революционной интеграции графического пользовательского интерфейса, Apple широко известна как источник вдохновения для Microsoft.
Операционные системы Apple были созданы с учетом простоты использования и предлагали удобную работу, не требующую глубоких знаний компьютера. В настоящее время операционная система Apple или macOS предлагает последнюю версию под названием Monterey. В течение нескольких лет macOS использовала названия знаковых мест Калифорнии, таких как Yosemite, Sierra, Catalina, и Big Sur.
В последней версии Monterey компания Apple обновила технологию видеочата FaceTime и внедрила технологию Universal Control, которая обеспечивает плавный переход от настольного компьютера к планшету. Среди других заметных опций — режим фокусировки, позволяющий отвлечься от работы, и новые экономящие время ярлыки, которые помогают повысить производительность.
Пользователей Apple MacOS, занимающих 15% рынка, намного меньше, чем пользователей Windows. Тем не менее, macOS по-прежнему считается наиболее простой в использовании, и именно ее предпочитают те, кто работает в творческих областях, таких как создание видео и аудио.
3. Linux
Впервые появившись около тридцати лет назад, Linux представляет собой уникальный подход к операционным системам, который предложил другой вариант, помимо Microsoft и Apple. Linux с открытым исходным кодом, бесплатная и построена по модульному принципу, который объединяет несколько различных компонентов от разных компаний. Благодаря этой модульной структуре, Linux не привязан к какой-либо одной корпорации или организации и остается бесплатным вариантом для всех желающих.
Обновления операционной системы приходят в виде Linux Distro или дистрибутива, основанного на ядре Linux. Среди наиболее заметных преимуществ Linux — неизменно высокий уровень безопасности благодаря природе открытого исходного кода, при этом антивирусные приложения на этой платформе не нужны. Конфиденциальность — еще один большой плюс Linux, поскольку, в отличие от Windows, которая регулярно собирает данные пользователей, Linux позволяет пользователям видеть все, что передается с их ПК.
В настоящее время доля Linux на рынке составляет всего 2,5%, но она постоянно обновляется, приобретая все более мощные функции.
Самые популярные ОС для смартфонов
Смартфон стал неотъемлемой частью повседневной жизни миллионов людей по всему миру, но его использование было бы невозможным без мобильной операционной системы. Эти устройства имеют специально разработанные операционные системы, которые оптимально функционируют на мобильной платформе. Android и Apple iOS являются самыми популярными и имеют сходства и различия при сравнении.
1. Android
Мобильная операционная система Android основана на Linux и имеет схожую модульную конструкцию с открытым исходным кодом. Это самая популярная мобильная ОС. Впервые представленная в 2007 году, Android была разработана группой разработчиков под названием Open Handset Alliance и получила поддержку от технологического гиганта Google.
Занимая около 72% рынка, Android является самой популярной мобильной операционной системой. Android также включает в себя приложения Google на большинстве устройств, такие как Chrome, Google Play и Google Maps, обеспечивая привычный и удобный интерфейс.
2. iOS
Для обладателей смартфонов Apple, таких как iPhone, мобильной операционной системой, встроенной в устройство, является Apple iOS. Эта операционная система доступна исключительно на продуктах Apple. Впервые выпущенная в 2007 году на первом iPhone, Apple iOS включала в себя App Store, браузер Safari, iTunes и множество полезных функций.
С 28% от общей доли рынка Apple iOS имеет преданных поклонников по всему миру. Также компания ежегодно выпускает новые устройства и крупные обновления своей операционной системы.
Самые популярные ОС для планшетов
Как и в случае со смартфонами, наиболее популярными операционными системами для планшетов являются Apple iOS и Android. Эти операционные системы функционируют на планшетах практически так же, как и на смартфонах. Однако на планшетной арене порядок популярности обратный: самой популярной является Apple iOS.
1. iOS
iPad — это планшет, разработанный компанией Apple и выпущенный в 2010 году. Сначала Apple перенесла операционную систему iPhone, но затем создала новую версию специально для iPad, которая могла использовать преимущества уникального оборудования.
iPadOS позволяет пользователям использовать стилус, физическую клавиатуру и несколько отличных инструментов для повышения производительности. С большей долей рынка в 54% Apple iOS опережает Android относительно планшетов.
2. Android
За последние несколько лет операционная система Android претерпела множество обновлений, последним из которых является Android 12. Дизайн этой операционной системы был направлен на то, чтобы сделать работу пользователя более удобной благодаря большим кнопкам, большему количеству анимации и обновленным визуальным эффектам.
Занимая 46% от общей доли рынка планшетов, Android регулярно используется во всем мире на планшетах различных производителей, таких как Samsung.
Самая популярная ОС для всех устройств
После изучения Windows, macOS, Linux, Android и Apple iOS, какая из них является самой популярной? Удивительно, но Android, основанная на Linux, является самой распространенной операционной системой, с долей мирового рынка 43% среди всех типов ОС.
Далее следует Windows — вторая по популярности, с долей рынка 30%. Операционная система Apple iOS для iPhone занимает третье место с общей долей 17%, за ней следует операционная система macOS для настольных компьютеров и ноутбуков с 6%. И, наконец, версия Linux для настольных компьютеров и ноутбуков занимает лишь 0,98% мирового рынка.
Поделиться
Решил поделиться субъективным опытом в отношении операционных систем.
Итак, проведем сравнение и определим плюсы и минусы операционных систем Windows, Mac OS, Linux.
Windows
Много с ней работаю. Очень хорошая ОС. Десятая версия стала еще стабильнее и надежнее.
Плюсы Windows:
- Стабильная и надежная. Подвисающие программы не вешают систему как раньше. Системные приложения обладают высоким приоритетом и поэтому всегда отвечают, даже если что-то пошло не так.
- Ее легко настроить, обладает хорошей поддержкой подключаемых устройств в сравнении с другими ОС. Новое устройство подключаете и система быстро обновляет драйвера с сервера Microsoft, устанавливает их без особых вопросов, сложностей. Можете не беспокоиться о совместимости с 80% устройств.
- Лучшая не приставочная платформа для игр! Игры часто выходят на PC и гораздо реже на Linux, Mac OS.
Минусы Windows:
- Платная.
- Много вирусов. Антивирус к покупке обязателен. Ставите Windows — ставите антивирус. Только когда я купил антивирус по настоящему расслабился и почувствовал себя в безопасности. Упала гора с плеч и перестал долго искать ключи на пиратских сайтах. В сравнении с другими системами — в Windows всегда существует угроза заражения.
- Захламление диска. Мне под системный диск не хватает SSD на 120 Гб. Остается свободным 2-3 Гб. Постоянно чищу кэши. Софт и игры стараюсь держать на отдельном диске.
- Пока еще кривой интерфейс в переходном состоянии от старых окон к окнам в новом дизайне. Не логичный интерфейс. В MS не стремятся к логичности и однообразию интерфейса.
- Слежка за пользователем. Система следит за пользователем и отправляет данные в Майкрософт. Это неприятно и это угроза личной безопасности.
- Постепенно вводят подписку с оплатой за обновления.
Mac OS
Mac привлекателен в первую очередь с точки зрения аппаратной составляющей. Очень хорошие дисплеи, эргономичное и качественное исполнение. В первую очередь данные устройства ориентированы на дизайнеров и осуществляющих монтаж видео.
Плюсы MacOS:
- Стабильная, красивая, лаконичная и продуманная в сравнении с Windows.
- Установка программного обеспечения упрощена до максимума — обычно достаточно перенести программу с носителя в список программ.
- Мало вирусов, а те, что есть ограничены в возможностях. Если появляется информация об уязвимостях — они быстро перекрываются исправлениями.
- Есть встроенное офисное программное обеспечение (это не актуально, т.к. все дополнительное ПО постепенно переходит в веб).
- Можно запускать некоторые приложения Windows через Wine.
- Оптимизирована под родное железо.
Минусы MacOS:
- Ограниченность системы. Т.к. в системе многое упрощено — нет гибкости в настройках.
- Проблемы с поддержкой оборудования. Не все оборудование может быть совместимо. Могут быть сложности с установкой драйверов.
- Иногда установка программного обеспечения выходит за рамки перенесения значка в список программ. Могут быть sh скрипты с запуском и работой которых могут быть проблемы.
- Для записи на диски с NTFS нужно ставить дополнительные драйвера.
- Для установки на не родное железо придется потратить много времени. Понадобится переустановка чтобы установить новую версию операционной системы.
Linux
Работа в данной системе сильно упрощается после решения Canonical реализовать SNAP. Есть возможность подключить Flatpak. Эти решения должны приблизить систему по легкости установки ПО к уровню MacOS. (суть данных решений — хранить в установщике сразу все зависимые библиотеки и файлы, что исключает проблему с разрешением зависимостей, не совпадением версий требуемых версий библиотек и версий библиотек в системе, а также реализует изоляцию ПО от системы).
Linux очень стабилен.
Gnome 3 красивее чем Mac OS!!! Когда я завершил сеанс в Mac OS и загрузился в Ubuntu — я был поражен насколько приятнее и красивее окружение в Ubuntu. В сравнении с GNOME 3 дизайн от Apple выглядит устаревшим.
Иногда систему нужно подстроить под себя 😉
Плюсы Linux:
- Бесплатная.
- Надежная. Стабильная.
- Вирусов почти нет. Антивирус не нужен. Можно поставить бесплатный ClamAV для самоуспокоения и периодического сканирования файловой системы чтобы случайно не перенести Windows вирусы на другие компьютеры.
- Система гибка в настройке, а в сети много информации как, что настраивается.
- Занимает 15 Гб на диске и не разрастается до фантастических размеров с течением времени в сравнении с Windows.
- Можно запускать некоторые Windows приложения через Wine.
- При подключении iPhone к системе можно управлять файлами без установки дополнительного ПО типа iTunes.
Минусы Linux:
- Любое изменение системных настроек несет риск сбоя. Нужно четко понимать, что делаете. Настроенное ранее может слетать после обновления ядра. Если настроенное не трогать — будет работать очень стабильно.
- Набор программ более ограничен в сравнении с конкурентами. По-умолчанию установка ПО производится преимущественно из репозиториев с ограниченным набором программ.
- Есть проблемы с совместимостью оборудования. Иногда бывают проблемы с установкой драйверов, а когда все вроде установлено бывает, что работает не корректно.
Заключение
На текущий момент мой выбор — Linux. Я перехожу на данную систему из-за существенных минусов Windows. Microsoft как и Apple топчутся на месте, делают ошибочные ходы. Linux развивается планомерно и в нем всегда есть выбор. Система простая и гибкая в эксплуатации. Советую рассмотреть данную систему в качестве альтернативного варианта 🙂
Windows от Microsoft — наиболее широко используемая компьютерная операционная система в мире, на которую в феврале 70.92 года приходилось 2021% рынка операционных систем для настольных ПК, планшетов и консолей.
Какая ОС пользуется наибольшим количеством пользователей во всем мире?
В январе 2021 года Android сохранила свои позиции ведущей мобильной операционной системы в мире, контролируя рынок мобильных ОС с долей 71.93%. Google Android и Apple iOS совместно владеют более 99% мирового рынка.
Какие 3 самые популярные операционные системы?
Тремя наиболее распространенными операционными системами для персональных компьютеров являются Microsoft Windows, macOS и Linux.
Какая операционная система чаще всего используется во всем мире на ПК и смартфонах Почему?
Windows 10 — самая популярная операционная система для настольных и портативных компьютеров. Android — самая популярная операционная система для смартфонов. iOS — самая популярная операционная система для планшетов. Варианты Linux наиболее широко используются в Интернете вещей и смарт-устройствах.
Почему Windows более популярна, чем Linux?
Таким образом, будучи эффективной ОС, дистрибутивы Linux могут быть приспособлены к ряду систем (младшего и высокого уровня). Напротив, операционная система Windows требует более высоких требований к оборудованию. … Что ж, именно по этой причине большинство серверов по всему миру предпочитают работать на Linux, а не на среде хостинга Windows.
У кого больше пользователей Iphone или Android?
Когда дело доходит до глобального рынка смартфонов, операционная система Android доминирует над конкурентами. По данным Statista, в 87 году Android занимала 2019% мирового рынка, а iOS от Apple — всего 13%. Ожидается, что в ближайшие несколько лет этот разрыв увеличится.
В какой стране больше всего используется Linux?
На глобальном уровне интерес к Linux, кажется, наиболее высок в Индии, Кубе и России, за которыми следуют Чехия и Индонезия (и Бангладеш, который имеет такой же региональный уровень интереса, как Индонезия).
Какая операционная система самая стабильная?
Самая стабильная операционная система — это ОС Linux, которая настолько безопасна и удобна в использовании. Я получаю код ошибки 0x80004005 в своих окнах 8.
Какая версия Windows 10 лучше?
Windows 10 — какая версия вам подходит?
- Windows 10 Домашняя. Скорее всего, это издание будет наиболее подходящим для вас. …
- Windows 10 Профессиональная. Windows 10 Pro предлагает все те же функции, что и домашняя версия, а также предназначена для ПК, планшетов и устройств 2-в-1. …
- Windows 10 Mobile. …
- Windows 10 Корпоративная. …
- Windows 10 Mobile Корпоративная.
Какая операционная система самая продвинутая?
Адитья Вадламани, использую Android со времен Gingerbread и в настоящее время использую Pie. Для настольных ПК и ноутбуков Windows 10 Pro Creators Update в настоящее время является наиболее технически продвинутой ОС. Для смартфонов и планшетов Android 7.1. 2 Nougat в настоящее время является наиболее технически продвинутой ОС.
Какие две самые популярные операционные системы?
Windows по-прежнему является самой используемой операционной системой в мире для настольных компьютеров и ноутбуков. С долей рынка 39.5% в марте Windows по-прежнему остается наиболее часто используемой платформой в Северной Америке. На втором месте платформа iOS с 25.7% использования в Северной Америке, за ней следует 21.2% использования Android.
Какая ОС находится в свободном доступе?
Вот пять бесплатных альтернатив Windows, которые стоит рассмотреть.
- Ubuntu. Ubuntu похожа на синие джинсы дистрибутивов Linux. …
- Распбиан ПИКСЕЛЬ. Если вы планируете возродить старую систему со скромными характеристиками, нет лучшего варианта, чем ОС PIXEL от Raspbian. …
- Линукс Минт. …
- Зорин О.С. …
- CloudReady.
15 апр. 2017 г.
Какая операционная система, упомянутая выше, самая старая или самая новая?
Ответ проверен экспертом. Самая старая известная операционная система называется GM-NAA I / O компанией General Motors в 1956 году. Первоначально она была разработана для их компьютера IBM 704. IBM — компания, известная тем, что первой на рынке разработала ОС.
Почему Linux такой непопулярный?
Основная причина, по которой Linux не пользуется популярностью на настольных компьютерах, заключается в том, что в нем нет «единственной» ОС для настольных компьютеров, как в Microsoft с Windows и Apple с macOS. Если бы в Linux была только одна операционная система, сегодня все было бы иначе. В мире Linux есть множество ОС на выбор.
Какие недостатки у Linux?
Недостатки ОС Linux:
- Нет единого способа упаковки программного обеспечения.
- Нет стандартной среды рабочего стола.
- Плохая поддержка игр.
- Программное обеспечение для настольных ПК по-прежнему встречается редко.
Нужен ли Linux антивирус?
Основная причина, по которой вам не нужен антивирус для Linux, заключается в том, что в дикой природе существует очень мало вредоносных программ для Linux. Вредоносное ПО для Windows очень распространено. … Какой бы ни была причина, вредоносные программы для Linux не распространены в Интернете, как вредоносные программы для Windows. Пользователям настольных компьютеров Linux совершенно не нужно использовать антивирус.
Каждый компьютер и мобильный девайс имеют свою операционную систему. Без нее устройство абсолютно бесполезно. ОС является главным компонентом, который управляет всеми процессами, памятью и является мостом между пользователем и компьютером. Существует несколько основных видов операционных систем для ПК и мобильных гаджетов.
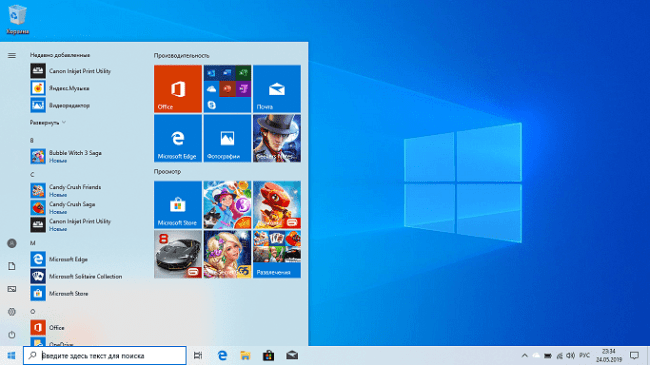
Принцип работы операционной системы
ОС представляет собой набор программ, которые управляют работой компьютера. Основные функции ОС:
- Контролирует загрузку процессора
- Управляет ресурсами оперативной памяти, карт памяти или жестким диском
- Отвечает за распределение задач и процессов
- Обновляет, устанавливает и удаляет приложения и программы
Первой популярной операционной системой стала Windows 95. Ее главная особенность состояла в графическом интерфейсе. Благодаря этому пользователь мог управлять компьютером с помощью курсора мыши. До этого нужно было использовать специальные команды, что было трудно доступным для понимания большинства людей.
На сегодняшний день есть множество разновидностей операционных систем. Далеко не все пользуются большим спросом, но лишь некоторые из них. Для ПК мы рассмотрим основные ОС: Windows, Mac OS, Linux. Среди мобильных устройств – основные ОС: Android, IOS, Windows Mobile.
Microsoft Windows
Была создана в средине 1980-х годов. На сегодняшний день – это самая популярная операционная система в мире. Процент пользователей составляет 90%. Windows устанавливается одним из трех вариантов:
- Home
- Professional
- Ultimate.
Самые успешные версии ОС Windows:
- Windows 10 (2015)
- Windows 8 (2012)
- Windows 7 (2009)
- Windows Vista (2007)
- Windows XP (2001).
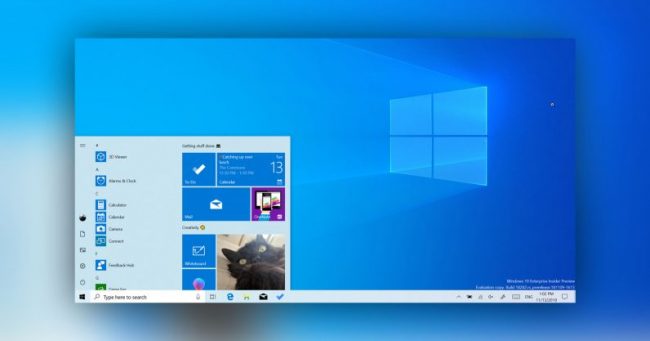
Виндовс критикуют за излишнее использование ресурсов компьютера, нестабильную работу и постоянные надоедливые обновления. Тем не менее, преимуществ данной ОС больше, чем недостатков.
Преимущества
- Надежная поддержка видео-, аудиокарт, принтеров и т.д.;
- Интуитивный интерфейс и легкодоступное освоение ОС;
- Простая установка программ и приложений;
- Огромный выбор программ, игр, антивирусов, видередакторов, фоторедакторов, текстовых редакторов;
- Удобство в использовании;
Недостатки
- Необходимость постоянных обновлений для обеспечения безопасности;
- Не самая надежная защита от вирусов, которые могут стереть все данные или прекратить работу системы;
- Долгая загрузка ОС;
Важно: секрет популярности Windows заключается в простом процессе освоении ОС самыми рядовыми пользователями всего за пару часов.
Apple Mac OS
Линейка операционных систем, которые созданы компанией Apple. Это стандартная система для компьютеров Мас. По состоянию на 2014 год процент пользователей составлял от 9 до 10%.
Важно: одна из главных причин недостатка популярности Mac OS – высокие цены на компьютеры Apple.
Последней среди всех версий была выпущена Mac OS Х. Ее предшественниками были:
- Yosemite (2014)
- Mavericks (2013)
- Mountine Lion (2012)
- Lion (2011)
- Show Leopard (2009).
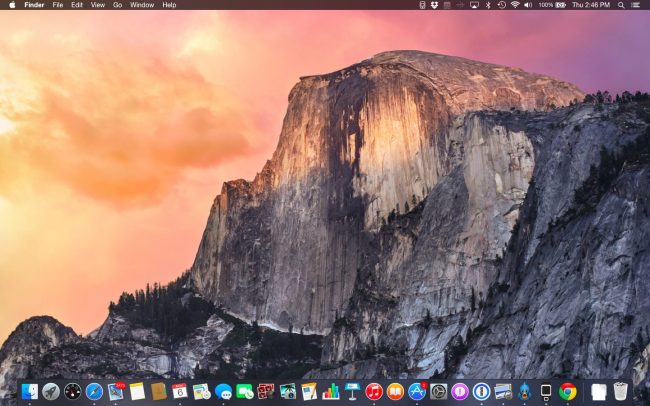
Системы Apple Mac OS имеют сходства с Linux, но отличаются в том, что Mac OS имеет закрытый исходный программный код и является платной. Как и любая другая ОС, здесь тоже есть свои положительные и отрицательные стороны:
Преимущества
- Закрытость системы увеличивает быстродействие программ;
- Эффективное взаимодействие с памятью и другими процессами
- Надежность в использовании;
- Устойчивость к вирусам;
Недостатки
- Платная основа;
- Устанавливается только на компьютеры Apple;
- Имеет узкий спектр использования (предназначена больше для работы);
- Ограниченное количество доступных игр на базе Apple Mac OS;
В отличии от Mac OS, Linux имеет открытых исходный код. Это позволяет изменять и распространять ОС по всему миру. Например, Windows может распространять исключительно компания Microsoft. Операционная система была названа в честь ее создателя Линуса Торвальдса. Основа для Linux была заложена в 1991 году. Ее основные версии:
- Ubuntu
- Mint
- Fedora.
Каждая из версий имеет свой графический дизайн. По состоянию на 2014 год статистика пользователей Linux достигает около 2%. Большинство серверов работают на Linux из-за ее гибкости и легкости в настройках. Она состоит из пакетов, а главное сердце – ядро с установленной поддержкой драйверов.
Преимущества
- Бесплатное пользование;
- Программы и игры на Windows запускаются в Linux с помощью эмулятора;
- Возможность писать собственные программы при наличии знания языков программирования;
- Бесплатное программное обеспечение;
- Высокий уровень надежности и безопасности;
Недостатки
- Ограниченное количество игр и программ с поддержкой Linux;
- Ограниченная поддержка аппаратного обеспечения;
- Низкая доступность советов в случае проблем с программами или драйверами;
- Сложность в освоении;
Важно: одним из главных факторов низкой популярности Linux заключается в сложности освоения интерфейса и принципа работы ОС для рядовых пользователей ПК.
Альтернативные операционные системы для ПК
Кроме основных ОС существует множество других вариантов установки операционки. Каждая из них имеет свои отличия и назначение.
- FreeDOS
- FreeBSD
- eComStation
- ReactOS
- Oracle Solaris
- Syllable Desktop
- Haiku
- SkyOS
- TempleOS
- ChromeOS
Важно: мы представили только список ОС, с характеристиками и особенностями каждой из них вы можете ознакомиться самостоятельно.
Стоит отметить среди представленного списка ChromeOS, которая сейчас популярна в области образования. Она бесплатна, работает на слабых компьютерах, не требует особых ресурсов и знаний для ее настройки.
Операционные системы для мобильных устройств
На рынке мобильных гаджетов также существует конкуренция между производителями ОС, и также здесь есть свои лидеры. Среди них три основных: Android, IOS, Widows.
Android
Первый Android OS под названием «Astro» компания Google выпустила в 2008 году. Через время были выпущены новые версии, после чего рост популярности данной ОС не прекращался. На сегодняшний день это самая распространенная операционная система. Google Play Market является официальным магазином приложений. Большинство программ на мобильных устройствах поддерживаются именно Android. На базе данной ОС работают практически все марки телефонов, кроме Apple.
Apple iOS
Apple iOS был введен в 2007 году с выпуском первого iPhone. До сегодняшнего дня Apple iOS работает только на продукции Apple. Система постоянно обновляется и усовершенствуется.
В отличие от Android, Apple акцентирует внимание не на оформление, а на производительность. Это доказывается надежной работой айфонов и их продолжительным временем жизни. Даже сейчас можно найти iPhone 3G, который находится в отличном функциональном состоянии.
Windows Mobile
Windows Mobile характерна, в основном, для телефонов Nokia и Microsoft. Были некоторые попытки Samsung и HTC выпустить несколько версий на базе Windows, но они оказались безуспешными. В целом ОС имеет свои положительные стороны, но ее популярность не выходит за рамки пользователей Nokia и Microsoft. Сейчас новые модели Nokia выходят с поддержкой Android.
Какую выбрать ОС?
Для того, чтобы определиться с выбором «операционки» компьютера, нужно исходить из трех параметров:
- Простота
- Изучение
- Рабочий инструмент.
Для простоты использования, приятной картинки и удобства в установке программ лучше всех подойдет Windows. Linux станет отличным инструментом для любителей изучать все процессы работы компьютера. Для работы лучше не найти ОС, чем Mac OS. Многие программисты, видеомонтажеры, специалисты по звуку используют MacBook Pro на базе Mac OS.
Со смартфонами все проще. Если у вас на руках iPhone, в выборе ОС вы ограничены. Практически все современные телефоны выпускаются на Android. Windows Mobile – самый редкий представитель среди мобильных гаджетов.
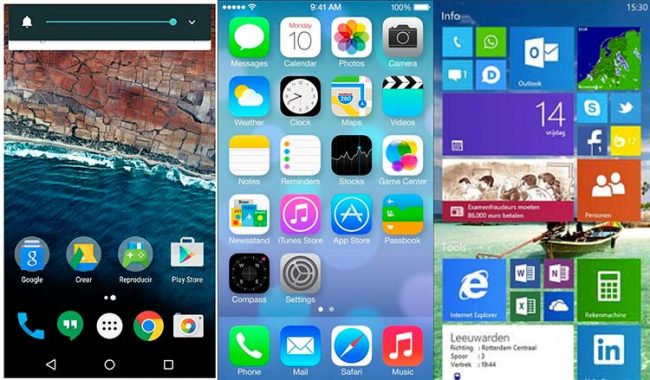
Представляем вашему вниманию подборку 10 лучших операционных систем, которые отлично подойдут как для повседневной работы, так и для поиска новых возможностей вашего ПК.
Несмотря на повсеместное использование разных версий Windows, ежегодно все больше и больше пользователей начинают искать новые интересные ОС.
Установка новой системы на компьютер позволяет работать с программами, которые не запускаются на Виндовс. Некоторые пользователи предпочитают использовать другие операционные системы для обеспечения безопасности своих данных. Также, простые и легковесные варианты ОС значительно ускоряют работу старых ноутбуков и помогают избавится от проблемы постоянного перегрева и тормозов.
10 место – Windows 10

Несмотря на то, что в данном рейтинге мы абстрагируемся от огромного количества версий всем известной Windows, нельзя не выделить одну из наиболее удачных и быстрых версий – Windows 10. Не удивляйтесь, что на 10-е место мы поставили именно Windows. Да, она самая популярная, но именно из-за этого одна из самых взламываемых и не всегда безопасных. А еще она стоит денег, если вы, конечно, не скачали ее дистрибутив с пиратских сайтов.
В использовании система очень проста и придется по вкусу как любителям метро-интерфейса, так и тем, кто привык к обычному меню «Пуск». В официальной сборке есть все необходимые программы для начала работы, в том числе и новый быстрый браузер MS Edge.
Преимущества Windows 10:
- Возвращена клавиша «ПУСК». В восьмой версии ОС разработчики сделали ставку на плиточный интерфейс, что не вызвало восторга у пользователей. Теперь владелец ПК может самостоятельно выбирать, как ему удобнее работать с начальным экраном;
- Windows 10 – это крайняя разработка Microsoft. Это означает, что все силы компании направлены именно на усовершенствование и поддержание работы ОС. Пакеты обновления для служб безопасности выходят практически каждую неделю. Хорошо Microsoft показывает себя и в быстром устранении вирусов. Владельцы компьютеров с лицензионной десяткой не раз отмечали, что им удалось избежать массового распространения вредоносного ПО благодаря быстрым обновлениям разработчика;
- Наличие голосового помощника Cortana. Со встроенной службой распознавания речи работать с поиском будет еще легче;
- Надежный Файервол. Со встроенным Защитником от Майкрософта нет необходимости устанавливать дополнительные антивирусные программы. Файервол отлично справляется с обнаружением угроз, быстро блокирует выполнение вредоносного кода, позволяет сканировать систему;
- Быстрый запуск. Операционная система запускается менее чем за 15 секунд, независимо от производительности вашего ПК;
- Настройка нескольких рабочих столов. Пользователи могу добавлять неограниченное количество начальных экранов и легко переключаться между ними с помощью горячих клавиш.
Стоит отметить, что Windows поддерживает практически любые игры и программы, поэтому проблем с установкой софта точно не возникнет.
Недостатки Windows 10:
- Слежка за пользователем. В Microsoft не скрывают, что новая Виндовс 10 способна отслеживать действия юзеров. Система регулярно сканирует ПК на использование нелегальных программных продуктов от Microsoft. Теперь взломанный MS Office будет просто удален из ПК. Не секрет и то, что ОС отправляет разработчику данные о посещаемых ресурсах и фотографии рабочего стола. При желании, все эти опции и разрешения можно отключить в настройках;
- Политика использования. Даже после продолжительного времени с момента релиза, разработчики до сих пор не определились с политикой распространения. В первый год владельцы лицензии Windows 7/8 могли бесплатно обновиться до десятки. Сегодня это стоит денег (от 8000 до 14000 рублей в зависимости от сборки). В то же время, найдена лазейка, с помощью которой можно бесплатно обновиться с помощью встроенной утилиты «Специальные возможности».
9 место – РОСА

РОСА – это российская сборка открытой ОС Linux. Стандартное ядро операционной системы полностью переписано разработчиками компании РОСА. Цель проекта – создания функциональной, бесплатной и удобной системы, которая подойдет любому русскоязычному пользователю.
РОСА ОС полностью бесплатная система. Никаких покупок внутри самой ОС тоже нет. Доступность дистрибутива поспособствовала распространению системы не только среди обычных пользователей, но и среди крупных компаний. Как известно, РОСА используется как в подразделениях Министерства обороны РФ, так и во многих частных компаниях по всей стране.
Преимущества РОСА ОС:
- Все готово для работы. После установки системы не нужно устанавливать никаких драйверов и дополнительных программ. Все необходимое уже есть в системе. При желании, вы сможете загрузить ПО с любого специализированного сайта. Как известно, на Линукс практически нулевой процент вирусных программ, поэтому никакой опасности установка из сторонних источников не несет;
- Режим тестирования. Для тех, кто еще не решился полностью перейти на РОСА ОС, разработчики предусмотрели гостевой режим. Можно создать обычную установочную флешку и загрузиться с ней. ОС не будет установлена, а юзер сможет ознакомиться с её интерфейсом и функционалом;
- Удобный интерфейс. Расположение всех элементов очень продуманное. Даже новичок справится с освоением новой системы за 10-15 минут. Все программы удобно разделены по вкладкам на рабочем столе. На панели элементов можно закреплять часто используемые программы. Начальный экран напоминает функционал Виндовс;
- Защита от вирусов. Риск загрузить вредоносное ПО минимален, поэтому можно без проблем просматривать любые сайты устанавливать программы и игры. Если в них и «вшит» вирус, то он будет работать только в Windows или других более распространённых ОС.
Среди недостатков РОСА ОС можно выделить небольшое количество программ. Не все ПО Виндовс имеет аналоги для ядра Линукс.
8 место – FreeBSD

FreeBSD – это операционная система, которая заточена для работы с серверами, а теперь и обычными десктопными ПК. С момента начала первых разработок этой системы прошло уже более 30-ти лет. Сегодня FreeBSD – это простая, надежная и удобная ОС, которая станет хорошей заменой привычному Виндовс.
Преимущества FreeBSD:
- Свободная лицензия и выгрузка из сети;
- Открытый исходных код позволяет модифицировать систему;
- Распространение. FreeBSD используется многими популярными в мире сайтами для поддержания серверной части – Webmoney, Aliexpress, ASOS и другие;
- Защита и надежность. Стоит отметить хорошо продуманную логику ОС, рациональное потребление ресурсов ПК. FreeBSD быстро работает даже на малопроизводительных компьютерах;
- Большой выбор софта. В разработке версий программ для FreeBSD занимаются более 4 тысяч разработчиков со всего мира. Благодаря этому, актуальные версии всех популярных программ быстро появляются в свободном доступе.
Недостатки FreeBSD:
- Сложность настройки. Именно это и является главной причиной небольшой популярности FreeBSD среди обычных пользователей. Разобравшись с первой настройкой ОС, вы получите систему, которая работает гораздо быстрее Windows;
- Трудность получения документации. Если вы хотите настроить администрирование своего сайта на FreeBSD, необходимо потратить время на поиск документации по управлению.
Для обеспечения безопасности в FreeBSD используются все необходимые уровни защиты: механизмы шифрования, контроль аутентификации, проверка входящего и исходящего трафика, регулярный мониторинг системы на наличие вредоносного кода.
Читайте обзор «Какой дистрибутив операционной системы на без Linux скачать и установить«
7 место – Fedora

Fedora – это Linux-подобная операционная система, особенностью которой является работа со свободным программным обеспечением. Следует отметить, что используемые драйвера могут иметь закрытый исходный код, а некоторые виды ПО могут иметь ограниченную лицензию (к примеру, кодеки для воспроизведения медиа).
Преимущества Fedora:
- Использование среды Gnome. Разработка Gnome для Fedora считается одной из самых удачных реализаций рабочего стола в операционных системах;
- Проста в использовании. Разработчики создали простой и красивый дизайн для рабочего стола, вкладок программ. Быстрое перемещение между открытыми приложениями и папкам возможно благодаря боковой панели инструментов;
- Предустановленные программы. После установки вам будет доступен пакет ПО для полноценного начала работы с Fedora (веб-браузер, проводник, утилита для просмотра изображений, софт для управления виртуальными машинами и прочие);
- Быстрая установка новых приложений. Инсталляция ПО происходит через «Центр приложений», точно так же, как и на обычном смартфоне;
- Возможность обновления «по воздуху». Вы можете скачивать и устанавливать новые прошивки ОС с помощью утилиты Gnome Software.
Недостатки Fedora:
- Среди разработчиков Fedora считается «свободным полигоном» для тестирования программ. Все приложения появляются быстрее, но есть большой шанс того, что ПО будет недоработанным и нестабильным.
6 место – Elementary OS

Elementary OS – это быстрая и в то же время функциональная замена привычному Windows. Разработчики позиционируют систему как простую среду для работы, что логично следует из названия ОС.
В системе используется ядро дистрибутива Linux. Elementary OS распространяется на бесплатной основе и работает абсолютно на всех компьютерах, независимо от аппаратных компонентов.
Преимущества Elementary OS:
- Удобный и приятный интерфейс. Стиль минимализма – основа функционала операционной системы. На рабочий стол добавлено минимум элементов, но все они позволяют без проблем управлять ОС. Следует отметить плавность переключения окон и очень быструю загрузку программ;
- Простота в освоении. С Elementary OS разберется даже начинающий пользователь. Никаких сложных команд, принудительной работы с консолью и непонятных параметров. Функционал можно сравнить с простотой использования мобильной ОС Андроид – все базовые настройки можно отрегулировать в окне инструментов рабочего стола.;
- Отличный набор стандартных программ. Как правило, пользователи несерьезно относятся к предустановленным в ОС приложениям. В случае с Elementary OS, разработчики постарались создать полезный базовый пакет ПО, который не захочется удалить;
- Регулярный поток новых программ. Разработчики быстро адаптируют программы под Elementary OS.
В целом, система отлично подходит для домашнего использования. Для администрирования сервером или создания рабочей станции такая ОС все же не подойдет. Безопасность Elementary OS обеспечивают встроенные модули защиты от Линукс.
Если у вас слабый компьютер или вы хотите поставить дополнительную «легкую» ОС, смело выбирайте Elementary OS.
5 место – Chrome OS

Chrome OS – это операционная система от Google с открытыми исходниками. Основная особенность системы – использование гибридного ядра (ядро Линукс в комплексе с со службами Google).
ОС распространяется совершенно бесплатно, а её популярность среди пользователей обусловлена быстрой работой и приятным дизайном.
Преимущества Chrome OS:
- В системе доминируют веб-приложения, а ключевая роль в управлении системой отводится браузеру Chrome. Именно с его помощью загружаются и работают веб-приложения;
- Нет особых требований к аппаратной архитектуре. Благодаря простому концепту Chrome OS, для установки системы не требуется иметь производительный ПК или ноутбук. Наоборот, система была специально разработана для малопроизводительных машин (нетбуки, ноутбуки низкой ценовой категории). Использование веб-сервисов позволяет уменьшить нагрузку на жесткий диск и оперативную память;
- Безопасность в автоматическом режиме. Загрузка пакетов с обновлениями модуля защиты происходит регулярно. Также, в системе присутствует встроенный защитник для быстрого выявления угроз;
- Простота в использовании;
- Доступность софта. Скачивать все программы можно с Google Play или сервиса Android Nougat. Изобилие ПО в этих онлайн-магазинах не дадут пользователю испытать нехватку приложений. К тому же, все ПО отлично адаптировано для десктопной операционной системы.
На первый взгляд, интерфейс Chrome OS напоминает объединение Android и Windows. Установленные программы вынесены в отдельное меню, а управление системой осуществляется с помощью панели инструментов, как в рабочем столе Windows.
Среди недостатков Chrome OS можно выделить необходимость в постоянном подключении к сети интернет. Желательно использовать Wi-Fi сеть или подключение к Ethernet. В противном случае, вы не сможете работать с веб-сервисами.
4 место – OpenSuse

OpenSuse – это еще один популярный дистрибутив, который работает на ядре Linux. Используется как для поддержки серверов, так и для домашних компьютеров. Новые прошивки системы выходят регулярно, в асе даты релизов можно посмотреть на сайте разработчика.
Пользователь OpenSuse может самостоятельно кастомизировать систему. Для этого не нужно иметь навыки программирования. Изменение интерфейса заключается в выборе понравившегося окружение рабочего стола. В то время как большинство сборок Linux могут работать только с одним окружением рабочего стола, OpenSuse поддерживает сразу несколько утилит оформления. Наиболее популярные из них – KDE и XFCE.
Преимущества OpenSuse:
- Простая настройка. Управлять операционной системой можно с помощью одного приложения YaST. Этот инструмент позволяет отрегулировать параметры работы OpenSuse. Пользователи могут самостоятельно добавлять репозитории, управлять параметрами загрузки, разделами ОС, настройками подключения к сети и прочими параметрами;
- Свободное распространение софта. В OpenSuse будут работать все нужные вам программы. Система автоматически адаптирует ПО для вашего компьютера;
- Простая установка программ. В отличии от большинства сборок Линукс, вам больше не нужно самостоятельно устанавливать репозитории, добавлять ключи доступа и проводить сложные настройки. Достаточно скачать нужную программы с официального источника https://software.opensuse.org/ и выполнить установку в один клик.
Недостатки OpenSuse:
- В стандартной сборке отсутствуют кодеки и драйверное ПО, что усложняет первую настройку ОС;
- Пользователи отмечают нестабильную работу стандартного торрент-клиента MonSoon.
3 место – Ubuntu

Ubuntu – это универсальная операционная система, которая работает на движке Debian GNU/Linux. Система отлично работает на серверах, персональных компьютерах и ноутбуках. Стандартная сборка поставляется с окружением рабочего стола под управлением Unity.
Преимущества Ubuntu:
- Работа с оборудованием. Ubuntu поддерживает огромное количество типов подключенных устройств. К примеру, любое подключенное по USB устройство заработает без каких-либо проблем и драйверного ПО;
- Поддержка пользователей. ОС Ubuntu отличается самым большим и отзывчивым сообществом. При необходимости, новички смогут получить ответы на все вопросы с помощью официального сайта разработчика;
- Надежность. В ОС есть встроенные утилиты для резервного копирования данных. Система самостоятельно создает копии важных файлов, архивирует их и отправляет в облако. Таким образом, обеспечивается надежность Ubuntu. Если вы администрируете сервер на этой ОС, лучшего способа для быстрого отката данных не найти;
- Система безопасности. Разработчики предусмотрели целую систему приложений, которые в фоновом режиме отслеживают уязвимые стороны. Ubuntu считается самым сильным дистрибутивом Linux в плане безопасности;
- Центр программ. Специальная утилита для поиска и установки программ также позволяет новичку ознакомиться с основами инсталляции ПО под Линукс. На странице каждого приложения есть детальное описание софта, его требования и отзывы от других пользователей.
Распространяется Ubuntu на бесплатной основе. Что касается недостатков системы, можно выделить отсутствие простых средств миграции из ОС Виндоус. Также, в Ubuntu отсутствуют эффективные утилиты для родительского контроля, поэтому устанавливать дистрибутив для семейного использования не рекомендуется.
2 место – MacOS

MacOS – это семейство операционных систем от корпорации Apple. На данный момент, самая актуальная сборка – Mac OS Sierra. В отличии от описанных выше ОС, Mac работает не на основе Unix-подобных систем, а с помощью нативного движка от Apple.
Дистрибутив системы распространяется бесплатно.
Преимущества MacOS:
- Юзабилити и графическая оболочка. Данная ОС признана лучшей системой для пользователей. Все опции и настройки ориентированы на быстрое освоение. Интерфейс многоязычный, интуитивно-понятный и удобный;
- Высокая степень защиты. Mac OS является наиболее безопасной среди всех современных ОС. Количество вирусов практически нулевое, а со всеми «вредителями» справится встроенный антивирус;
- Простота в установке и удалении программ. Достаточно просто переместить ярлык в корзину для полного удаления приложения. Mac OS делает все за пользователя. Вам нет необходимости вручную очищать жесткий диск, как в Виндовс или Линукс;
- Стабильная работа. Благодаря высокой совместимости компонентов, пользователи не сталкиваются с багами, зависаниями или сбоями в работе ОС.
Недостатки MacOS:
- Совместимость. Если вы владелец обычного ПК, а не компьютера Macintosh, установить операционную систему можно лишь в том случае, если она совместима с аппаратными компонентами. MacOS работает на ограниченном количестве процессоров (в основном это Intel Core и Xeon);
- Меньшее количество программ, чем в том же Windows.
1 место – Linux Mint

Linux Mint признана лучшей сборкой для установки на пользовательские ПК. Она удовлетворяет все требования среднестатистического юзера – распространяется на бесплатной основе, совместима с любым железом, рационально потребляет ресурсы ПК и имеет удобный интерфейс.
Преимущества Linux Mint:
- Быстрое включение. Загрузка системы происходит за 10-12 секунд, что существенно быстрее чем Mac OS и большинство систем семейства Windows;
- Поддержка работы с несколькими рабочими столами;
- Встроенная утилита для быстрой установки и удаления программ. В этой версии Линукс пользователям не придется разбираться с репозиториями. Все сделано для удобной работы с ПО;
- Мультиязычный интерфейс;
- Быстрая отладка системы. Если вы столкнулись с зависанием программ, можно отключить процесс нажатием одной клавиши;
- Поддерживается всеми десктопными ПК и ноутбуками.
- Удобный интерфейс.
Недостатки Linux Mint:
- Ограниченное количество софта для специфических задач (монтаж видео, работа с графикой и прочее);
- Отсутствие стабильного графического драйвера для AMD, из-за чего некоторые игры могут работать некорректно.
Итог
Выбирая операционную систему, в первую очередь обращайте внимание на задачи, которые ставите перед программной средой. Нужна быстрая и безопасная ОС для повседневного использования? Обратите внимание на Unix-подобные системы.
Если вы хотите получить надежную ОС с отличной графической оболочкой, рекомендуем выбрать Mac OS. Для любителей интерфейса и функционала мобильных систем следует начать использовать Chrome OS.
Надеемся, что данный рейтинг помог вам определиться с тем, какую операционную систему лучше использовать. С какими ОС приходилось работать вам? Есть ли еще варианты, которые вы могли бы порекомендовать другим пользователям?