When something is not working correctly on your Windows 10 PC, the Task Manager is a tool that can provide valuable information about your system performance.
Although the Processes tab helps you troubleshoot applications and services running on your computer, you can use the Performance tab to get a real-time information of the performance on your computer, including CPU and memory usage, as well as hard drive, network, and Bluetooth information.
The ability to monitor your computer’s performance in real-time can not only help you understand how resources are being utilized, but it’s also useful information when trying to figure out the reason your device is not achieving expected network and hard drive speeds, among other issues.
In this Windows 10 guide, we’ll walk you through the steps to use Task Manager to monitor the performance of your computer.
How to monitor your PC real-time performance
Opening Task Manager
On Windows 10, you can use Task Manager for an array of tasks, including to view real-time data on your computer’s performance, but first, you need to know how to open the tool. Below are a few ways to open Task Manager:
- Right-click the Taskbar and click on Task Manager.
- Open Start, do a search for Task Manager and click the result.
- Use the Ctrl + Shift + Esc keyboard shortcut.
- Use the Ctrl + Alt + Del keyboard shortcut and click on Task Manager.
- Use the Windows key + X keyboard shortcut to open the power-user menu and click on Task Manager.
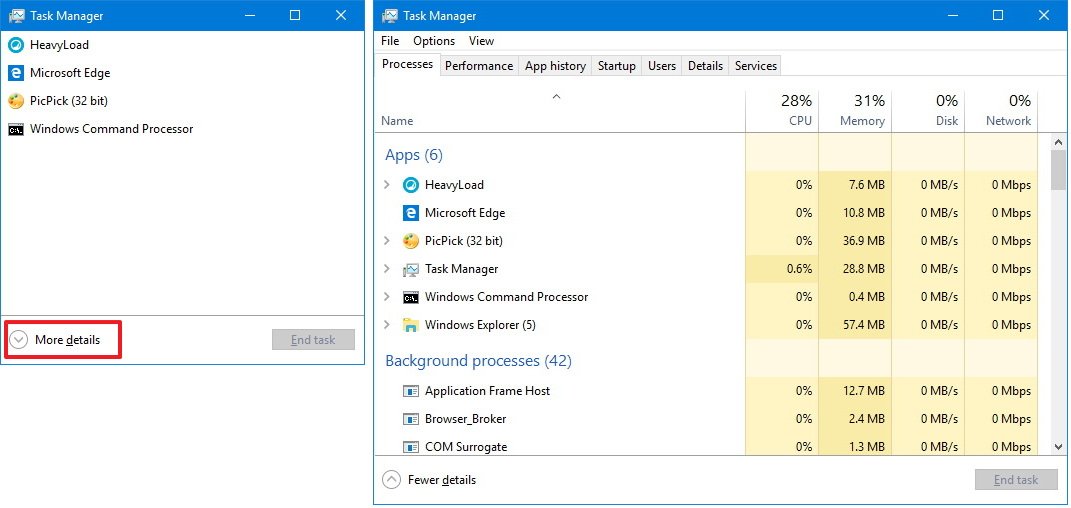
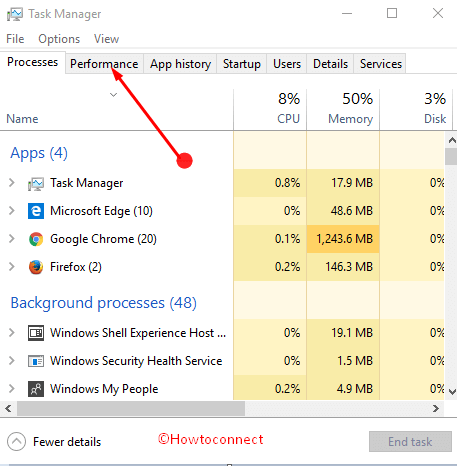
If you never open this tool before, you’re likely to see Task Manager in compact mode. To get to Performance, you need to click the More details button, and then click on the Performance tab.
How to monitor system performance
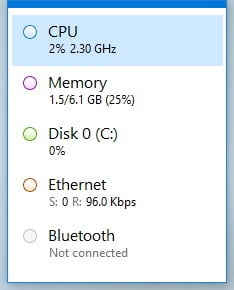
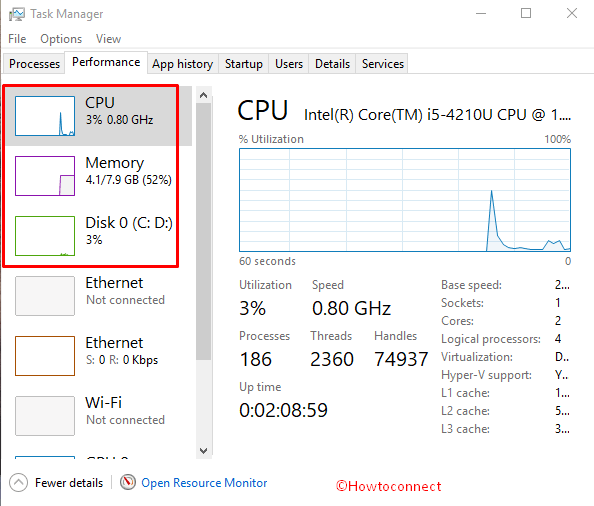
In the Performance tab, you can monitor four main components, including processor, memory, hard drive, network (and Bluetooth).
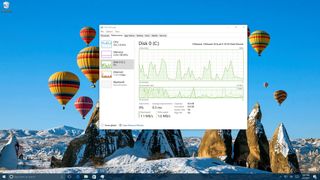
On the left pane by default, you’ll see all the components with small graphs displaying their current activity in percentage for CPU, Memory, and Disk, and Kilobits per second for network adapters and Bluetooth devices providing visuals to quickly identify any spikes on resources.
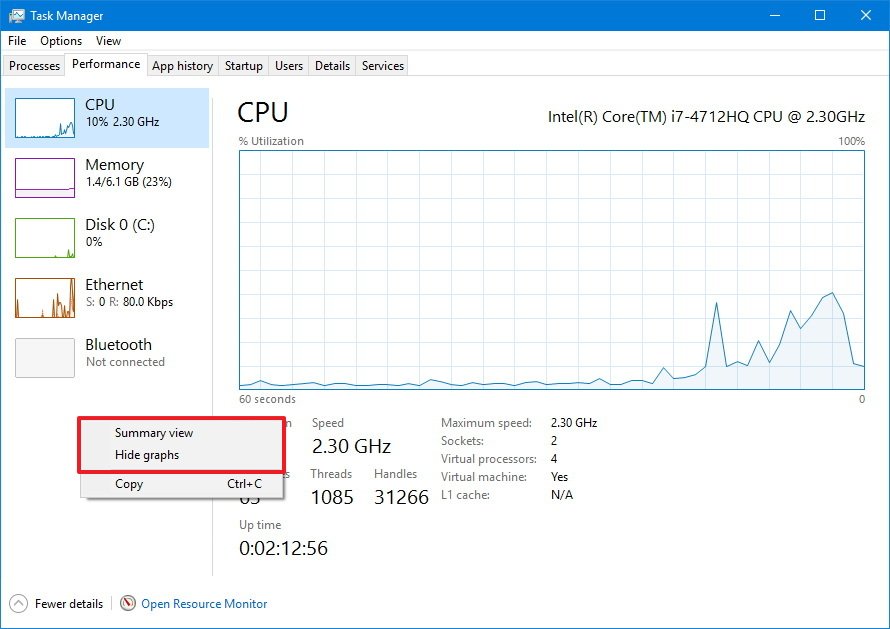
You can always right-click below the components to access the context menu to change the view and hide the graphs or only to show a summary, which can come in handy if you want to keep Task Manager open at all times.
Also, in any section, you can double-click or right-click a graph and select Graph summary view to see only a compact graph with the component activity information.
Quick Tip: If you need to document any information, instead of taking a screenshot, you can right-click anywhere in a section and click Copy from the context menu. Then simply paste the information in a text file for later use.
Here’s the breakdown of each section in the Performance tab:
CPU
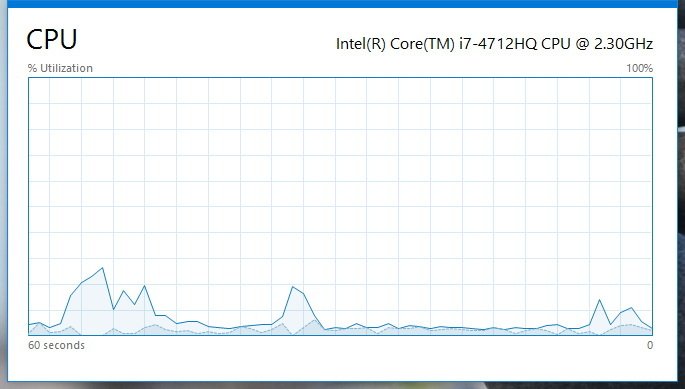
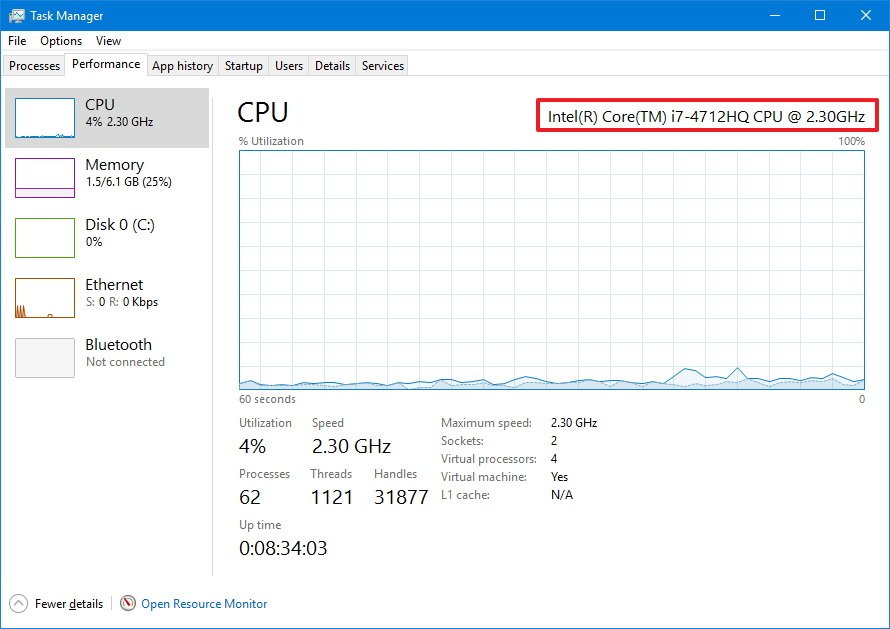
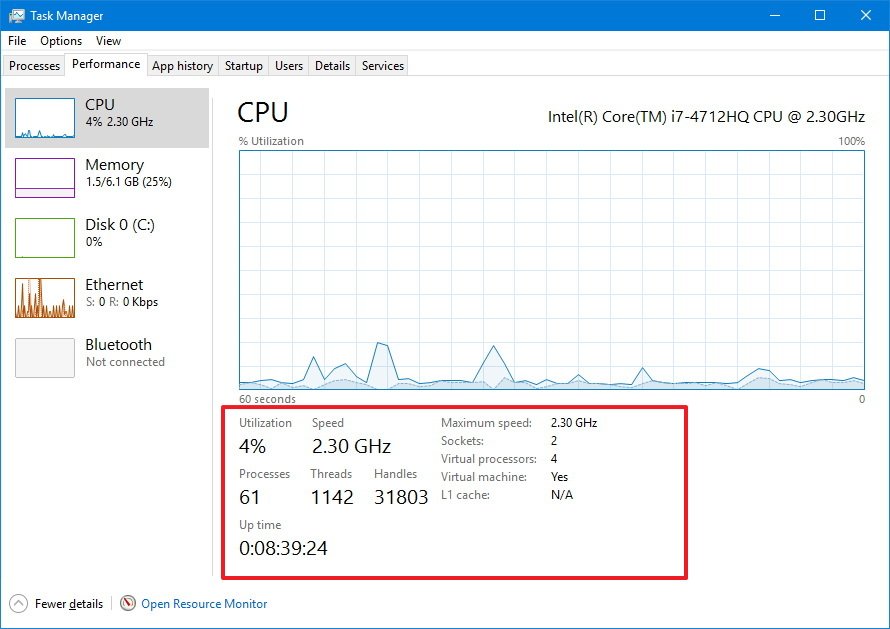
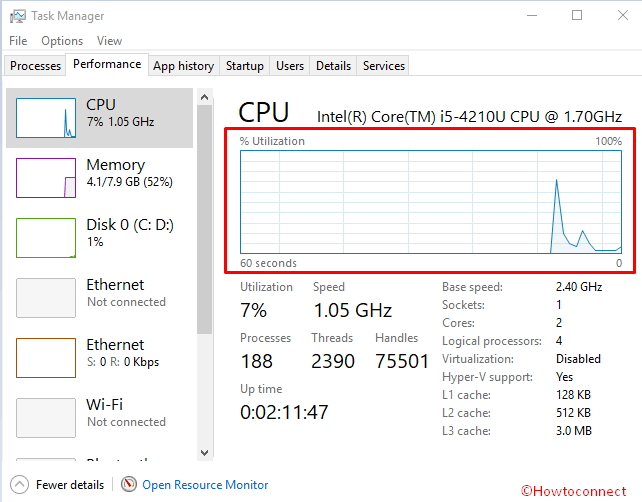
The CPU section provides details about the processor and resource utilization. In the top-right corner you’ll see exactly which processor your computer is using and the clock speed it was designed to run.
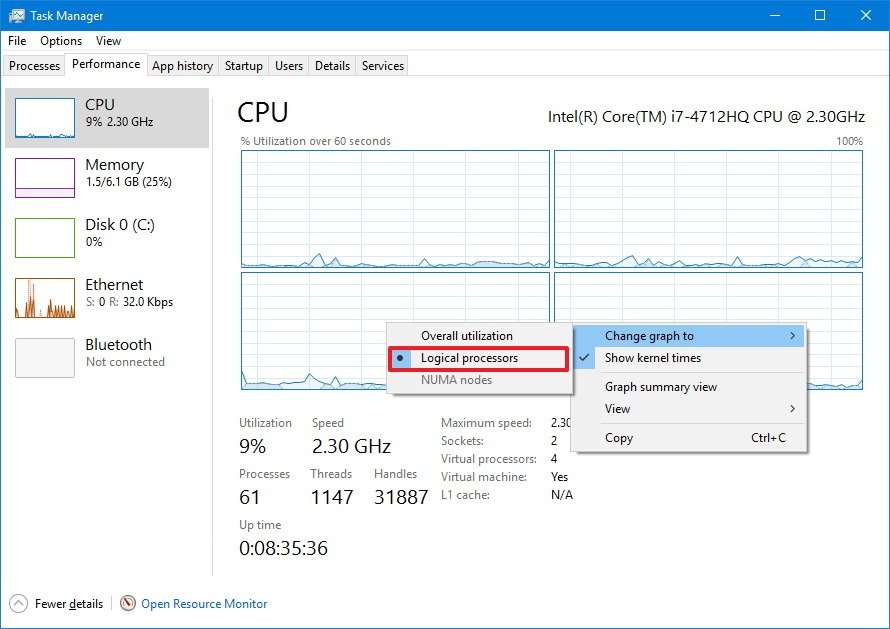
The graph shows the overall utilization of the processor over a 60 second period. In addition, you can right-click anywhere inside the section, select Change graph to, and click Logical processors to view a graph for each core of your processor.
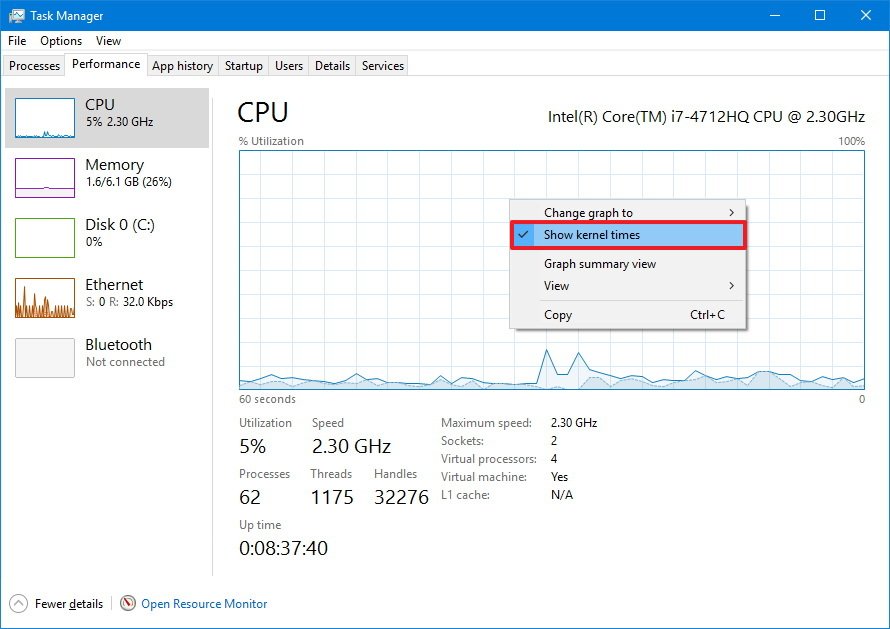
The context menu also offers an option to show kernel times, which you would typically use to troubleshoot devices with poorly written drivers or failing hardware that is causing too many interruptions.
At the bottom, you’ll see more details about the processor resources, including percentage utilization, processes, threads, handles, and your computer up time.
On the right, you can see the processor specifications, such as speed, the number of cores (virtual processors), if it’s capable to run virtual machines, and cached memory information if applicable.
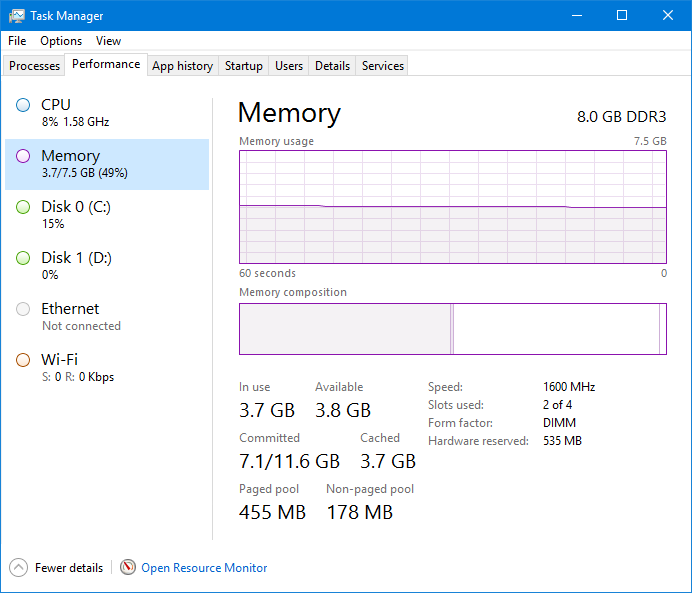
Memory
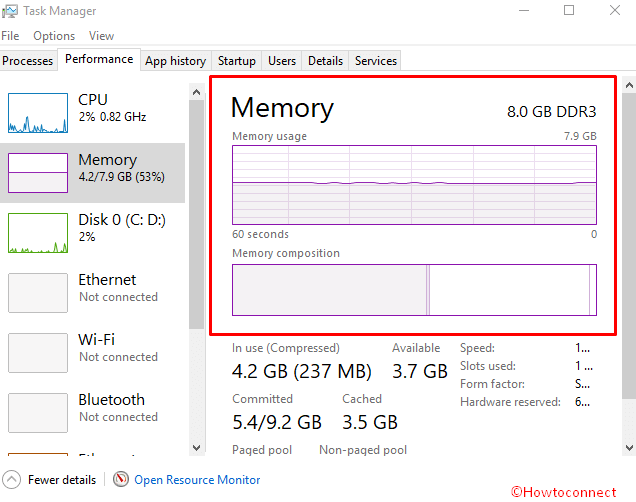
Memory offers a view of the RAM usage by the system and applications. In the top-right corner, you’ll see total amount and type (e.g. DDR3) of memory installed on your device.
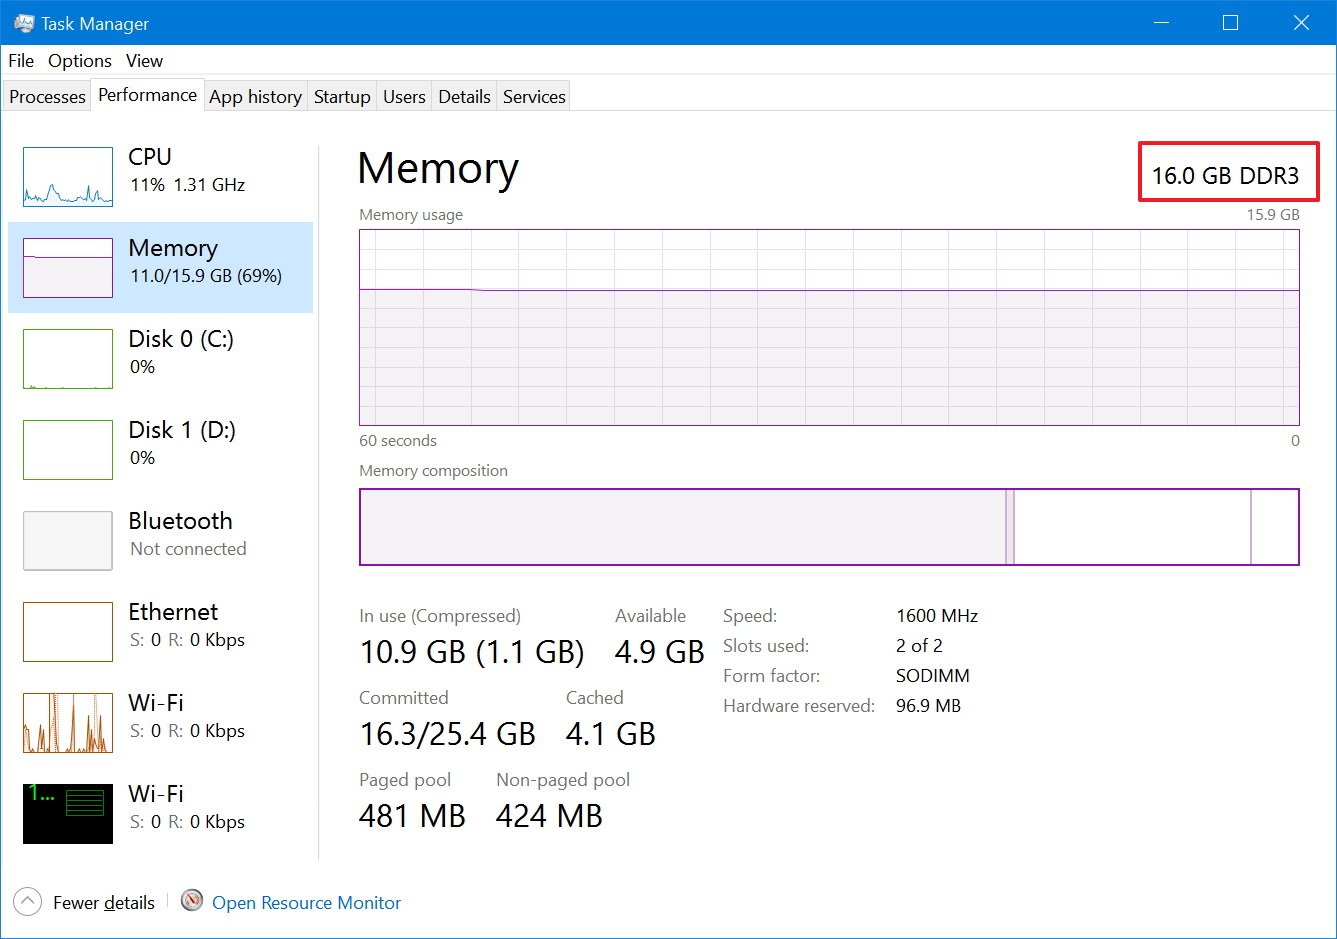
In this section, you’ll notice that there are two graphs. The first one on the top shows total memory usage over a 60 second period, and the graph below shows the amount of memory is currently allocated.
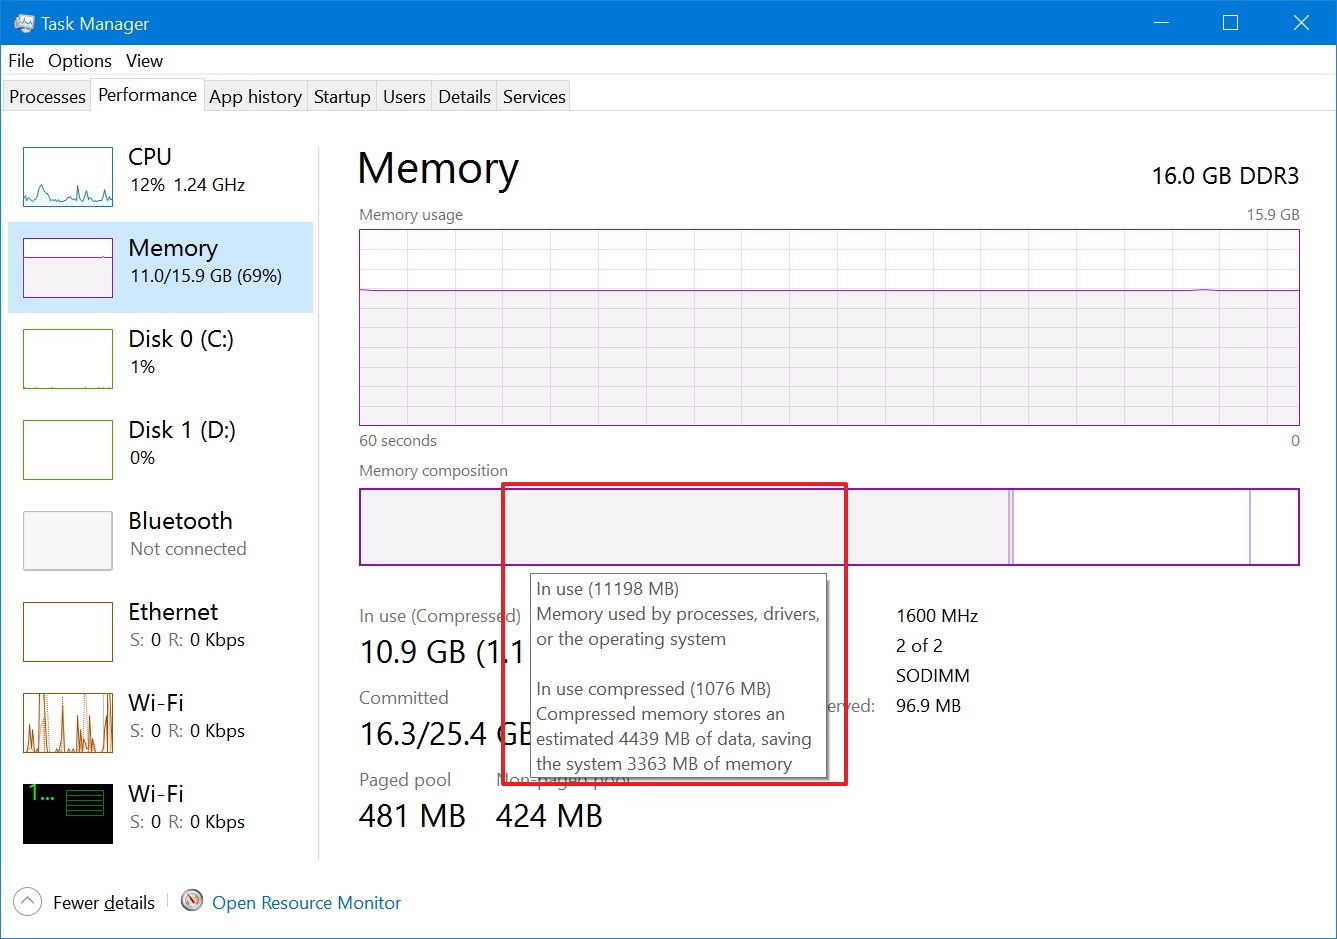
The memory composition has four parts:
- In use (Compressed): Amount of RAM currently being used by applications, drivers, or the operating system.
- Modified: Memory content that has to be saved to the hard drive before it can be used for something else.
- Standby: Amount of memory that contains cached data and code not being used by the system.
- Free: Shows memory currently not in use.
You can always see these details by hovering with the mouse over each section of the graph.
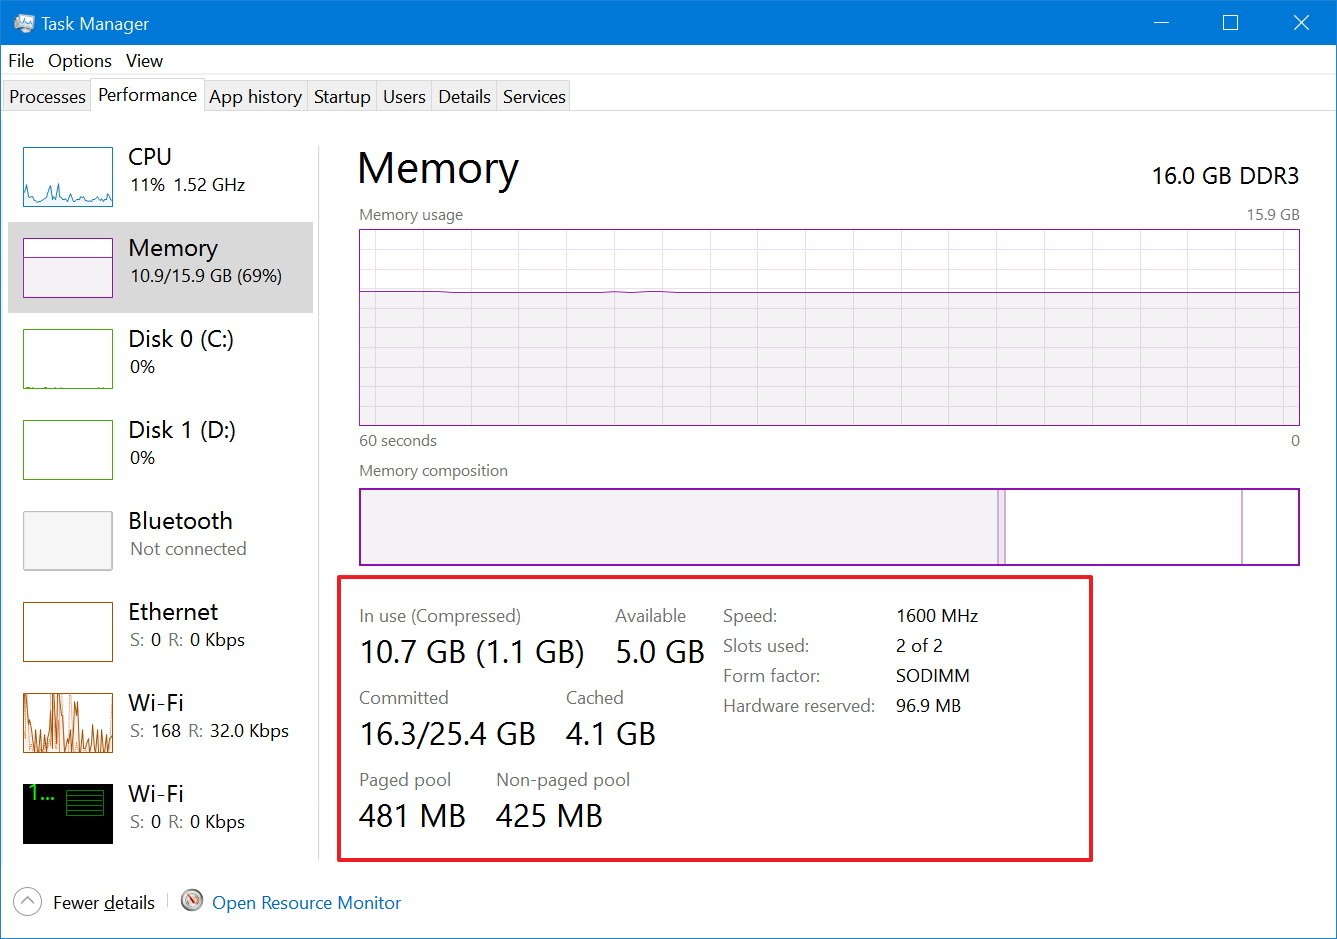
At the bottom, you’ll also find detailed information about your computer’s memory usage, including «In use (Compressed),» «Committed,» «Cached,» «paged pool» and «non-paged pool» memory.
On the right, you can also see memory specifications, such as speed (e.g. 1600MHz), slots available, memory form factor (e.g. SODIMM), and memory reserved for hardware on the right side. The details provided on this page not only give you an overview of memory usage in real-time, but you can use this information at the time you need to upgrade your system.
For example, the «Slots used,» tells you whether or not your computer have slots available to add more memory. «Speed,» «Form Factor,» and memory type are important information at the time to purchase the correct memory sticks to upgrade your computer.
Disk
The Disk section provides important information about hard drive usage. Task Manager doesn’t group multiple hard drives into a single view, which means that you’ll get a Disk section for each hard drive installed on your computer.
On the top-right corner, you’ll see exactly the hard drive your computer is using, the interface type (e.g. mSATA), and capacity in Gigabytes.
This section includes two graphs. The first graph from the top shows you the hard drive activity over a 60 second period. The second graph shows you the transfer speeds in Kilobytes per second over a 60 second period.
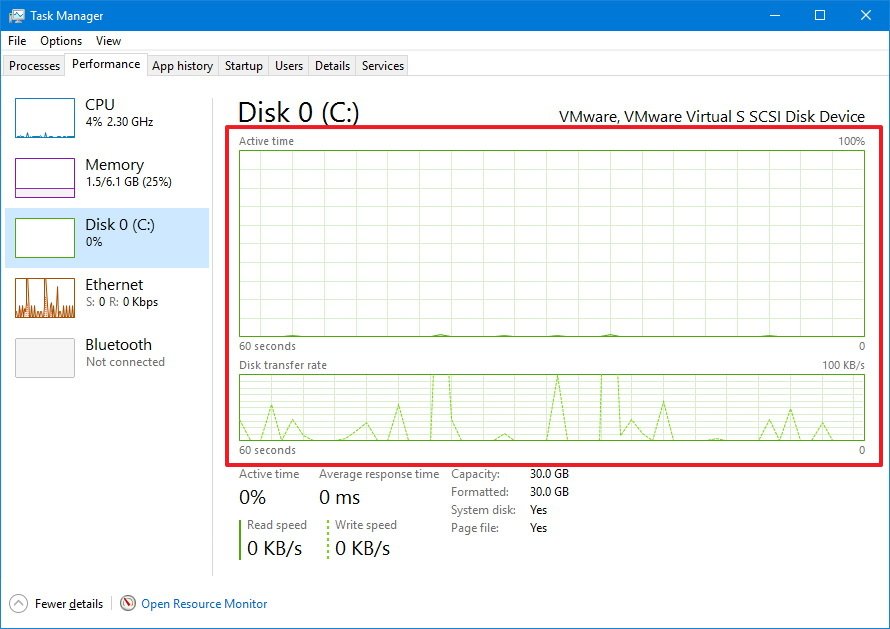
At the bottom of the section, you’ll also find detailed information, including the percentage of drive active time, the average speed that it takes the hard drive to respond to a request, and read and writes speeds.
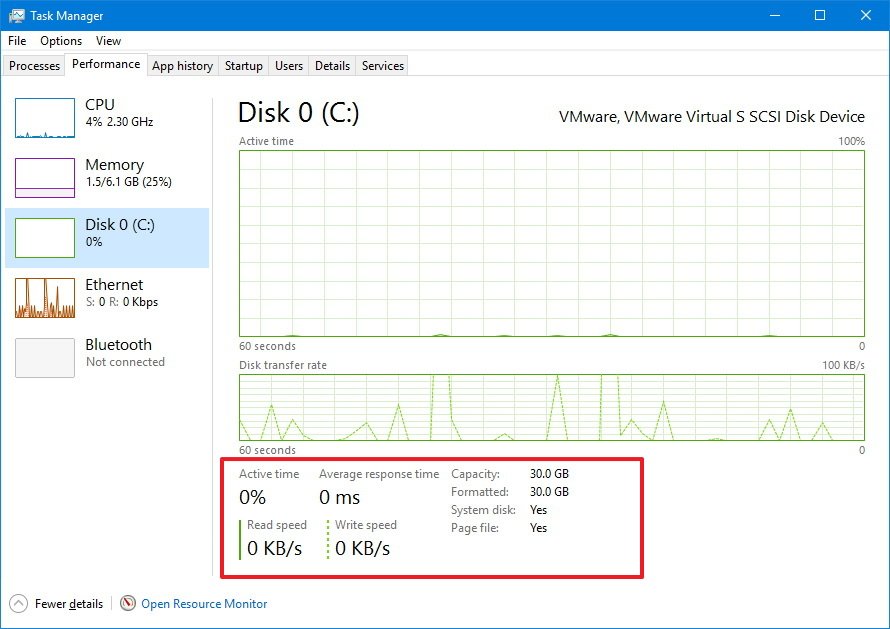
Additionally, you get information on actual usable capacity after the drive is formatted, and «System disk» display whether the drive is where Windows 10 is installed, or if it’s a secondary drive.
Ethernet/Wi-Fi
Task Manager doesn’t group multiple network adapters into a single view, which means that you’ll get a section for each Ethernet or Wi-Fi adapter installed on your computer. Even virtual network adapters will list separately.
When you select a network adapter, you’ll notice the name of your Wi-Fi or Ethernet adapter in the top-right corner.
There is only one graph in this section that shows you the throughput of the adapter over a 60 second period.
Below the main graph, you also get information about data sent and received in Kilobits per second. Additional details include adapter name, connection type, and your current IPv4 and IPv6 addresses.
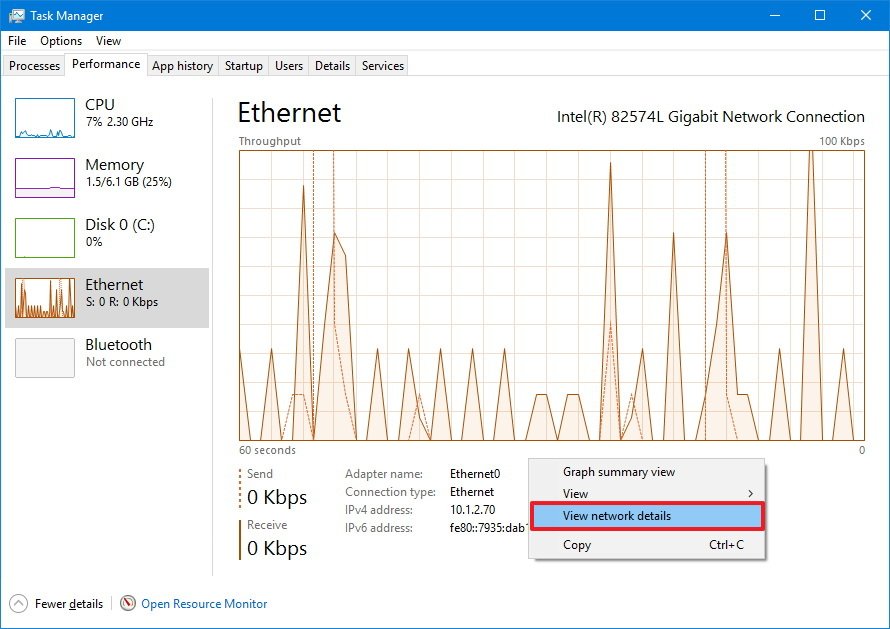
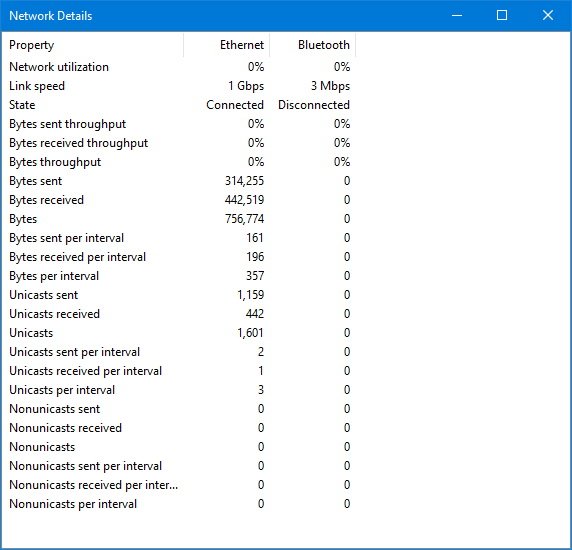
Advanced users can also right-click the graph and select «View network details» to see more network details that can help troubleshoot network problems, such as link speed, state, bytes generated, sent and received, along with unicast packets information.
Bluetooth
In the Performance tab, you’ll also notice that there is a Bluetooth section, which is probably showing as «Not connected,» even though you have connected a Bluetooth device to your computer. The reason is that this is actually a network adapter, and it’s not meant for peripherals like speakers, keyboard, and mouse.
You will see additional information in the Bluetooth section when you connect your phone or another device, and you begin transferring data.
Wrapping things up
As you can see the Performance tab provides great information on how your computer’s hardware is performing with easy to understand graphs and important system and hardware details. This information can be very useful not only to understand how resources are being utilized but to troubleshoot many problems as well.
More Windows 10 resources
For more help articles, coverage, and answers on Windows 10, you can visit the following resources:
- Windows 10 on Windows Central – All you need to know
- Windows 10 help, tips, and tricks
- Windows 10 forums on Windows Central
Get the best of Windows Central in in your inbox, every day!
Mauro Huculak is technical writer for WindowsCentral.com. His primary focus is to write comprehensive how-tos to help users get the most out of Windows 10 and its many related technologies. He has an IT background with professional certifications from Microsoft, Cisco, and CompTIA, and he’s a recognized member of the Microsoft MVP community.
Работа с файлами и папками
Работа с файлами и папками (folders) – хранилищами ссылок на файлы и другие папки –
осуществляется с помощью программы Windows Explorer. На
рис.
36.4
показано окно программы Windows Explorer, визуалилизующее информацию о дисках и основных
папках компьютера. Если дважды подряд кликнуть на диске C:, то визуализируется содержимое
его корневой папки, которая может содержать другие папки, и т.д. Навигация по папкам осуществляется с
помощью стрелок <- и -> .
Выбор файла или папки в директории выполняется одним кликом мышки, вход в директорию или открытие файла – двойным кликом мышки на имени директории или файла. При этом для файла выполняется действие его открытия, зависящее от его типа, — для текстовых файлов – вызов соответствующего редактора (notepad, WordPad, MS Word и др.), для файлов .pdf – вызов Adobe Acrobat, для исполняемых кодов или командных файлов – запуск соответствующей программы или скрипта и т.д. Поэкспериментируйте на своем компьютере с навигацией по файлам и папкам и открытием файлов с документами.
Запуск программ, управление задачами, программами и процессами
Есть несколько способов запустить программу:
- из Windows Explorer – дважды кликнуть на имени ее файла;
- из меню Start – выбрать пункт Search programs and files. Это – одно из самых удобных нововведений в пользолвательском интерфейсе системы Windows 7. При поиске, по мере набора имени программы, выводятся списки программ и файлов с таким именем (префиксом имени), что позволяет очень комфортно выбирать программу для запуска. Выбрав имя редактора notepad. получите
окно для его запуска кликом мышки на имени программы (
рис.
36.6):
Запуск программы из командной строки (Command Prompt): выберите Start / Search Programs and Files / cmd. После
запуска командного процессора визуализируется его окно (
рис.
36.7):
В окне командной строки наберите имя программы (например, notepad) и нажмите Enter.
Для управления Вашими задачами используйте программу Windows Task Manager, которую запустите, нажав одновременно клавиши Ctrl / Alt / Del. В результате система сначала переспросит Вас, что именно Вы хотите сделать.
Подтвердите запуск диспетчера задач. При этом визуализируется окно (
рис.
36.8) :
Вкладка Applications содержит информацию о вызванных Вами программах. В случае, например, зависания какой-либо программы, выберите ее и нажмите «End Task», в результате чего программа будет удалена из системы. Вкладка Processes визуализирует информацию обо всех
процессах, запущенных в системе. Вкладка Performance (показана на
рис.
36.8) визуализирует информацию об использовании процессора и памяти, которая может оказаться Вам полезна в случае каких-либо незапланированных задержек в работе компьютера. Поэкспериментируйте с вкладками программы Windows Task Manager.
When your PC performance is not upto mark you need to find out the real cause that affects its resources normal behavior. Windows is a tool rich OS as multiple built-in tools continuously monitor CPU, Memory, Disk, and Network of a computer. So when you analyze resource values, Task Manager helps you out with the correct data of usage in numeral and graphical view.
You can analyze resources performance in Task Manager Windows 10 easily. Task Manager shows CPU Utilization, Disk details, and memory usage with a bunch of information. So the only job left for you is to reach here and decipher them whether which process is consuming more memory or disk or network.
Since the Task Manager provides the details of the Memory, CPU, and Disk consumption so we will explain them one by one. For this, you need to open it first.
Open Task Manager
Step 1 – Press the shortcut combination “Control + Shift + Escape” on the keyboard and let the “Task Manager” open. By default, it will appear with the “Processes” tab, switch to Performance.
Step 3 – You find CPU, Memory, Disk, and Networks you are connected to in left pane. Each resource will display the whole information about the situation of usage.
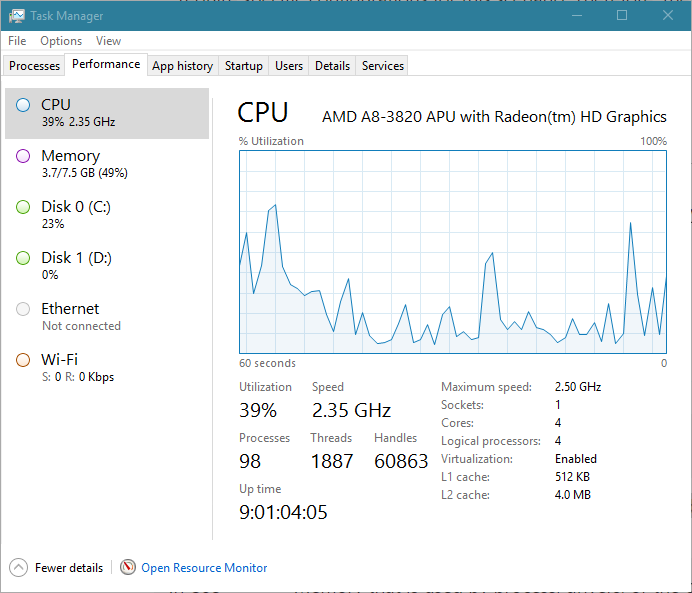
1. CPU
When you select CPU from the left pane, you notice a graph for %Utilization of CPU showing spikes. The line in the graphical view represents the cores used by your Windows system over 60 seconds.
CPU %Utilization refers to its percent involvement for doing all the tasks processing on your system. Suppose your CPU is single core with the set 2.0 Hz frequency and completes 1 billion cycles worth of work in a second. So when the graph is showing 40% then the core consumes 40 percent of its capacity in that second.
Hence, you get an exact idea CPU usage to analyze resources performance in Task Manager Windows 10.
How much CPU usage is Good?
So far as the question of what percentage of CPU usage is good or bad there is not a fix limit. You may notice a jump in the graph when gaming, upto 100%. Normal CPU usage is 2-4% when system is idle. When working with browser simply it’s about 10%, 20-25% while running office application and so on. So the data fluctuates now and then depending on the processes you are doing and it is not the matter of concern. You need to take care of the CPU temperature if the performance of your system is troubling.
More Information – In addition, you can see here Speed, number of Processes running presently, Threads, Handles, and Uptime. These data help you to understand the CPU utilization of your system more precisely. Some more information like Base speed, Sockets, Cores, Logical processors, etc are available in the bottom section.
2. Memory
When you click on the Memory in the left pane the detailed information of the physical memory usage comes into view in the right pane. The graph displays what is the Utilization percentage of your RAM over 60 seconds of current time.
You find one more graph here providing the information of Memory Composition. This implies the memory part engage in processes, drivers, or the operating system.
Apart from this, Committed, Cached, Paged pool, Non-paged pool are available in the bottom part.
In Memory section, you find the graph line remains almost still. When you open a new application the usage increases with certain percentage and decreases when close. It means more space of the memory is occupied by the application when you launch and evacuated when close. Memory includes the Committed and Cached data of system furthermore, Paged pool and Non-paged pool.
How much is Normal Memory usage?
It again depends on the RAM your PC is installed moreover, the number of applications you are running currently. But normally 30-40% is a better data of memory usage at idle you can be satisfied with. Although a jump in the memory usage graph for a short period doesn’t matter. But you need to seriously think to add more RAM in slots if it remains over 60-70% consistently.
3. Disk
The Disk in task manager gives important information regarding hard drive usage. You find two graphs here – one for Active time and another for Disk transfer rate. Both present the disk consumption over 60 seconds of time.
Active time indicates the time spent for the sake of “reading from” or “writing to” physical drives. Disk transfer rate shows the speed by which the data are copied from a system to the drive in the 60 seconds timeframe.
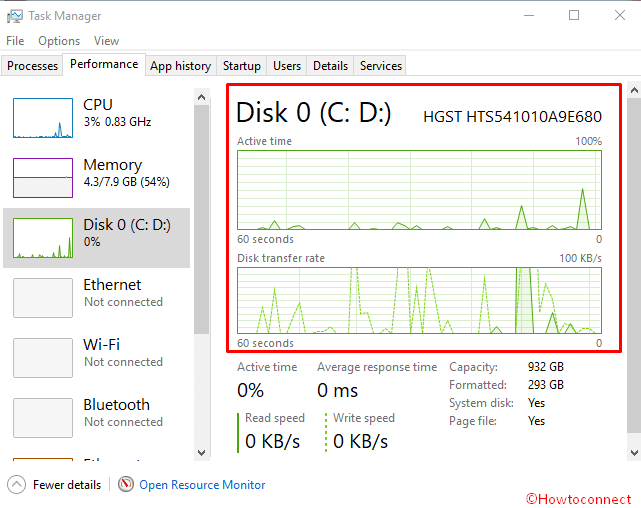
The lower part displays the same information in detail including Average response time and Read and Write speed. Besides, you find Capacity, formatted, system disks, and page file values and situations.
So Disk usage of the system in live report helps you to analyze resources performance in Task Manager Windows 10. Now the question is
What should be the Disk usage percentage?
It again depends on the total Disk space available on your computer and the task you are processing. But in normal circumstances, when your system is idle the consumption is around 2-4%. I have 1TB hard drive and while working with browser I find it between 0 to 10 percent.
Conclusion
So this is how you will analyze resources performance in Task Manager Windows 10. Once you are satisfied then it’s OK otherwise you can use different tools like Performance monitor, Reliability monitor, Disk checking command to deeply dig out the more information.

The Windows 10 Performance tab provides data and graphs that show you detailed information on the current activity of the CPU, memory, disks, and your Ethernet/Wi-Fi connections. This information can be useful in understanding how these main hardware components function. In this article, I’ll delve into Task Manager’s Performance tab and take a close look at the detailed information displayed in each section.
CPU
In the CPU section, shown in Figure A, you’ll find all kinds of details about the CPU in your system, including the brand name and model number at the top of the screen. In the lower right, you’ll see the CPU’s maximum speed, as well as the number of sockets, cores, and logical processors. You can tell at a glance whether the processor’s hardware virtualization technology is enabled. You can even find information about the CPU caches.
Figure A
The CPU section of the Performance tab provides detailed information about the CPU.
The graph displays the percentage of your CPU’s utilization on a scale of 0 to 100 over a 60-second timeframe. By default, the CPU section displays a single graph showing overall utilization. To see a graph for each logical processor, just right-click and select Change Graph To > Logical Processors. If you hover your mouse pointer over each graph, you’ll see a tool tip that identifies the CPU by number. The tool tip will even tell you if that particular processor is parked, as shown in Figure B. If a logical processor isn’t currently needed to handle the CPU load, Windows will park the CPU to conserve energy. However, once it’s needed, Windows will immediately put the CPU back to work.
Figure B
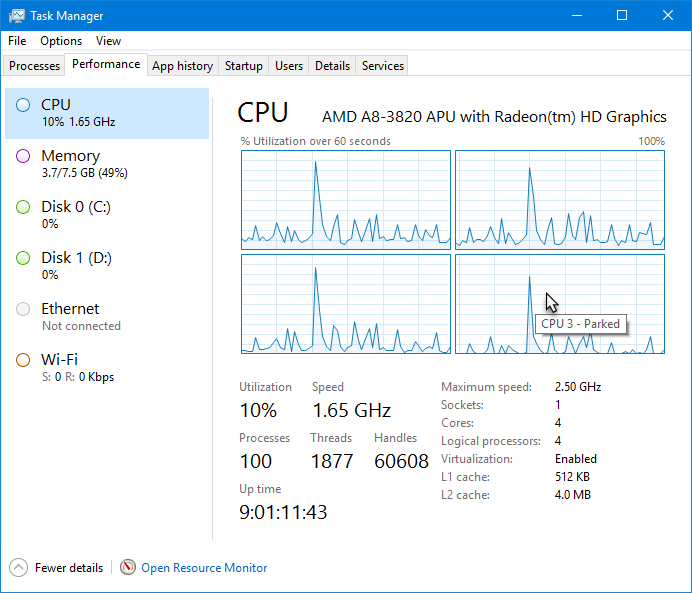
You can display a graph for each of the logical processors.
If you want the graph to display kernel time, right-click on it and select Show Kernel Times. The graph will display a second, darker scale that indicates the kernel time, as shown in Figure C. The lighter scale shows the total CPU time. The difference between kernel time and the total CPU time indicates the user time. Without getting too technical, the kernel time indicates code that is directly accessing the computer hardware, whereas the user time indicates code that must use system APIs to access the computer hardware.
Figure C

When you select Show Kernel Times, the graph displays information about kernel usage.
The Utilization value below the graph shows the percentage of the CPU that is being used at any one point in time. The Speed value shows the current speed at which the processor is running at any one point in time. The next line contains information on processes, threads, and handles. Threads and handles are actually sub-objects of processes. The Handles value shows the number of object identifiers, or handles, that are currently in use by all the running processes. The Threads value actually refers to the number of sub processes running inside larger processes. The Processes value, of course, represents the number of currently running processes.
Below that you’ll find the Up Time value, which shows the amount of time, measured in days, hours, minutes, and seconds, that the computer has been running since the last time it was shut down or restarted.
Memory
In the Memory section of the Performance tab, the total amount of memory is prominently displayed, along with the memory type at the top of the screen, as shown in Figure D. In the lower right, you’ll find the chip speed, the number of memory slots being used, and the form factor. You can even see the amount of memory that is marked as Hardware Reserved. This indicates the amount of memory reserved for use by the BIOS and drivers for peripheral devices that are installed in your system.
Figure D
The Memory section of the Performance tab, provides you with detailed information about memory usage.
As you can see, there are two graphs in the Memory section. The first graph shows memory usage on a scale of 0 to the total amount of memory over a 60-second timeframe. The second graph, titled Memory Composition, shows the memory used by processes, drivers, or the operating system. If you hover your mouse pointer over the sections of the Memory Composition graph, you’ll see that the darker section indicates the amount of memory in use and the lighter section indicates the amount of memory in standby. Figure E offers a composite view of this.
Figure E

When you hover your mouse over the Memory Composition graph, you’ll get more detailed information.
Below the graph you’ll see familiar measurements, such as the amount of memory in use and the amount of available memory. The Committed value is a simple measurement that shows Page File usage. Here, the first number indicates the total amount of physical and virtual memory currently in use, while the second number indicates the total amount of physical and virtual memory available on your computer.
The Cached value indicates the amount of physical memory used recently for system resources. (This memory will remain in the cache in case the system resources are needed again, but it’s available should other operations need it.)
The Paged Pool value indicates the amount of physical memory used by the operating system to store objects that can be written to disk when they’re not being used. The Non-paged Pool value indicates the amount of physical memory used by the operating system to store objects that can’t be written to disk but must remain in physical memory as long as they are allocated.
SEE: How to remove unwanted apps from Windows 10 (even though Microsoft doesn’t want you to)
Disk
On the Disk section of the Performance tab, the model number of the drive and the type of drive are displayed at the top of the screen, as shown in Figure F. In the lower right you can see how much of it is formatted, whether it’s the system disk, and whether it contains a page file.
Figure F

The Disk section of the Performance tab contains two graphs.
There are two graphs in the Disk section. The first is titled Active Time and shows the percentage of your disk’s utilization (the percentage of time the disk is processing read or write requests) on a scale of 0 to 100 over a 60-second timeframe. The second graph is titled Disk Transfer Rate and shows the transfer rates between the hard disk and the system over a 60-second timeframe.
Below the graphs is the Active Time value, which indicates the percentage of use at any one point in time. The Average Response Time value indicates of the amount of time it takes the drive to actually transfer data to the system. Of course, the Read and Write Speed values tell you how fast the disk is performing I/O operations.
SEE: How to remove pesky malware from your PC with Windows Defender Offline
Ethernet
In the Ethernet section of the Performance tab, the name of the Network card is displayed at the top of the screen, as shown in Figure G. You’ll also see the adapter name, the connection type, and both the IPv4 and IPv6 IP addresses.
Figure G

On the Ethernet section of the Performance tab, the name of the Network card is prominently displayed at the top of the section.
The graph shows the overall send and receive activity on a scale of 0 to 100 Kbps over a 60-second timeframe, while the Send and Receive values below the graph show the type of activity at any one point in time.
Wi-Fi
If you’re using a wireless Ethernet adapter, the Wi-Fi section of the Performance tab will show the name of the wireless card at the top of the screen, as shown in Figure H. You’ll also find the adapter name, the SSID, the connection type, both the IPv4 and IPv6 IP addresses, and the signal strength.
Figure H

On the Wi-Fi section of the Performance tab, you’ll find details about the wireless adapter.
If you right-click anywhere in the Ethernet or Wi-Fi sections and select View Network Details, you’ll see a second window full of detailed information, as shown in Figure I.
Figure I

Select View Network Details to display a second window full of detailed information.
Also read…
- How to enable PowerShell Remoting via Group Policy
- How to use PowerPoint 2016’s stunning new Morph transition
- How to tap into the benefits of Windows 10’s Default Programs tool
- Grab spectacular images from the Windows Spotlight lock screen with this handy script
What’s your take?
Do you think that there is enough information on the Performance tab in Task Manager to warrant your consideration? Share your thoughts with fellow TechRepublic members.