Время прочтения
3 мин
Просмотры 39K
Не так давно, для успешного прохождения аудита на соответствие стандартам PCI DSS, потребовалось включить аудит событий Windows серверов и что самое главное — настроить отправку уведомлений о критичных событиях на E-mail. Для Linux серверов вопрос решается установкой и настройкой OSSEC (ну еще могут понадобиться syslog ws loganalyzer и auditd), для Windows Server 2012 R2 да еще и русской версии он не подошел (в последствии нам таки удалось его адекватно настроить, если будет интересно — смогу описать как). Так что решили искать другие способы…
Первым дело следует включить аудит всех необходимых операций (управление учетными записями и контроль целостности файлов) в доменной политике. И если с аудитом операций над объектами Active Directory все просто, то вот с аудитом файловых операций придется повозиться. Тут, как нельзя кстати, компания Netwrix (не сочтите за рекламу, — компания автор коммерческого софта для аудита) подготовила замечательную статью: «Настройка аудита файловых серверов: подробная инструкция и шпаргалка» (.pdf).
Но вернемся к нашим «костылям». После успешной активации аудита всех необходимых операций и обнаружения в журналах Windows интересующих нас событий, встал вопрос об их отправке на сервер мониторинга… Логично было бы воспользоваться встроенными инструментами («Attach Task To This Event» не самый информативный инструмент, зато «родной» для Windows), но тут всплывает первый любопытный и не приятный момент от Microsoft — «Send an email and Display a message are deprecated for from Windows Server 2012 and Windows 8».
Send an e-mail (deprecated)

…
Согласно рекомендациям от Microsoft, как замену встроенному «deprecated» функционалу решили использовать скрипты PowerShell для фильтрации журналов и отправки по E-mail, благо есть подробные инструкции:
«Аудит Active Directory средствами Powershell с оповещением об изменениях».
«Аудит удаления и доступа к файлам и запись событий в лог-файл средствами Powershell»
Но тут возникла сложность другого характера: приведенные выше скрипты отсылали на E-mail только заголовки (темы) событий, тело письма было пустым  При всем при этом — если скрипт PowerShell запустить в PowerShell ISE «as Administrator», то приходит полное сообщение, как и было задумано!
пример скрипта отправки уведомления о событии ‘Заблокирован аккаунт’ — Event ID 4725:
$time =  (get-date) - (new-timespan -min 60)

$Subject = “Заблокирован аккаунт"
$Theme = “Только что был заблокирован аккаунт”
$Server = “smtp.server.local”
$From = “AD@domain.local”
$To = “support@domain.local”
$encoding = [System.Text.Encoding]::UTF8

#Выбирается последнее произошедшее событие с таким ID.
$TimeSpan = new-TimeSpan -sec 1
foreach($event in $events)
{
    $PrevEvent = $Event.Запись
    $PrevEvent = $PrevEvent - 1
    $TimeEvent = $Event.TimeCreated
    $TimeEventEnd = $TimeEvent+$TimeSpan
    $TimeEventStart = $TimeEvent- (new-timespan -sec 1)

$Body=Get-WinEvent -maxevents 1 -FilterHashtable @{LogName=”Security”;ID=4725;StartTime=$TimeEventStart;} | Select TimeCreated,@{n=”Account Name”;e={([xml]$_.ToXml()).Event.EventData.Data | ? {$_.Name -eq “TargetUserName”} |%{$_.’#text’}}},@{n=”Computer”;e={([xml]$_.ToXml()).Event.EventData.Data | ? {$_.Name -eq “TargetDomainName”}| %{$_.’#text’}}}
$body = $body -replace "@{" -replace "}" -replace "=", ": " -replace ";","`n" -replace "TimeCreated","Время события" -replace "^","`n"
$BodyM = $Body
}
Send-MailMessage -From $From -To $To -SmtpServer $server -Body “$BodyM `n$Theme” -Subject $Subject -Encoding $encoding
В общем, если у вас есть реально рабочие скрипты для такого случая — милости прошу в комментарии.
Мы же перешли к другому способу (вдохновила вот эта статья: «Мониторинг и оповещение о событиях в журналах Windows: триггеры событий» и выручила эта утилита: sendEmail):
- Добавляем в Task Scheduler задание по интересующему нас событию (прямо из журнала «Security» -> «Attach Task To This Event…«

- В Actions указываем запуск скрипта, в котором с помощью утилиты wevtutil делаем выборку из журнала и сохраняем результат в файл.
пример скрипта — выборка событий с Event ID 4726
del c:Auditquery_ID4726.txt wevtutil qe Security /q:"*[System[(EventID=4726)]]" /f:text /rd:true /c:1 > c:Auditquery_ID4726.txt - Вторым действием, с помощью утилиты sendEmail отправляем сохраненный файл по назначению:
пример аргументов для команды запуска sendEmail:
-f audit_AD@domain.local -s smtp.domain.local:25 -t support@domain.local -m "AD User Account Management - Event ID 426 - Account was Deleted" -a C:Auditquery_ID4726.txt


В результате должны получать что-то типа этого:

P.S. Спасибо всем авторам источников, указанных ранее!
First published on TECHNET on Oct 15, 2013
Overview
Work Folders is a new functionality introduced in Windows Server 2012 R2. It enables Information workers to sync their work files between their devices. This functionality is powered by the Work Folders service that can be enabled as a
Windows Server 2012 R2 File Services Role
service.
Work Folders relies on a set of core infrastructure services such as storage, file systems, networks and enterprise infrastructure solutions such as Active Directory Domain Services (AD DS), Active Directory Federation services, Web Application Proxy and more. Any problems with those infrastructure components or a misconfiguration of Work Folders might lead eventually to a degraded state or a complete unavailability of the Work Folders service. Not having the Work Folders service running properly might impact the users’ capabilities to sync files between their different devices.
Just like other enterprise solutions, the Work Folders service comes with a set of logging and monitoring tools that allows IT Pros to identify, understand and solve issues or errors that the system is facing.
This blog post will cover several monitoring and logging solutions that facilitate early identification of Work Folders service issues and also help understand the root cause that instigated the problem.
Monitoring Work Folders Operational health with Server Manager and Event Viewer
Server Manager
Server Manager
in most cases will be the best starting point to understand the health status of the Work Folders service. The File and Storage Services tiles display server level information such as running services status and related events. There is also a specific canvas for Work Folders which provides sync share and Work Folders-specific information.
To see the Work Folders service status and related events, open
Server Manager
and navigate to the servers’ canvas through “Files and Storage Services” -> “Servers”. The tiles in this canvas (as shown in image 1) display services health and events related to Work Folders and other File and Storage Services.
The Work Folders service name is “Windows Sync Share” and any events related to Work Folders will show as a “Microsoft-Windows-SyncShare” Source (Work Folders events will be explained later in this document)

Image 1 — In this example, we can see that the Sync Share service is running properly, but there was a Work Folders error trying to access the file system as shown in the events tile. (This specific issue can be caused by lack of access permissions or physical disk access issues)
To view specific sync shares information, in
Server Manager
, go to “Files and Storage Services” -> “Work Folders”. This Work Folders canvas displays related information such as the file system location of the sync share and the users that are mapped to this sync share. It also provides important information about the volumes and file systems that the sync share resides on. This canvas is a good view to spot storage and file system related issues such as low disk space that might impact the Work Folders directories

Image 2 – The Work Folders canvas shows sync shares information. In this example, the “HRWorkFolders” which resides on the G:hrworkfolders share is selected. Once selected, the other tiles on this canvas show additional information for the selected sync share. This includes the list of users that are mapped to that sync share (managed by security groups), the volume information for the sync share, and the quota settings.
Selecting sync shares from the master tile above is expandable to multi sync shares (by holding the CTRL key and selecting more sync shares, or using the CTRL-A key combination to select all shares in the sync shares tile). When multiple sync shares are selected, the related tiles will also transform to a multiple objects view as shown in image 3 below. This multi objects view is useful to get a broader view of the sync shares, the amount of remaining space on their respective volume and any quota thresholds that might be met.

Image 3 – The primary sync share tile allows multiple sync shares selection. Related tiles react accordingly by showing multiple rows of volume and quota information as well. We can see in this example that the “HRWorkFolders” quota is low on free space and should be extended.
The tiles described above are useful in displaying the system’s status, but if a lot of volumes and drives are used for Work Folders, information rows that display low quota or low disk space might not stand out. One way to easily spot volumes or quotas which are almost full is to
sort
the free space and capacity columns to list the ones with the least amount of remaining space up on top (by clicking on the column title). Another way is to use the tiles built in filter boxes. Image 4 below shows the ability to only show Sync Shares hosting volumes which have less than 10GB of available space. Those filters can also be saved for future usage.

Image 4 – Volumes tile on the Work Folders canvas set with a filter to only show volumes with less than 10GB of free space.
It is also possible from the Work Folders canvas, to drill down even further and get status information for a specific user across his different Work Folders devices. This can be done by selecting the appropriate user from the users’ tile, and selecting the properties context menu item (as seen in image 5 and 6 below). This view provides more information on the users’ devices and can be used to identify specific users’ devices issues.

Image 5 – Work Folders user context menu
The Properties dialog will present information about the users Work Folder location, the devices that run Work Folders, their last sync date and more.

Image 6 – Work Folders status for Sally. This dialog displaying sync information of Sally’s different devices.
Event Viewer
The Work Folders service writes operational information, warning and error events to the Microsoft-Windows-SyncShare/Operational channel. This channel contains informational level events such as creation of a user sync share folder and warnings about the system health. It also logs errors that describe critical issues that needs to be addressed, such as the service not being able to access the file system.
There is also a Microsoft-Windows-SyncShare/Reporting channel that logs successful user sync actions. In this reporting channel, each logged event represents a successful sync action by a device, the size of the sync set, the number of files in the sync set and the device information such as OS version and type. These events can be used to understand the overall health of the system and collected for understanding Work Folders usage trends.
Listing and collecting the Reporting logs be done either through
System Reports in Operations Manager
, or as an alternative, by running PowerShell scripts that collect the data and export it to a CSV which can then be analyzed in Microsoft Excel. (See an example down below in the PowerShell section)
There are 2 main tools that can be used to read these events.
In
Server Manager
, by going to the “Files and Storage Services” -> “Servers” and browsing the events tiles (see image 7). Note that this tile displays Work Folders related events and other File and Storage Services events. This tile lists only the operation channel events (reporting channel events are not shown).

Image 7 – Work Folders Events are shown in the Files and Storage Services/Servers canvas
Another way to view the logs is by using the Event Viewer. Event viewer can be opened from different locations, either by typing “eventvwr” in a command or PowerShell console or by using the Tools menu in Server Manager (showing on the upper right corner).
Once Event Viewer is opened, use the tree on the left pane to navigate to “Windows logs” -> “Microsoft” -> “Windows” -> Sync Share (see image 8). Underneath the SyncShare node, you’ll find the operational and reporting channels. Clicking on each one of them will bring up the list of events (see image 9)

Image 8 – Work Folders Sync Share events location in event viewer

Image 9 – Work Folders user events showing in the Event Viewer pane
Monitoring Work Folders with PowerShell
The Work Folders Service on Windows Server 2012 R2 comes with a supporting PowerShell module and cmdlets. (For the full list of Work Folders Cmdlets run gcm –m SyncShare in a Powershell console).
Just like in the examples shown above, where Server Manager was used to monitor and extract the information, the Work Folders cmdlets provide a way to retrieve Work Folders sync shares and users information. This can be either used by administrators for interactive monitoring session or for automation within PowerShell scripts.
Here are a few Powershell examples that provides Work Folders sync shares and users status information.
Get-SyncShare
— The Get-SyncShare cmdlet provides information on sync shares. This includes the file system location, the list of security groups and more.

From these objects, Staging folder and Path can be extracted and checked for availability and overall health.
Get-SyncUserStatus
— similar to the users’ property window described above in the server manager section, this cmdlet provides Work Folders users’ information. This includes the user name, the devices that the users are using, last successful connections and more. Running this cmdlet requires providing the specific user name and sync share.
Here is an example for listing the devices and status that Sally is using with Work Folders:

In the results shown above, useful user information is shown about the user’s devices, their OS configuration and last successful sync time.
Get-Service
— The Sync Share service (named SyncShareSVC ) status can be read by using PowerShell’s generic get-service command

In the above example we can see that the service is in “Running” state. “Stopped” means that the service is not running.
Events
– Powershell also provides an easy way of listing Work Folders events, either the operational or the reporting channels. Here are a few examples:
1) Listing Errors from the operational channel (in this example, the issues are reported on a system where one of the disks hosting the Work Folders directory was intentionally yanked out)

2) List successful events from the Work Folders Reporting channel

Other Work Folders Monitoring Tools and Solutions
While this post focuses on Work Folders Server Manager tiles and Powershell cmdlets, there are more useful tools that can be used to monitor a Work Folders deployment.
Work Folders Best Practice Analyzer
Windows Server 2012 R2 comes with a built in set of Work Folders BPA rules. Though BPA rules intent is to alert on configuration issues, they can be used to routinely monitor and identify issues that might impact the Work Folders service.
More details on Work Folders BPA rules can be found
here
Work Folders System Center Operations Manager File Services Management Pack.
A new File and Storage Services management pack for windows server 2012 R2 should come out shortly after windows server 2012 R2 general availability. This pack will also include Work Folders service monitoring capabilities that can be used with a System Center Operations Manager.
More information on System Center Operations Manager is available
here
.
Performance monitoring
Work folders didn’t introduce any new performance monitors, however, since the Work Folders service is hosted by a web service, setting performance monitoring on the web service instances can provide valuable information on the clients Work Folders data transfer, queues and more. Furthermore, performance monitors can be also set on Network, CPU and other valuable system components that are essential for the Work Folders Service.
More information on Performance monitors can be found
here
Work Folders Supporting Systems monitoring (AD, ADFS, Web Application Proxy and SSL Certificates)
As mentioned above, Work Folders rely on a set of enterprise solutions to work properly. These include, but not limited to, Active directory, Active Directory Federation Service, Web Applications Proxy, Certificate expiration dates and more. Any impact on any one of these services might impact the Work Folders service. To sustain a long running Work Folders service, it is also recommend that any one of the supporting components will also be monitored.
More information on certificate management and monitoring certificate expirations can be found
here
.
Other Work Folders Related Links
-
Work Folders on TechNet
-
Storage and File Services Cmdlets Quick Reference Card
-
Work Folders Test Lab Deployment
В этой статье мы рассмотрим особенности использования встроенных счетчиков производительности Performance Monitor для мониторинга состояния Windows Server. Счетчики PerfMon можно использовать для отслеживания изменений определенных параметров производительности сервера (алертов) и оповещать администратора в случае возникновения высокой загрузки или других нештатных состояниях.
Чаще всего для мониторинга работоспособности, доступности, загруженности серверов используются сторонние продукты. Если вам нужно получать информацию о производительности приложений либо железа только с одного-двух Windows-серверов, либо когда это нужно на непостоянной основе, либо возник более сложный случай, требующий глубокого траблшутинга производительности, то можно воспользоваться встроенным функционалом Windows Performance Monitor.
Performance Monitor имеет огромное количество счётчиков для получения информации о железе, операционной системе, установленном ПО в виде конкретных цифр. Performance Monitor может вести наблюдение за показателями производительности сервера в реальном времени или записывать историю.
Основные возможности Performance Monitor, которые можно использовать отдельно или совместно с другими сторонними системами мониторинга (типа Zabbix, Nagios, Cacti и другие):
- cистема мониторинга при выводе информации о производительности сначала обращается к Performance Monitor;
- главной задачей системы мониторинга является оповещение о наступлении тревожного момента, аварии, а у Performance Monitor – собрать и предоставить диагностические данные.
Текущие значения производительности Windows можно получить из Task Manager, но Performance Monitor умеет несколько больше:
- Task Manager работает только в реальном времени и только на конкретном (локальном) хосте;
- в Performance Monitor можно подключать счётчики с разных серверов, вести наблюдение длительное время и собранную информацию сохранять в файл;
- в Task Manager очень мало показателей производительности.
Мониторинг производительности процессора с Perfomance Monitor
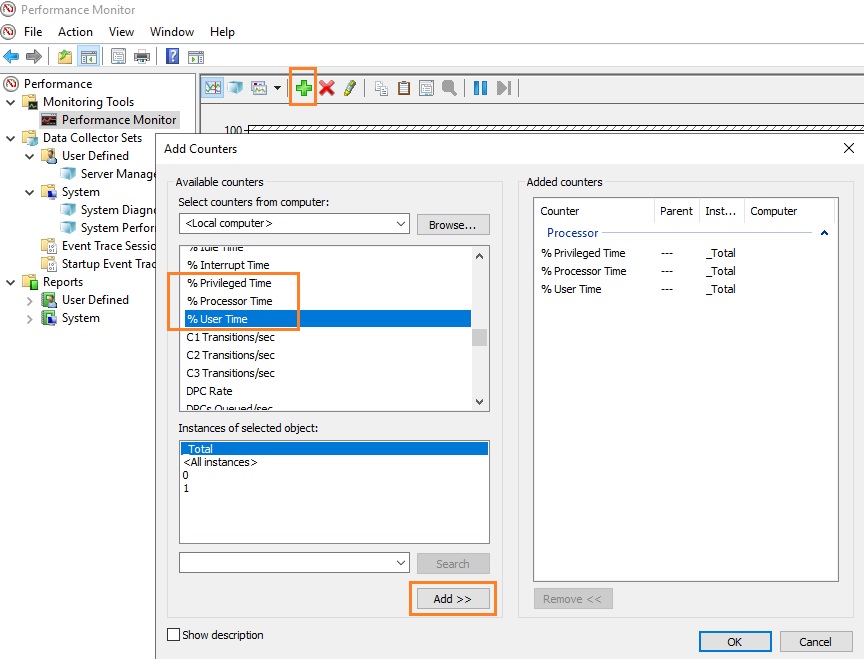
Для снятия данных о производительности процессора воспользуемся несколькими основными счётчиками:
- Processor% Processor Time — определяет уровень загрузки ЦП, и отслеживает время, которое ЦП затрачивает на работу процесса. Уровень загрузки ЦП в диапазоне в пределах 80-90 % может указывать на необходимость добавления процессорной мощности.
- Processor%Privileged Time — соответствует проценту процессорного времени, затраченного на выполнение команд ядра операционной системы Windows, таких как обработка запросов ввода-вывода SQL Server. Если значение этого счетчика постоянно высокое, и счетчики для объекта Физический диск также имеют высокие значения, то необходимо рассмотреть вопрос об установке более быстрой и более эффективной дисковой подсистемы (см. более подробную статью об анализе производительности дисков с помощью PerfMon).
- Processor%User Time — соответствует проценту времени работы CPU, которое он затрачивает на выполнение пользовательских приложений.
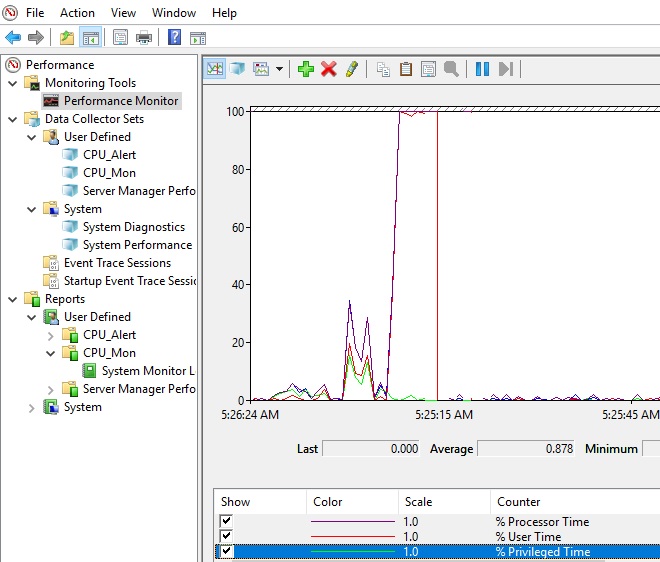
Запустите Performance Monitor с помощью команды perfmon. В разделе Performance Monitor отображается загрузкой CPU в реальном времени с помощью графика (параметр Line), с помощью цифр (параметр Report), с помощью столбчатой гистограммы (параметр Histogram bar) (вид выбирается в панели инструментов). Чтобы добавить счетчики, нажмите кнопку “+” (Add Counters).
Слева направо двигается линия в реальном времени и отображает график загрузки процессора, на котором можно увидеть, как всплески, так и постоянную нагрузку.
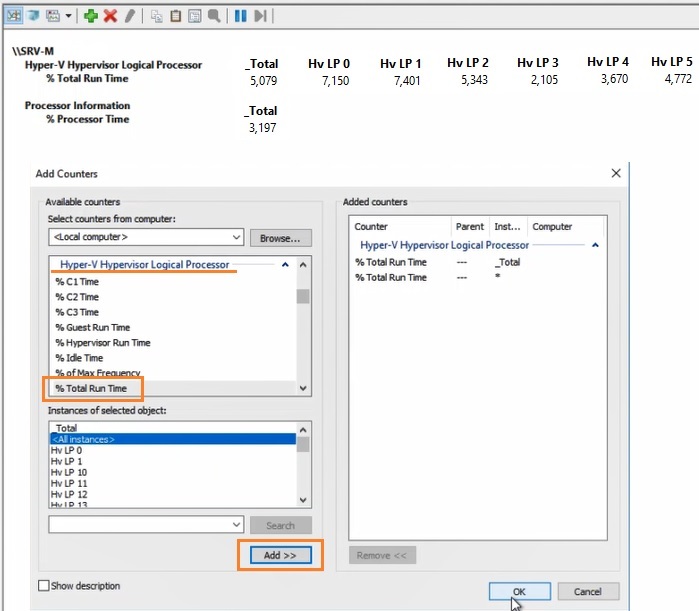
Например, вам нужно посмотреть загрузку процессора виртуальными машинами и самим Hyper-V. Выберите группу счетчиков Hyper-V Hypervisor Logical Processor, выберите счетчик % Total Run Time. Вы можете показывать нагрузку по всем ядрам CPU (Total), либо по конкретным (HV LP №), либо всё сразу (All Instances). Выберем Total и All Instances.
Группы сборщиков данных в PerfMon
Чтобы не сидеть целый за наблюдением движения линии, создаются группы сбор данных (Data Collector Set), задаются для них параметры и периодически просматриваются.
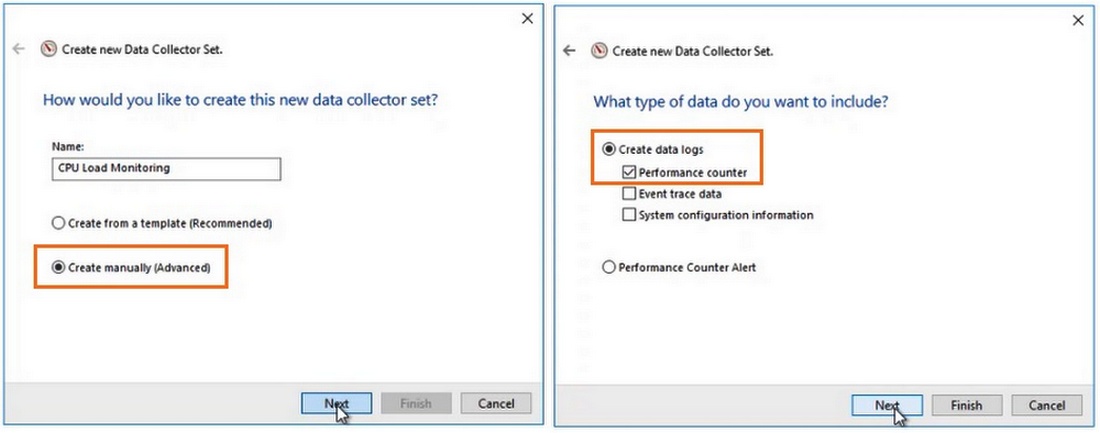
Чтобы создать группу сбора данных, нужно нажать на разделе User Defined правой кнопкой мыши, в меню выбрать New -> Data Collector Set. Выберите Create manually (Advanced) -> Create Data Logs и включите опцию Performance Counter. Нажмите Add и добавите счётчики. В нашем примере % Total Run Time из группы Hyper-V Hypervisor Logical Processor и Available MBytes из Memory. Установите интервал опроса счётчиков в 3 секунды.
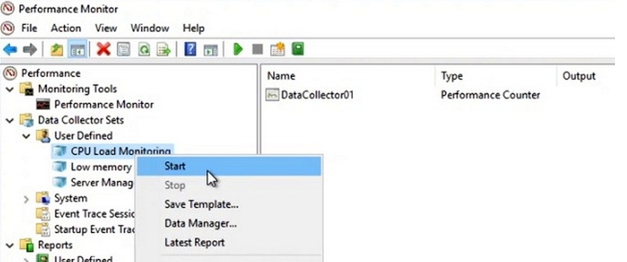
Далее вручную запустите созданный Data Collector Set, нажав на нём правой кнопкой мыши и выбрав в меню пункт Start.
Через некоторое время можно просмотреть отчёт. Для этого в контекстном меню группы сбора данных нужно выбрать пункт Latest Report. Вы можете посмотреть и проанализировать отчёт производительности в виде графика. Отчёт можно скопировать и переслать. Он хранится в C:PerfLogsAdminCPU_Mon и имеет расширение .blg.
Если нужно на другом сервере запустить такой же набор счётчиков, как на первом, то их можно переносить экспортом. Для этого в контекстном меню группы сбора данных выберите пункт Save Template, укажите имя файла (расширение .xml). Скопируйте xml файл на другой сервер, создайте новую группу сбора данных, выберите пункт Create from a template и укажите готовый шаблон.
Создание Alert для мониторинга загрузки CPU
В определённый критический момент в Performance Monitor могут срабатывать алерты, которые помогают ИТ-специалисту прояснить суть проблемы. В первом случае алерт может отправить оповещение, а во втором – запустить другую группу сбора данных.
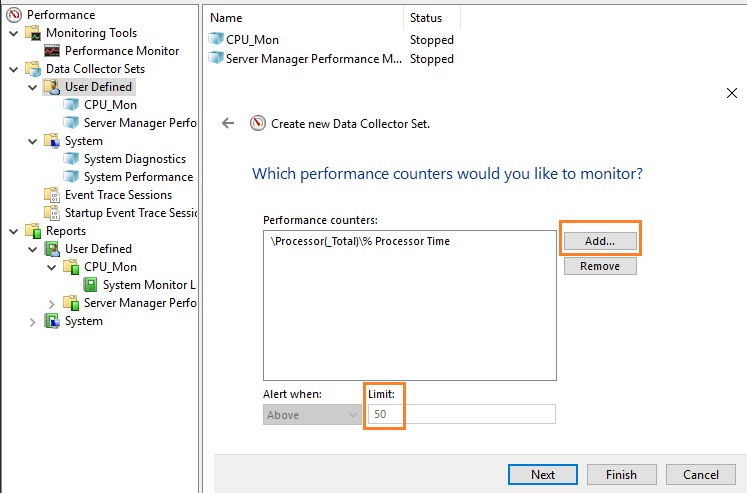
Чтобы создать алерт в PerfMon, нужно создать ещё один Data Collector Set. Укажите его имя CPU_Alert, выберите опцию Create manually (Advanced), а затем — Performance Counter Alert. Добавьте счётчик % Total Run Time из Hyper-V Hypervisor Logical Processor, укажите границу загрузки 50 %, при превышении которой будет срабатывать алерт, установите интервал опроса счётчика в 3 секунды.
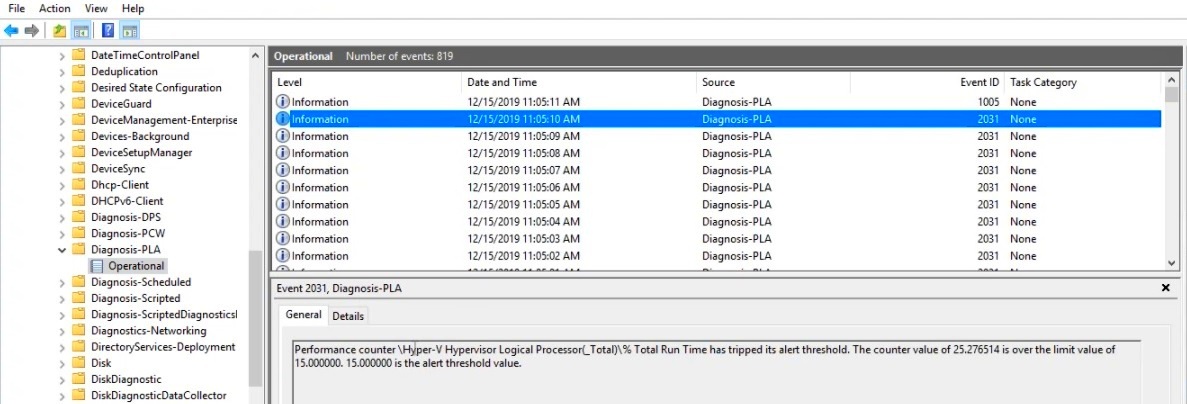
Далее нужно зайти в свойства данной группы сбора информации, перейти на вкладку Alert Action, включить опцию Log an entry in the application event log и запустить группу сбора данных. Когда сработает алерт, в журнале (в консоли Event Viewer в разделе Applications and Services LogsMicrosoftWindowsDiagnosis-PLAOperational) появится запись:
“Performance counter Processor(_Total)% Processor Time has tripped its alert threshold. The counter value of 100.000000 is over the limit value of 50.000000. 50.000000 is the alert threshold value”.
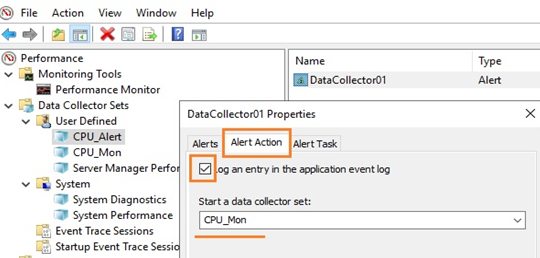
Здесь же рассмотрим и второй случай, когда нужно запустить другую группу сбора данных. Например, алерт срабатывает при достижении высокой загрузки CPU, делает запись в лог, но вы хотите включить сбор данных с других счётчиков для получения дополнительной информации. Для этого необходимо в свойствах алерта в меню Alert Action в выпадающем списке Start a data collector set выбрать ранее созданную группу сбора, например, CPU_Mon. Рядом находится вкладка Alert Task, в которой можно указать разные аргументы либо подключить готовую задачу из консоли Task Scheduler, указав её имя в поле Run this task when an alert is triggered. Будем использовать второй вариант.
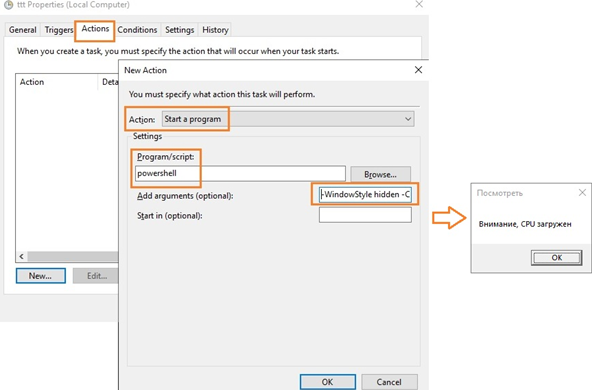
С помощью Task Scheduler можно выполнить какие-то действия: выполнить команду, отправить письмо или вывести сообщение на экран (сейчас последниед ве функции не поддерживаются, считаются устаревшими (deprecated)). Для вывода на уведомления на экран можно использовать скриптом PowerShell. Для этого в консоли Task Scheduler создайте новую задачу, на вкладке Triggers выберите One time, на вкладке Actions в выпадающем поле Action выбирите параметр Start a program, в поле Program/Script укажите powershell.exe, а в поле Add arguments (optional) следующий код:
-WindowStyle hidden -Command "& {[System.Reflection.Assembly]::LoadWithPartialName('System.Windows.Forms'); [System.Windows.Forms.MessageBox]::Show('Внимание, CPU загружен', 'Посмотреть')}"
Для отправки письма вы можете воспользоваться командлетом PowerShell Send-MailMessage или стороннюю утилиту mailsend.exe.. Для этого создайте аналогичное задание в Task Scheduler, в поле Program/Script укажите полный путь к утилите (у нас C:ScriptsMailmailsend.exe), а в поле Add arguments (optional) через параметры нужно передать значения: электронный адрес, адрес и номер порта SMTP-сервера, текст письма и заголовка, пароль:
-to [email protected] -from [email protected] -ssl -port 465 -auth -smtp smtp.ddd.com -sub Alarm -v -user [email protected] +cc +bc -M "Alarm, CPU, Alarm" -pass "it12345"
где +cc означает не запрашивать копию письма, +bc — не запрашивать скрытую копию письма.
This post is part 1 of a 3-part series on monitoring the health and performance of the Windows operating system. Part 2 details how to monitor Windows Server 2012 natively with a variety of tools, and Part 3 explains how to monitor Windows with Datadog. For an in-depth webinar and Q&A session based on this series, check out this slide deck and video.
A window into Windows performance
Operating systems monitor resources continuously in order to effectively schedule processes. However, surfacing that data for your own monitoring or analytics is not always easy. Fortunately, the Windows Server family of operating systems offer a wealth of operational data that you can access through a number of channels. To help make your Windows infrastructure observable, you need to track several types of data from Windows Server 2012:
- Performance counters
- Events
- Services
A few notes about terminology: In this series, we use the term “Windows” to reference Windows Server 2012 R2 specifically, though many of the performance counters and events discussed in this series are available in other Windows Server versions. And we’ll characterize metrics as “work” or “resource” metrics—for background on this distinction, refer to our Monitoring 101 posts on metric collection and alerting.
Performance counters/metrics
Windows exposes a huge number of metrics (more than 15,000 on a fresh install) as so-called performance counters. Key performance counters can be divided into four groups:
- CPU
- Memory
- Disk
- Network
The lists provided below provide a good foundation to get started monitoring Windows Server, no matter if your box is a file server, DNS server, Active Directory Domain Controller, or otherwise. Though many of these metrics are not immediately actionable, taken in aggregate, they provide a clear view of the state of the system at a point in time, which is invaluable when performing root cause analysis or troubleshooting. Of course, depending on your use case, there may be additional performance counters to monitor.
CPU metrics
| WMI Class | Property name | Description | Metric Type |
|---|---|---|---|
| Win32_PerfFormattedData_PerfOS_Processor | PercentProcessorTime | Percentage of time CPU is performing work | Resource: Utilization |
| Win32_PerfFormattedData_PerfProc_Thread | ContextSwitchesPersec | Number of times the processor switched to a new thread | Other |
| Win32_PerfFormattedData_PerfOS_System | ProcessorQueueLength | Number of threads waiting on a processor | Resource: Saturation |
| Win32_PerfFormattedData_PerfOS_Processor | DPCsQueuedPersec | Number of lower-priority tasks deferred due to interrupts | Resource: Saturation |
| Win32_PerfFormattedData_PerfOS_Processor | PercentPrivilegedTime PercentDPCTime PercentInterruptTime | Percentage of time CPU spent in privileged mode/deferred procedure calls/interrupts | Resource: Utilization |
PercentProcessorTime
Prolonged periods of 100 percent CPU usage indicates a resource bottleneck. Correlating CPU usage with the length of the processor queue can help you determine if your workload is too much for the machine. High CPU usage alongside spikes in processor queue length imply a lack of adequate compute resources for the operating system to complete the work it’s tasked with.
ContextSwitchesPersec
A context switch occurs when a processor has completed the execution of a task (or is interrupted before completion) and switches to a new one. A context switch is an expensive operation that involves the following steps, as outlined in Microsoft’s reference guide:
- Save the context of the just-completed thread
- Push the completed thread down to the end of the queue associated with its priority level
- Find the highest-priority queue containing executable threads
- Pop the thread at the head of that queue, load its context, and execute it
A high rate of context switching typically indicates resource contention and points to a CPU bottleneck. Though if the context switches are occurring due to some demanding hardware device (with a corresponding increase in the rate of interrupts), the problem could lie in its driver.
Microsoft offers a few tips here on optimizing workloads to minimize context switching, among other useful tidbits.
ProcessorQueueLength
Threads in the processor queue are ready to run but can’t, due to another thread running on the processor. Queues with sustained element counts greater than 2 are indicative of a bottleneck.
Keep in mind that queues are likely to increase in size during periods of high processor activity, but queues can also develop when utilization is well below 90 percent.
DPCsQueuedPersec
Deferred procedure calls (DPCs) provide a low-priority interrupt mechanism on Windows systems. Understanding deferred procedure calls requires a brief explanation of system interrupts in an operating system context.
Hardware requirements demand real-time, unfettered access to the CPU in order to ensure that high-priority work (like accepting keyboard input) is performed when it is needed. Interrupts provide a means by which devices can interrupt the processor and force it to perform the requested operation (triggering the processor to perform a context switch). Some work from devices may be put off until later, but still must be accomplished in a timely manner. Enter DPCs.
Through DPCs, real-time processes like device drivers can schedule lower-priority tasks to be completed after higher-priority interrupts are handled. DPCs are created by the kernel, and can only be called by kernel mode programs.
A high or near-constant number of DPCs could point to issues with low-level system software. An unused but buggy sound driver could be the culprit, for example. For more information on finding the offending service or program, check out part two of this series.
PercentPrivilegedTime, PercentDPCTime, and PercentInterruptTime
This trio of percentages offers insight into high CPU usage. PrivilegedTime is the time the CPU spends processing instructions from kernel-mode programs, DPCTime is the time the CPU spends processing deferred procedure calls, and InterruptTime is the time the CPU spends handling interrupts. It should be noted that the processor regularly issues interrupts to switch context to a new thread, so you should expect some level of background noise for this metric.
Systems that are spending 30 percent or more of their time processing privileged instructions should be inspected. First, examine DPCTime and InterruptTime; if either value exceeds 20 percent, a hardware issue is likely to be the culprit. You can use a tool like xperf (bundled with Windows) to dig deeper into the offending process.
Memory metrics
| WMI Class | Property name | Description | Metric Type |
|---|---|---|---|
| Win32_PerfFormattedData_PerfOS_Memory | AvailableMBytes | Amount of physical memory available (MB) | Resource: Utilization |
| Win32_PerfFormattedData_PerfOS_Memory | CommittedBytes | Amount of virtual memory (in bytes) committed | Resource: Utilization |
| Win32_PerfFormattedData_PerfOS_Memory | PoolNonpagedBytes | Amount of memory (in bytes) excluded from the paging pool | Resource: Utilization |
| Win32_PerfFormattedData_PerfOS_Memory | PageFaultsPersec | Page faults per second | Resource: Saturation |
| Win32_PerfFormattedData_PerfOS_Memory | PagesInputPersec | Number of pages retrieved from disk (per second) | Other |
| Win32_PerfFormattedData_PerfOS_PagingFile | PercentUsage | Percent of paging file used | Resource: Utilization |
AvailableMBytes
It is important to keep an eye on the amount of available memory, as contention for RAM will inevitably lead to paging and performance degradation. To keep your machine humming along, make sure it has an ample amount of RAM for your workloads. Consistently low memory availability can lead to segmentation faults and other serious issues. Possible remedies include increasing the amount of physical memory in the system and, if appropriate, enabling memory page combining.
CommittedBytes
CommittedBytes represents the actual demand for virtual memory. Memory that has been allocated, whether in physical RAM or the page file, counts towards the CommittedBytes total. When the number of CommittedBytes approaches or exceeds the physical memory of the system, paging to disk (and its associated performance impacts) is unavoidable.
If the value of CommittedBytes converges on the maximum memory of the system, then you are running out of available memory and must either increase the size of the page file or increase the amount of physical memory available.
In general, if this metric is trending upward increasing without leveling off, you should investigate.
PageFaultsPersec
Page faults occur when a process requests a page in memory that can’t be found. There are two types of page faults: soft and hard. A soft page fault indicates that the page was found elsewhere in memory. A hard page fault indicates that the page had to be retrieved from disk. Systems can tolerate a fairly high number of soft page faults, though hard page faults often result in delays.
The PageFaultsPersec metric tracks the number of page faults, both soft and hard. To focus on hard page faults, look for high values of pages input per second (outlined below). If you identify a surge in hard page faults, you should either increase system memory, or else decrease the system cache size to free up memory for paging.
Monitoring the working set of process memory allows you to correlate a specific process’s memory usage with page faulting. Under heavy load, the operating system will continuously trim processes’ working memory, resulting in frequent page faults. To narrow down the offending process, you can also correlate with page fault frequency by process (check the Win32_PerfFormattedData_PerfProc_Process object).
PoolNonpagedBytes
As mentioned above, the Windows kernel and hardware devices require the ability to preempt other threads to execute their time-sensitive work. Because of these strict requirements, devices and the kernel access physical memory directly, and not through virtual memory, as do user-mode processes.
This special pool of memory is not subject to paging to disk, due to the time requirements of its users. Normally, this is not an issue. But the special treatment of this pool means that problems with the components using this memory could be fatal for the system. Memory leaks in drivers that use the non-paged pool, for instance, could lock up the system entirely, as memory for user-mode processes is dumped to disk. Keeping an eye on this metric is useful for debugging memory leaks and other showstopping issues.
Windows Event 2019 (“Nonpaged Memory Pool Empty”) will occur in the event of insufficient allocable memory. (Though the Microsoft reference page lists the cause as a TCP/IP sockets program continuously attempting to open a nonexistent socket, this event will also occur if the non-paged pool address space is exhausted.)
PagesInputPersec
This metric reports the number of pages read from disk (as opposed to the number of read operations) to resolve hard page faults.
Recall that there are two types of page faults, and only hard page faults require fetching the page from disk. Tracking PagesInputPersec alongside PageFaultsPersec gives a clear view into the type of fault occurring. High values of the PagesInputPersec counter indicate hard page faults.
It is worth mentioning that when a hard page fault does occur, Windows attempts to retrieve multiple, contiguous pages into memory, to maximize the work performed by each read. This, in turn, can potentially increase a page fault’s performance impact, as more disk bandwidth is consumed reading in potentially unneeded pages. All of this can potentially be avoided by putting your page file (see next section) on a separate physical (not logical) disk, or increasing the amount of RAM available to your system.
PercentUsage
The paging file is a “hidden” file in the Windows system folder, used to store infrequently accessed memory pages on disk to free up RAM for other things. If you are familiar with Linux, the page file is similar to the swap partition.
Because the paging file is located on disk, not only will reads/writes to it impact overall system performance, but it is also subject to fragmentation, which degrades system performance even further.
By default, Windows manages the page file, which means the size of the file can increase or decrease without any user input. However, some cases may warrant manual tweaking of the file size. For more information on tuning your page file size (and other potential optimizations), check out Microsoft’s documentation on page file tuning.
Disk metrics
| WMI Class | Property name | Description | Metric Type |
|---|---|---|---|
| Win32_PerfFormattedData_PerfDisk_LogicalDisk | PercentFreeSpace | Percentage of disk space remaining | Resource: Utilization |
| Win32_PerfFormattedData_PerfDisk_LogicalDisk | PercentIdleTime | Percentage of time disk was idle | Resource: Availability |
| Win32_PerfFormattedData_PerfDisk_LogicalDisk | AvgDisksecPerRead AvgDisksecPerWrite | Average time of a read/write operation (in seconds) | Work: Performance |
| Win32_PerfFormattedData_PerfDisk_LogicalDisk | AvgDiskQueueLength | Average number of read/write requests (per disk) in queue | Resource: Saturation |
| Win32_PerfFormattedData_PerfDisk_LogicalDisk | DiskTransfersPersec | Rate of read/write operations on disk | Work: Throughput |
| Win32_PerfFormattedData_PerfOS_Memory | CacheBytes | Size of file system cache in memory | Resource: Utilization |
PercentFreeSpace
Maintaining ample free disk space is a necessity for any operating system. Beyond regular processes requiring disk, core system processes store logs and other kinds of data on disk. Windows will issue a warning if your available disk space drops below 15 percent, but you should alert on this metric to catch the smoke before the fire.
PercentIdleTime
This metric reports the percentage of time the disk was idle. If you are hosting your page file on a drive separate from the OS drive, you should definitely track and potentially alert on this metric, on both your primary drive and the page file’s drive. Low values for idle time should be investigated; high I/O on the page file disk will translate to increased memory access times, which will be felt by any application whose memory is mapped to the paging file. Possible solutions include moving the paging file to an unused drive or a faster drive.
Beyond the paging file, performance of applications that make heavy use of the disk (like SQL Server, for example) will certainly suffer during prolonged periods of high I/O.
AvgDisksecPerRead and AvgDisksecPerWrite
This pair of metrics tracks the average amount of time taken for disk read/write operations. In general, values larger than about 30 milliseconds indicate relatively high latency, which can often be reduced by moving to faster disks. Depending on the role of your server, the acceptable threshold could be much lower—as low as 10 milliseconds if you are running Exchange Server or SQL Server.
AvgDiskQueueLength
The average disk queue length gives a running average of the number of read/write requests in the queue. This value is not a direct measurement of the disk queue at any given point in time; it is an estimate derived from (Disk Transfers/sec) * (Disk secs/Transfer).
Generally speaking, if the average disk queue length exceeds 2 * (number of drives) for prolonged periods, a bottleneck is forming.
DiskTransfersPersec
If your server is hosting a demanding application, like SQL Server or Exchange, you will want to monitor your disk I/O rates. The DiskTransfersPersec metric is an aggregate of read (DiskReadsPersec) and write (DiskWritesPersec) activity, tagged by disk (and a total across all disks tagged with _Total). Sustained periods of high disk activity could lead to service degradation and system instability, especially when coupled with high RAM and page file use. Possible remedies include increasing the number of disks in use (especially if you’re seeing a large number of ops in queue), using faster disks, increasing RAM reserved for file system cache (see below), and distributing the offending workload across more machines, if possible.
CacheBytes
The CacheBytes counter tracks the size, in bytes, of the portion of memory reserved as a file system cache. Whereas the paging file is used to store memory contents on disk, the file cache stores disk contents in RAM, for faster access.
Tuning the file cache size for optimal performance is a balancing act—if the cache is too small, access to files is slower; if the cache is too large, programs may end up with their memory paged to disk, slowing them down. By default, Windows takes care of this for you, allocating free RAM to be used for the file cache. However, your requirements may require manual tweaking of the file cache, for which you can use a tool like CacheSet.
It is worth mentioning that if you are opening many “large” files (larger than about one gigabyte), your issue may be caused by an issue in the accessing process, specifically, calling CreateFile() with the FILE_FLAG_RANDOM_ACCESS flag set. Passing this flag to CreateFile causes the Cache Manager to keep previously viewed memory pages in the cache. When accessing files whose cumulative size exceeds the amount of physical memory, performance will suffer. See KB 2549369 for more information.
Network metrics
| WMI Class | Property name | Description | Metric Type |
|---|---|---|---|
| Win32_PerfFormattedData_Tcpip_NetworkInterface | BytesSentPersec BytesReceivedPersec | Network send/receive rate | Resource: Utilization |
| Win32_PerfFormattedData_Tcpip_TCPv4 | SegmentsRetransmittedPersec | IPv4 TCP retransmissions | Other |
BytesSentPersec and BytesReceivedPersec
Taken together, these two metrics measure the total network throughput of a given network interface. With most consumer hardware shipping with NICs capable of 1 gigabit per second or more, it is unlikely that the network would be a bottleneck in all but the most extreme cases. Microsoft documentation suggests that network saturation occurs when consuming more than 80 percent of the interface’s bandwidth, amounting to 100 megabytes per second for a 1-Gbps link.
Though unlikely to be the cause of performance issues, correlating network throughput with metrics from applications running on top of Windows (like IIS) could shed light on issues arising in those applications. In the event that you are saturating your network link, you may consider using a web cache for outbound traffic; otherwise you may need to increase your bandwidth (via your provider or through hardware upgrades).
SegmentsRetransmittedPersec
TCP retransmissions occur when a transmitted segment has not been acknowledged within the TCP timeout window, so the segment is re-sent.
TCP retransmissions occur frequently and are not errors, though their presence can be a sign of issues. Retransmissions are usually the result of network congestion, and most often are correlated with high bandwidth consumption. You should monitor this metric because excessive retransmissions could cause extensive delays in your applications. If the sender of the retransmits does not receive an acknowledgment of packets sent, it holds off on sending more packets (usually for about 1 second), adding delays that can compound congestion-related slowdowns.
If not caused by network congestion, the source of retransmits could be faulty network hardware. A low number of discarded packets in conjunction with a high rate of retransmissions could point to excessive buffering as the culprit. Whatever the cause, you should track this metric to shed light on seemingly-random fluctuations in network application response times.
Events
While performance counters provide a high-level overview of resource usage and performance, troubleshooting complex issues requires additional information on the sequence of events that occurred before or during the observed issue. By correlating performance counters with events from the Windows Event Log, metrics can be put in context with events across a network of hosts.
Windows Server 2012 has many event sources and, subsequently, many different event logs. (Our test environment, a fresh Windows Server 2012 installation on Microsoft Azure, had 245 separate event logs.) You can see the full list available on your system by navigating to the %SystemRoot%System32WinevtLogs directory. The event logs that are pertinent to you will depend on what you are using your server for (Active Directory Domain Controller, DNS server, etc.).
In addition to monitoring those event logs important to your use case, the Application (Application.evtx), System (System.evtx) and Security (Security.evtx) logs will provide useful information to most Windows administrators. Below we will break down several important events, categorized by event log, and classified by log level. See this reference for a list of all event properties.
- System Events
- Application Events
- Security Events
System events
| Event Log | Level | ID | Event Description | Source |
|---|---|---|---|---|
| System | Critical | 41 | Unexpected reboot | Kernel-Power |
| System | Error | 1001 | Server rebooting from BugCheck | BugCheck |
System EventID: 41
This system event is logged when a system fails to cleanly shut down before rebooting. Power loss, a crash, or hung operating system are all common causes. Unless otherwise configured, Windows will reboot when it blue screens, so you probably want to alert on this event. If you see this event occur along with System event 1001 (see below), you can be sure the reboot was caused by a blue screen.
System EventID: 1001
When a system blue screens, an event is written to the System log with more information on the cause of failure (returned as a hex value), as well as the location of the memory dump generated at the time of the failure. By default, Windows will reboot when it blue screens, which means you may not notice an error occurred without peering into the event logs.
Pinpointing the root cause of blue screens is very important—once one occurs, it is generally a sign of things to come. You definitely want to be aware of these events and should set an alert on their occurrence.
Application events
Application events give additional details on application failures and started services.
| Event Log | Level | ID | Event Description | Source |
|---|---|---|---|---|
| Application | Error | 1000 | App Error | Application Error |
| Application | Error | 1002 | App Hang | Application Hang |
Application EventID: 1000
Events in the Application event log with EventID 1000 indicate that an application error has occurred, which resulted in a crash. From time to time, core Windows applications and services may encounter errors and crash. This is not usually an issue; in most cases, Windows can restart the service and resume operation.
Because automatic restart is not always possible, however, you may want to alert on this event, depending on the application that crashed. If an application is continuously crashing, further investigation may be warranted.
Application EventID:1002
Hung applications occur when a user attempts to give input to a GUI, and the GUI does not update with the new input. Applications that repeatedly hang should be investigated; there could be an underlying issue causing the hang. An application suddenly and repeatedly hanging when it was previously working correctly can oftentimes be attributed to system changes, like a driver or firmware update. Correlating system changes with this event can shed light on the underlying causes of hung applications. Note that applications can only enter the hung state upon attempts at user interaction; Windows only becomes aware of a hung application when a user attempts to interact with it.
Important changes to users, groups, and other important features are logged to the Security Audit event log. Some of the more important events can be found below; for an exhaustive list of security audit events, see Microsoft’s documentation.
Should any of these events unexpectedly arise in the event log, swift action should be taken to verify the source of the changes and their legitimacy.
| Event Log | Level | ID | Event Description | Source |
|---|---|---|---|---|
| System | Information | 104 | Event log cleared | Microsoft-Windows-EventLog |
| Security | Information | 1102 | Audit log cleared | Microsoft-Windows-EventLog |
| System | Information | 4719 | System audit policy modified | Microsoft-Windows-EventLog |
| Security | Information | 4740 | User account locked | Microsoft-Windows-Security-Auditing |
| Security | Information | 4728, 4732, 4756 | User added to a security-enabled group | Microsoft-Windows-Security-Auditing |
| Security | Information | 4735 | Security-enabled group was modified | Microsoft-Windows-Security-Auditing |
| Security | Information | 4724 | Password reset attempt | Microsoft-Windows-Security-Auditing |
| Security | Information | 4625 | An account failed to logon | Microsoft-Windows-Security-Auditing |
| Security | Information | 4648 | A logon was attempted using explicit credentials | Microsoft-Windows-Security-Auditing |
Services
Monitoring Windows services serves two purposes: ensuring that essential services remain up, and enabling the discovery and disabling of non-essential services.
Windows services are long-running, (typically) background processes, similar to Unix-like daemons. The services you monitor depend on your use case and the specific role of the server in question. The list below provides a good starting point, containing a mix of essential and common services that are relatively role-neutral.
Most of the following services are essential to core Windows functionality. In part 2 of this series, we will explain how to use Windows-native tools to ensure that key services are up and running,
| Display Name | Service Name | Description (source) |
|---|---|---|
| Base Filtering Engine | BFE | Manages firewall and Internet Protocol security policies |
| Background Tasks Infrastructure Service | BrokerInfrastructure | Provides access control for background task execution |
| Cryptographic Services | CryptSvc | Provides three management services: Catalog Database Service, which verifies signatures of system files and new software; Protected Root Service, which controls Trusted Root Certification Authority certificates; and Automatic Root Certificate Update Service, which retrieves root certificates from Windows Update |
| DCOM Server Process Launcher | DcomLaunch | Launches Component Object Model (COM) and Distrbuted Component Object Model (DCOM) servers |
| Diagnostic Policy Service | DPS | Enables system diagnostics and issue resolution for Windows components |
| Windows Event Log | EventLog | Manages events and event logging. Supports logging, querying, subscribing to, and archiving of events |
| COM+ Event System | EventSystem | Supports System Event Notification Service (SENS), which provides automatic distribution of events to subscribing COM components |
| Group Policy Client | gpsvc | Applies settings configured by Group Policy |
| Windows Firewall | MpsSvc | Native firewall to prevent unauthorized network access |
| Performance Logs & Alerts | pla | Collects, logs, and alerts on performance data from local or remote computers |
| Task Scheduler | Schedule | Hosts system-critical scheduled tasks and enables user-configurable scheduled tasks |
| System Events Broker | SystemEventsBroker | Coordinates background work execution for WinRT applications |
| Remote Desktop Services | TermService | Allows remote users to connect interactively to the local machine |
| Windows Management Instrumentation | Winmgmt | Provides a standard interface for accessing management information from the operating system, devices, applications and services |
| Windows Remote Management (WS-Management) | WinRM | Provides remote access to Windows Management Instrumentation (WMI) data and enables event collection |
| WMI Performance Adapter | wmiApSrv | Provides performance library information from WMI providers |
Time to collect
In this post we’ve explored many of the key metrics and events you should monitor to keep tabs on the health and performance of your Windows 2012 servers.
Most of the metrics and events covered in this post should be relevant to general use. Given the number of roles a Windows server can perform, however, over time you will likely identify additional metrics that are particularly relevant to your workloads and users.
Read on for a comprehensive guide to collecting all of the metrics described in this article, using standard tools bundled with Windows Server 2012.
Hi all, Yesterday I posted a Step by Step on how Server Admin can configure Windows Server 2012 R2 Core in Domain environment.
Today I going to show you all a very simple step on how to Centralized Monitor member server in your Domain Infrastructure using Performance Monitor that available in Windows Server 2012 R2.
For those who’r not sure what is Performance Monitor all about, Windows Performance Monitor is a Microsoft Management Console (MMC) snap-in that provides tools for analysing system performance. From a single console, you can monitor application and hardware performance in real time, customize what data you want to collect in logs, define thresholds for alerts and automatic actions, generate reports, and view past performance data in a variety of ways.
Please refer here for more info : http://technet.microsoft.com/en-us/library/cc749249.aspx
For this Demo, I’m using my ComSys.local domain consist of 4 Servers which is 3 Servers running GUI and 1 Server core, all 4 Servers running on Windows Server 2012 R2. But for this Monitoring purposes, I will use ComSys SVR01 Server..
So.. lets get started…
1 – On the domain Server, in my case ComSys DC01 Server, open Server Manager and then Right Click All Servers and choose Add Servers..
** I wanted to make sure all my Server in my domain is on-line and to make sure the performance counter is started.

2 – On the Add Server box, Click Find Now button to detect all on-line server available… then Choose all the server you want to start the performance counter and click the Arrow button next to Operating System to add the Server..

3 – Verify the Server in the Selected box and click OK…

4 – Verify again that all the Server in your Infra is in the on-line Status..

5 – Next, Log in to your Server that you want to perform the monitoring, in my case I will use ComSys SVR01… On the Server Manager, Click Tools and then click Performance Monitor..

6 – On the Performance Monitor MMC, open Data Collector Sets, and then click User Defined… right click User Defined, click New, and then click Data Collector Set…

7 – Next, on the Create new Data Collector Set box, enter name that you prefer, for this demo I use ComSys SVR01 Server Monitoring and select Create manually (Advanced)… then click Next to proceed…

8 – Next, on the What type of data do you want to include? box, click Create data logs and then select the Performance Counter then click Finish…

9 – Next again, click Data Collector Sets, double click User Defined, right click ComSys SVR01 Server Monitoring and then click New and choose Data Collector…

10 – On the Create New Data Collector box… in the Name box, type Base ComSys Server01 Monitoring and select Performance counter data collector, then click next….

11 – On the Create New Data Collector box, click Add button…

12 – Next, In the Available counters object list, you can choose any counter that you prefer to monitor your Server, for this Demo I select Available Mbyes, Current Bandwidth and %Processor Time… then click OK…

13 – Next on the Create New Data Collector box, verify your selected Performance counter and click Finish.. You also can modify the Interval for Performance Counters (for this demo I remain the default 15 second)

14 – Now lets start the monitoring.. Right click ComSys SVR01 Server Monitoring and choose Start….

15 – Now you just wait for few minutes to let any activity running in your Server… then you can stop the monitoring…

16 – Lastly, double click Reports, expand the User Defined, then expand ComSys SVR01 Server Monitoring and click SVR01_ date to review your Monitoring Result/Report…

This post is part 3 of a 3-part series on monitoring health and performance of the Windows operating system. Part 1 details key Windows performance counters, events, and services to monitor; Part 2 details how to monitor Windows with a variety of native tools.
For complete infrastructural observability, you will need a dedicated system that allows you to store, visualize, and correlate your Windows Server 2012 metrics with the rest of your infrastructure, be it on-prem, in the cloud, or a hybrid of the two.
With Datadog, you can collect Windows metrics for visualization, alerting, and full-infrastructure correlation. Datadog will automatically collect the key metrics discussed in parts one and two of this series, and make them available in a customizable dashboard, as seen above.
Integrating Windows Server 2012 with Datadog
Install the Agent
The Datadog Agent is open source software that collects and reports metrics from your hosts so that you can view and monitor them in Datadog.
First, download the Datadog Agent installer for Windows. Next, double-click the installer and follow the prompts to install the Agent.
To install the Agent from the command line (to automate installation), open a command prompt (cmd.exe) in the directory you downloaded the installer and run the following command (you may need to run cmd.exe with elevated privileges):
msiexec /qn /i ddagent-cli.msi APIKEY="API_KEY"
substituting API_KEY with an API key from your account. You can optionally add a hostname and tags, with the HOSTNAME and TAGS arguments, respectively.
If you’re deploying the Agent on Azure, you can use the above method, or Azure specific instructions, to automatically monitor newly provisioned hosts.
Start the Agent
The Agent should start running as soon as it’s installed. If it didn’t, you can manually start the Agent from the Datadog Agent Manager shortcut in the Start Menu.
As soon as the Agent is up and running, you should see your host reporting metrics in your Datadog account.
Configure the Agent
Next you will need to enable the Windows integrations in the Agent. In the Datadog Agent Manager, select and enable the Win32 Event Log, Windows Service, and Wmi Check integrations.
Copy and verify configuration
Once you’ve enabled each integration, download the integration configurations from GitHub so you can begin collecting all of the metrics from part 1 of this series right away.
Copy and paste the new configurations into the corresponding integration pane. Make sure you press Save after pasting.
Last but not least, restart the Agent and check the Agent status to ensure that everything is working correctly.
Enable the integration in Datadog
Next, click the Windows Service and WMI Install Integration buttons inside your Datadog account, under the Configuration tabs in the Windows Service and WMI integration settings, respectively.
Customizing configuration
Over time, you may find that you want to monitor additional Windows Server metrics, not covered by the out-of-the-box configurations. All Datadog configuration is managed with YAML files (read a quickstart here).
Configuring additional metrics
To track more metrics than those covered in the basic configuration, in the Datadog Agent Manager, navigate to the Wmi Check integration configuration (or open the file directly at C:ProgramDataDatadogconf.dwmi_check.yaml).
For example, if you want to track a CPU counter, you would start by adding its class the bottom of the file:
- class: Win32_PerfFormattedData_PerfOS_Processor
Here, the class which contains the counter is Win32_PerfFormattedData_PerfOS_Processor. Most performance counters are located under classes which begin with Win32_PerfFormattedData_.
If you’re unsure of the class the performance counter is located in, you can use either Powershell or wbemtest for tracking down the class names and properties of the metrics you want to monitor.
Adding a new metric
To continue our example, we will add the Deferred Procedure Calls Queued per second metric to our WMI Check.
 - class: Win32_PerfFormattedData_PerfOS_Processor
    metrics:
      - [DPCsQueuedPersec, system.dpc.queue, gauge]
    tag_by: Name
The class matches the one found in wbemtest, DPCsQueuedPersec is the property we want to track, system.dpc.queue is how the name will appear in Datadog, and gauge is the metric type. The tag_by line indicates that the metric will be tagged with Name information (in this case, the processor number).
After saving your configuration, restart the Agent.
If you’re still having questions about configuring WMI metrics, check our Knowledge Base and documentation for articles which go a bit more in-depth than the above example.
Using wbemtest for metric classes and properties
A good tool to help find the names of metric classes is wbemtest.exe. Open it up from C:WindowsSystem32wbemwbemtest.exe.
Connect to the local host by clicking Connect, leaving the Namespace as rootcimv2, and clicking Connect once more.
Next, select Enum Classes, and in the popup, change the radio button to Recursive and click OK.
In the next window, navigate to the object for the metric you want and double-click it to open a window with all of its properties.
With both class name and property in hand, you can return to the WMI Check configuration and add in your values.
#### Using Powershell for metric classes and properties
You can also use Powershell to list all of the available WMI classes with the following line:
`Get-WmiObject -List`
and retrieve all of the properties of a class with:
Get-WmiObject -Query "select * from <CLASS>"
The following will show all properties of the Win32_PerfFormattedData_PerfOS_Processor class:
PS C:programdataDatadogconf.d> Get-WmiObject -Query "select * from Win32_PerfFormattedData_PerfOS_Processor"

__PATH                : \EVAN-SERVER2012rootcimv2:Win32_PerfFormattedData_PerfOS_Processor.Name="_Total"
C1TransitionsPersec   : 15
C2TransitionsPersec   : 50
C3TransitionsPersec   : 0
Caption               :
Description           :
DPCRate               : 0
DPCsQueuedPersec      : 7
Frequency_Object      :
Frequency_PerfTime    :
Frequency_Sys100NS    :
InterruptsPersec      : 93
Name                  : _Total
PercentC1Time         : 20
PercentC2Time         : 75
PercentC3Time         : 0
PercentDPCTime        : 0
PercentIdleTime       : 96
PercentInterruptTime  : 0
PercentPrivilegedTime : 0
PercentProcessorTime  : 0
PercentUserTime       : 0
Timestamp_Object      :
Timestamp_PerfTime    :
Timestamp_Sys100NS    :
PSComputerName        : EVAN-SERVER2012
Configuring additional events
You can customize the Windows Event Log integration to collect information from any event log on your local or remote system. Start by navigating to the Win32 Event Log pane in the Datadog Agent Manager or opening the configuration file directly at C:ProgramDataDatadogconf.dwin32_event_log.yaml.
The event log integration configuration follows this format:
  - log_file:
      - System
    type:
      - Error
    tags:
      - system
where:
log_fileis either:Application,System,Setup, orSecuritytypeis one of:Critical,Error,Warning,Information,Audit Success,Audit Failuretagsare any tags you’d like to add to the event
After saving your configuration, restart the Agent.
Configuring additional services
You can customize the Windows Service integration to collect information about any local or remote service. Start by navigating to the Windows Service pane in the Datadog Agent Manager or opening the configuration file directly at C:ProgramDataDatadogconf.dwindows_service.yaml.
First, find the short name (also referred to as «Service name» in contrast with the human-readable «Display name») of the service you want to monitor by opening the Service management snap-in services.msc. Next, find the name of the service, right-click, and select Properties. In the popup, you will find the short name listed as the Service name.
Add a dash and the short name of the service you want to monitor below the services: line, like so:
    -   host: . # "." means the current host
        services:
          - wmiApSrv
          - LSM
          - Win32Time
After saving your configuration, restart the Agent.
Show me the servers!
Once the Agent begins reporting metrics, events, and services, you will see a comprehensive Windows dashboard among your list of available dashboards in Datadog. The default Windows dashboard, as seen at the top of this article, displays all of the key metrics highlighted in our introduction on how to monitor Windows.
You can easily create a more comprehensive dashboard to monitor your entire web stack by adding additional graphs and metrics from your other systems. For example, you might want to graph metrics alongside metrics from Kafka, or alongside host-level metrics such as memory usage on application servers.
To start building a custom dashboard, clone the default Windows dashboard by clicking on the gear on the upper right of the dashboard and selecting Clone Dash.
Alerts
Once Datadog is capturing and visualizing your metrics, you will likely want to set up some alerts to be automatically notified of potential issues. With our powerful outlier detection feature, you can get automatically alerted on strange server behavior. For example, you can set an alert if a particular host is experiencing an increase in latency while the others are operating normally.
Datadog can monitor individual hosts, containers, virtual machines, services, processes—or virtually any combination thereof. For instance, you can view all of your Windows hosts, SQL servers, Active Directory controllers, or all hosts in a certain availability zone or resource group, or even a single metric being reported by all hosts with a specific tag.
Conclusion
In this post we’ve walked you through integrating Windows Server 2012 with Datadog to visualize your key metrics and notify the right team whenever your infrastructure shows signs of trouble.
If you’ve followed along using your own Datadog account, you should now have increased the observability of your environment, as well as the ability to create automated alerts tailored to your infrastructure, your usage patterns, and the metrics that are most valuable to your organization.
If you don’t yet have a Datadog account, you can sign up for a free trial and start to monitor Windows Server 2012 today.
[]: imgs
[]: blog
I have a lab environment of 5 machines, one AD/DNS/Manager and 4 Hyper-V virtual machines. I want to be able to monitor the performance of the various hosts under different conditions to see where I’ve run out of resources.
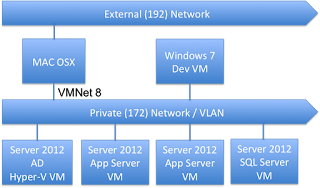
There are two major components to the monitoring. The first is the performance counters on each monitored machine. These act as the source of performance information. The second is a monitoring console. That console can either be one that displays all information or can be one that displays information only when performance numbers fall outside some criteria.
Windows Server Manager Performance View
The Windows Server Manager displays performance information for out-of-bounds situations where the values coming off of a machine are outside of some specified range. Server Manager monitors as many machines as you want from its’ All Servers page.
Select the servers that you want to monitor in the Servers pane of any non-dashboard screen in Server Manager. We see a «Performance counters not started» message in the screen below. We will have to start the counters on each machine we wish to monitor to get any performance information.
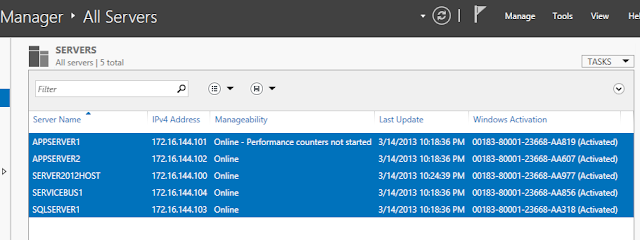
The selected servers appear in the Performance pane on the same page. Scroll down to the Performance area on any of the non-dashboard screens. Right mouse on any server where the Counter Status is Off and select Start Performance Counters. Their status should change from «Off» to «On — Waiting for data». Data should show up after some period of time.

Note: I actually had to restart my hyper-v server (the whole virtual lab) before I actually saw any counters gathered.
Seeing Out of Bounds Conditions
This screen shows any «out of bounds» conditions detected. (It really only supports memory and CPU). The following screen image shows an «alert situation» has occurred on my SERVER2012HOST machine.
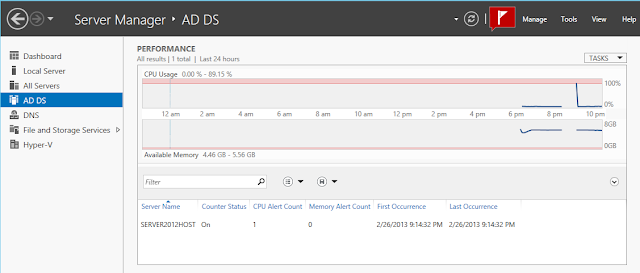
Performance Monitor Program (Immediate)
Realtime Remote Counter Collection and Display
The Performance Monitor program can be used to plot mixed sets of performance counters (metrics) from multiple machines in real-time. You can find it via the Server Manager Tools—>Performance Monitor menu item. The Performance Monitor user interface updates selected counters (metrics) on regular intervals.

Data can be gathered as part of a reusable Collector Set for later display or gathered for immediate display in the UI.
Adding Counters to the Performance Monitor
You add performance counters to the display by clicking on the green plus sin in the right hand pane. That will bring up the Add Counters panel. The machine selector «Select counters from computer» defaults to the local machine. Performance counters like resources with multiple units offer the option of all or individual instances. In the case of processors this would be all of the cores or only a select sub-set. Select the desired counter and instances and click on the Add>> button and then OK. The graph will immediately start updating with the newly configured counters.
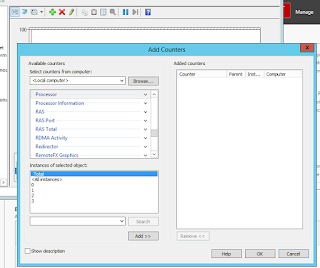
Troubleshooting the Instances List
Sometimes the Instances list in the lower left will remain empty when a counter is selected in the middle left hand panel. You can usually just select a different counter and then re-select the one you want to get the instances list to refresh.
Adding Counters from a remote machine
You can select or Browse… any of the machines on your network that have enabled remote performance counter collection.
- Click on the Browse… button on the Select Computer panel. Enter the remote server name in the «object name» panel and click Check Names. Click on OK when it reformats the name.
- You will be returned to the Add Counters panel with you the just selected computer name in the drop list. I had to prefix this with \<server_name> to get this to work.
- Select the metric you want from the Add and wait until the Instances of selected object: is updated. It usually defaults to _Total or All instances.
- Click on the Add>> button to put the new counter in the Added Counters pane on the right hand side
- Click OK.
- The graph should automatically update the same it did with the local example above.


Troubleshooting Stuck «Waiting on Data».
I found that my «Performance» pane never updated for newly added servers. I had to enable a firewall exception on each remote machine so I could gather statistics. Run the following command on each remote machine. I did this by opening up a remote command window using Windows Powershell menu item available when you right mouse on a server in the All Servers view.
netsh advfirewall firewall set rule group=»Performance Logs and Alerts» new enable=yes
You should see a message «Updated 4 rule(s)»
Performance Monitor Program (Ongoing)
The Performance Monitor program can be used to gather information either in an ongoing basis or while profiling or testing some application or configuration. You should remember that the performance counters can use a lot of disk space if left running. The usual order of operations for a test scenario is.
- Start collection on a data set
- Run some test program that generates traffic
- End the collection for that data set
- Open the resulting performance monitor files
Gathering Performance Data from Multiple Hosts

 Performance Monitor can collect performance counters from remote machines and store them to a local disk for later analysis. It does this through the Data Collector Sets. You’ll want to create a new Data Collector set in Performance Monitor by using the popup menu under Performance—> Data Collector Sets —> User Defined. The «template» collector sets only apply to the local machine. Chose to Create Manually on the first Create new Data Collector Set panel.

Then pick the data you are interested in on theCreate new Data Collector Set panel. Select Performance Counter. I have System configuration information selected for some other task I was working on when I created the screen-shot.

You will then be asked which performance counters you wish to collect. Click on the Add… button.
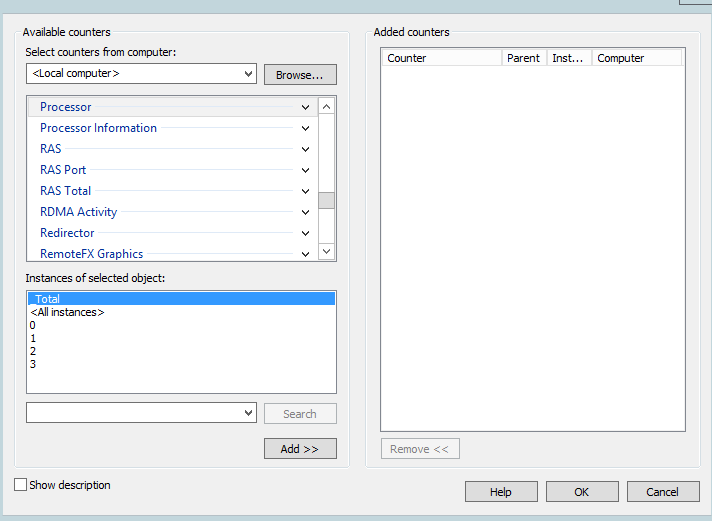
Select the computer from the drop list and then select the metrics you want.
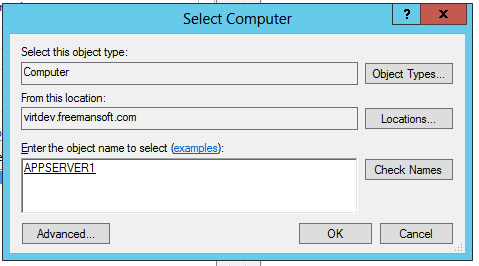
You can use the Browse… button to find the machine. I just type in the server name and click on Check Names to verify I typed it right. Click OK.
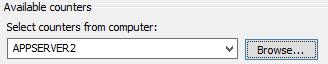 The server name will show up in the computer field without the «\» in front of it.
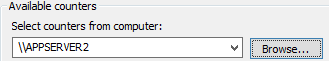
Enter the back slashes in front. You should see the counter list refresh.Selecting monitors without the «\» in front of the machine name always causes the monitors to get added without a computer name.
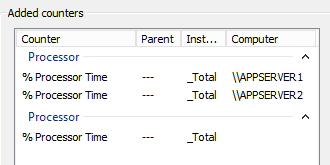
Select the performance counters you want and add them. They should show up with the appropriate machine names in the Computer column. You can add monitors from as many machines as you want.
This shows the «% Processor Time» counter for three machines including the machine I’m running the Performance Monitor application on.
 Advance through the modal panels until you find the one that asks who the data set should be «Run as:». You must pick a user to run the collectors under. I’m totally lazy in my private test lap and pick administrator.
This completes setting up the monitors. You can see them listed in the User Defined section of the Data Collection Sets portion of the left hand pane of the Performance Monitor program.
Starting the Data Collection Set
Start data collection by highlighting the collection set and then clicking the green play button (why isn’t it a red record circle?) in the upper portion of the screen. Press the black square to stop collection.
Viewing the Collected Performance Data.
Find the captured performance information and double click on the Performance Monitor Data file. You can find the location of a Data Collector’s captured performance information in the right hand pane of the Performance Monitor program after you’ve highlighted the appropriate Data Collector Set in the left hand pane.