Популярные инструменты для Windows, macOS и Linux.

В каждой ОС есть встроенные утилиты вроде «Мониторинга системы» или «Диспетчера задач», которые позволяют отслеживать загрузку процессора, количество свободной оперативной памяти, сетевой трафик и другие параметры.
Они отлично подойдут для разового использования. Но если вам нужно часто отслеживать подобную информацию или вы хотите получить более расширенные данные — лучше воспользоваться специализированными инструментами.
1. Open Hardware Monitor
- Поддерживаемые платформы: Windows.
- Цена: бесплатно.
Удобная утилита для отслеживания температуры процессора и видеокарты, скорости вентиляторов, напряжения батареи, а также других сенсоров. Помимо параметров оборудования, Open Hardware Monitor умеет следить за потреблением ресурсов. Информацию можно просматривать не только в окне приложения, но и через аккуратный виджет, плавающие графики или в трее на панели задач.
Скачать с официального сайта →
2. CPUID HWMonitor
- Поддерживаемые платформы: Windows.
- Цена: бесплатно.
Ещё одна программа для мониторинга показаний сенсоров с большой базой оборудования, которую разработчики всегда поддерживают в актуальном состоянии. Датчики сгруппированы по типу и наглядно отображаются в главном окне. Наиболее востребованные параметры при желании можно вывести на панель задач и настроить их внешний вид.
Скачать с официального сайта →
3. Rainmeter
- Поддерживаемые платформы: Windows.
- Цена: бесплатно.
Мощный инструмент для кастомизации рабочего стола с открытым исходным кодом. Rainmeter поддерживает огромное количество пользовательских скинов, которые не только меняют внешний вид Windows, но и позволяют просматривать разнообразную системную информацию.
В приятных виджетах на рабочем столе отображается загрузка процессора, использование памяти и дискового процессора, а также данные сенсоров оборудования в зависимости от выбранной темы.
Скачать с официального сайта →
- Поддерживаемые платформы: macOS.
- Цена: 12 долларов.
Одна из самых продвинутых утилит для мониторинга, которая отображает любые параметры компьютера и дополнительные данные, вроде календаря или погоды. iStat Menus отличается невероятным количеством настроек и продуманным интерфейсом.
Краткую информацию можно просматривать в статусной строке macOS, а более подробную — в выпадающем меню. Причём в последнем случае она подаётся порционно: при наведении на любой параметр раскрываются детальные данные, которые, в свою очередь, тоже разворачиваются в ещё более подробный отчёт.
Скачать с официального сайта →
- Поддерживаемые платформы: macOS.
- Цена: 449 рублей.
Ещё один мощный инструмент для всестороннего отслеживания системных ресурсов и информации с датчиков внутренних компонентов. Процессор, память, диск, сеть, батарея, Bluetooth, температура — всё это будет у вас перед глазами в строке меню.
Нажатие на иконку одного из параметров откроет окошко с подробной статистикой. Последнюю можно просматривать в виде комбинированной сводки по всем данным или отдельно по каждому из элементов.
Скачать с официального сайта →
6. Stats
- Поддерживаемые платформы: macOS.
- Цена: бесплатно.
Полностью бесплатная альтернатива двум предыдущим приложениям, не уступающая им по возможностям. Stats очень похож на iStat Menus как по функциям, так и по дизайну. Самые важные показатели отображаются в строке меню, а подробная статистика по каждому из них — в небольшом окошке по клику. Любой из элементов легко настраивается, а для максимально гармоничного встраивания в систему реализована поддержка тёмной темы оформления.
Скачать с официального сайта →
7. Conky
- Поддерживаемые платформы: Linux.
- Цена: бесплатно.
Один из самых популярных инструментов для системного мониторинга в Linux, который умеет выводить на рабочий стол практически любую информацию: от количества памяти и температуры процессора до погоды и играющего в плеере трека.
Conky очень гибко настраивается до мельчайших деталей. Правда, делается это через конфигурационный файл. Но это не проблема, поскольку в Сети можно найти множество уже настроенных виджетов на любой вкус.
Скачать с официального сайта →
8. Bashtop
- Поддерживаемые платформы: Linux.
- Цена: бесплатно.
Ещё более функциональная утилита с огромными возможностями мониторинга и настройки. Bashtop работает внутри терминала и понравится всем, кто любит консоль и проводит там много времени. Несмотря на ограничения текстового интерфейса, программа имеет довольно симпатичный внешний вид и наглядно отображает массу параметров.
Скачать с официального сайта →
9. Stacer
- Поддерживаемые платформы: Linux.
- Цена: бесплатно.
Полезное приложение для оптимизации и настройки различных системных данных, которое в числе прочего предлагает и базовые возможности для мониторинга. На главном экране отображается конфигурация ПК, а также ключевые характеристики вроде памяти и процессора. Дополнительно можно вывести графики использования ресурсов в режиме реального времени и настроить их.
Скачать с официального сайта →
Читайте также 🧐
- Как установить SSD в ноутбук или стационарный ПК
- Как установить Linux: подробнейшая инструкция
- 12 программ на Windows 10, которые вы должны удалить прямо сейчас
- Как переустановить macOS
- 14 лучших программ для оптимизации Windows 10
Этот материал написан посетителем сайта, и за него начислено вознаграждение.
Купив первый ПК почти 20 лет назад, я долгое время не задумывался о том, в каких режимах работают его комплектующие и просто играл на нем в игры, смотрел фильмы и слушал музыку. В те времена процессоры и видеокарты в большинстве своем не переваливали за порог энергопотребления в 50 ватт и мало кто из обычных пользователей задумывался об их температуре или оборотах вентиляторов. А первый раз я столкнулся с перегревом процессора спустя пару лет, после неудачного апгрейда на Athlon XP.

После холодного Pentium III Athlon XP превратил мой компьютер в печку, у которой перегревалась даже верхняя крышка корпуса. В то время мало кто задумывался о дополнительной вентиляции и с вытяжкой нагретого воздуха справлялся вентилятор в блоке питания. После установки дополнительно вентилятора в корпус и замены процессорного кулера на более мощный мне удалось снизить температуру процессора, а в мой набор программ для постоянной установки на ПК добавилась утилита MSI Core Center, с помощью которой можно было не только мониторить температуры, напряжения и частоты процессора и материнской платы, но и разгонять процессор прямо из-под Windows.
рекомендации
3070 Gigabyte Gaming за 50 тр с началом
Выбираем игровой ноут: на что смотреть, на чем сэкономить
3070 Gainward Phantom дешевле 50 тр
13700K дешевле 40 тр в Регарде
Ищем PHP-программиста для апгрейда конфы
3070 дешевле 50 тр в Ситилинке
MSI 3050 за 25 тр в Ситилинке
3060 Gigabyte Gaming за 30 тр с началом
13600K дешевле 30 тр в Регарде
4080 почти за 100тр — дешевле чем по курсу 60
12900K за 40тр с началом в Ситилинке
RTX 4090 за 140 тр в Регарде
Компьютеры от 10 тр в Ситилинке
3060 Ti Gigabyte за 42 тр в Регарде

После покупки видеокарты ATI Radeon 9600 PRO в мой набор добавилась удобная утилита PowerStrip, с помощью которой можно было разгонять не только видеокарту, но и развертку ЭЛТ-монитора, а потом и очень удобная утилита ATI Tray Tools с помощью которой можно было делать с видеокартой и монитором все, что только возможно. С тех пор мой набор утилит для мониторинга, настройки, разгона и стресс-тестов «железа» ПК рос и обновлялся и в этом блоге я хочу рассказать вам о 10 актуальных, проверенных и полезных утилитах, которыми я постоянно пользуюсь.

MSI Afterburner

MSI Afterburner давно стала одной из главных утилит на моем ПК, и я не представляю себе использование видеокарты без этой утилиты. MSI Afterburner у меня делает очень многое: обеспечивает работу видеокарты в режиме андервольтинга, запускает настроенный профиль работы вентиляторов, дающий лучшее соотношение шум/температуры, чем заводской. Еще с помощью MSI Afterburner я делаю скриншоты в играх и записываю игровое видео на видеокартах, не поддерживающих функцию Nvidia GeForce ShadowPlay, например, GeForce GT 1030. И красный значок MSI Afterburner с температурами видеокарты постоянно висит в области уведомлений уже много лет.
Ссылка на сайт разработчика.
HWiNFO

Вместе с MSI Afterburner в области уведомлений у меня давно прописался значок еще одной популярной утилиты для мониторинга практически любых параметров комплектующих — HWiNFO. Эта небольшая и компактная утилита покажет вам абсолютно все, от температур и напряжений процессора, до текущей скорости передачи данных в накопителях или сетевой карты. Очень удобно то, что любые показатели HWiNFO можно посмотреть в виде графиков или вывести в оверлей поверх игры с помощью MSI Afterburner.
Ссылка на сайт разработчика.
AIDA64

А вот AIDA64 — это программа тяжеловес, которая обеспечивает не только мониторинг любых показателей, но и предлагает множество тестов для процессора, ОЗУ и видеокарты, в том числе и стресс-тесты стабильности. Одна из самых удобных функций AIDA64 — создание отчета, в котором будет буквально все об исследуемом ПК.
Ссылка на сайт разработчика.
CPU-Z и GPU-Z
![]()
Казалось бы, если у нас есть три утилиты, описанные выше, то для мониторинга больше ничего не понадобится, однако парочка похожих простых утилит CPU-Z и GPU-Z всегда стоит на моем ПК, как и на ПК многих оверклокеров. Главный плюс CPU-Z и GPU-Z в компактном и наглядном выводе информации о процессоре и видеокарте, которую удобно воспринимать на скриншотах, например, при запущенном стресс-тесте. Поэтому, несмотря на то, что на ПК оверклокеров достаточно и других утилит мониторинга, CPU-Z и GPU-Z не теряют популярности.
Ссылка на сайт разработчика CPU-Z.
Ссылка на сайт разработчика GPU-Z.
HD Tune

Точно также для работы с жесткими дисками и SSD-накопителями я до сих пор использую старую утилиту HD Tune, которую не променяю на более популярную CrystalDiskMark именно из-за удобного и наглядного вывода информации в виде графиков. Помимо тестов скорости и мониторинга накопителей HD Tune позволяет сделать полное стирание информации с диска и протестировать его поверхность на битые сектора.
Ссылка на сайт разработчика.
OCCT

Мой процессор AMD Ryzen 5 1600 AF и ОЗУ работают в разгоне и несколько месяцев назад я заметил признаки деградации, когда процессор перестает держать ранее стабильный разгон. Я снизил напряжение на ядрах процессора и его контролере памяти, что позволило не отказываться от разгона полностью и периодически проверяю его на стабильность. Использую я для этого утилиту OCCT, которая дает на процессор более сильную нагрузку, чем стресс-тесты AIDA64, но меньшую, чем Linpack, и за счет этого стала для меня лучшей утилитой проверки разгона на стабильность.
Ссылка на сайт разработчика.
Unigine Superposition

Я предпочитаю не давать запредельные нагрузки не только на процессор, но и на видеокарту, поэтому практически не пользуюсь популярной утилитой-«грелкой» FurMark. Вместо нее я использую утилиту Unigine Superposition, дающую на видеокарту стабильную нагрузку, превышающую ту, что дают игры, и позволяющую найти нестабильность в разгоне или андервольте. Не стоит забывать и то, что Unigine Superposition — это неплохой бенчмарк производительности видеокарты.
Ссылка на сайт разработчика.
3DMark

Традиционно для тестов видеокарты мной используются и актуальные версии утилиты 3DMark, а еще с помощью теста стабильности 3DMark легко проверить разгон и андервольт на стабильность. Но я не забываю и старые версии 3DMark, например, 3DMark 11, ведь с его помощью легко сравнить производительность новой видеокарты с теми, что были у вас раньше. Или производительность новых бюджетных видеокарт с мощными моделями прошлых поколений.
Ссылка на сайт разработчика.
Display Driver Uninstaller

Несмотря на то, что современные драйвера видеокарт заметно отличаются в стабильности в лучшую сторону от тех, что были в прошлом, ошибки при их удалении все еще встречаются, о чем я частенько читаю на форумах. Да и сам пару раз за последние годы я сталкивался с некорректно работой драйвера видеокарты после обычного удаления и установки нового. Поэтому я вывел для себя правило, при установке нового драйвера видеокарты всегда удалять старый при помощи утилиты Display Driver Uninstaller, которая тщательно вычищает все остатки старых драйверов. Это занимает две-три минуты, но зато можно быть уверенным, что новому драйверу ничего не будет мешать.
Ссылка на сайт разработчика.
Итоги

Вот такие утилиты всегда установлены на моем ПК, некоторые из которых я использую уже более 10 лет. Несмотря на то, что вес некоторых из них, например, 3DMark, заметно растет со временем и выходом новых версий, все эти утилиты прекрасно умещаются вместе в Windows на мой старый SSD объемом 120 ГБ, который я использую как системный. Несмотря на то, что SSD такого объема стали активно покупаться пользователями еще 10 лет назад, они до сих пор популярны и в Ситилинке чаще всего покупают три модели SSD объемом 120-128 ГБ: Silicon Power Ace A55, Patriot Burst Elite и Digma Run Y2.

Этот материал написан посетителем сайта, и за него начислено вознаграждение.
Подборка бесплатных программ для управления и диагностики процессов операционной системы. Данные утилиты являются продвинутыми аналогами диспетчера задач, встроенного в Windows. С помощью этих инструментов можно контролировать активные процессы и службы в системе: останавливать ненужные, запрещать запуск, скрывать от видимости и многое другое.
Process Hacker 2.39

Многофункциональная утилита для мониторинга системных служб и процессов в Windows.
XP / Vista / 7 / 8 / 10 (32bit / 64bit)
AnVir Task Manager 8.6.7
![]()
Мощный инструмент для управления системными процессами и службами (сервисами) Windows. Позволяет редактирование список автозагрузки процессов и приложений используя пояснительную информацию из базы данных (80000 описаний).
XP / Vista / 7 / 8 / 10 (32bit / 64bit)
Process Lasso 9.0.0.298
![]()
Process Lasso — мощная программа углубленного контроля над активными процессами операционной системы Windows. Позволяет работать в ручном и автоматическом режиме. В автоматическом используются заранее подготовленные фильтры разрешенных и запрещенных процессов.
XP / Vista / 7 / 8 / 10 (32bit / 64bit)
Process Explorer 16.20
![]()
Process Explorer — Утилита мониторинга и управления активными процессами Windows. Отображает данные о загрузке системных ресурсов и предлагает ряд действий их корректного высвобождения.
XP / Vista / 7 / 8 / 10 (32bit / 64bit)
Bill2’s Process Manager 3.4.4.0
![]()
Bill2’s Process Manager — утилита позволяющая задавать приоритеты процессам Windows. Назначеные парметры очери процессу можно сохранить и указать выполнение на соответствующих ядрах процессора.
XP / Vista / 7 / 8 (32bit / 64bit)
Содержание
- Способ 1: «Диспетчер задач»
- Способ 2: «PowerShell»
- Способ 3: «Командная строка»
- Способ 4: Сторонние приложения
- Вопросы и ответы
Способ 1: «Диспетчер задач»
Для просмотра процессов и управления ими в Windows 10 предусмотрено штатное приложение «Диспетчер задач». Его использование является самым простым, удобным и наглядным способом получения сведений о запущенных в системе системных и сторонних процессов.
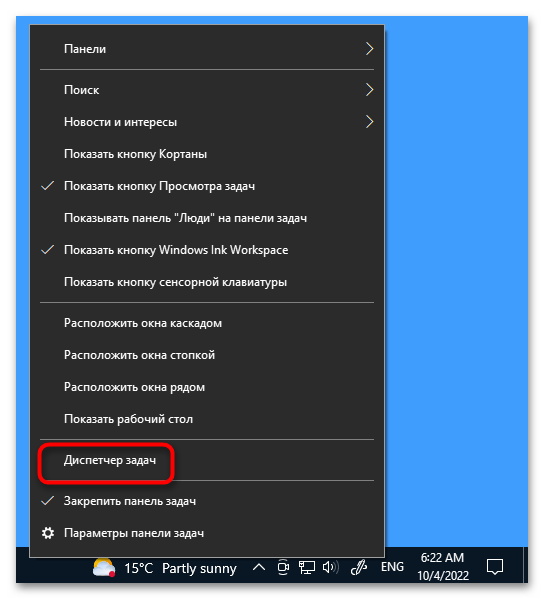
- Откройте «Диспетчер задач» из контекстного меню «Панели задач» или любым другим удобным вам способом.
Подробнее: Способы открыть «Диспетчер задач» в Windows 10
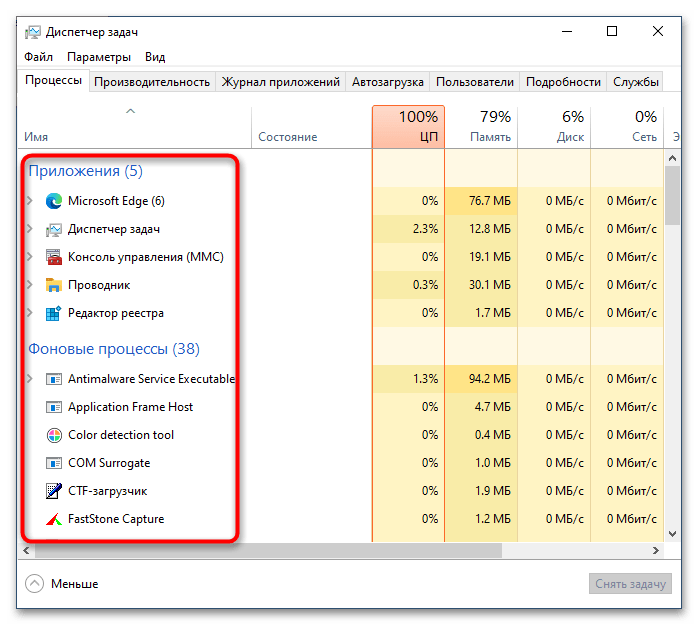
- Список процессов, а если точнее, их названий, доступен для просмотра в одноименной вкладке: в ней будет указан уровень загрузки ЦП, ОЗУ, диска и сети для каждого процесса.
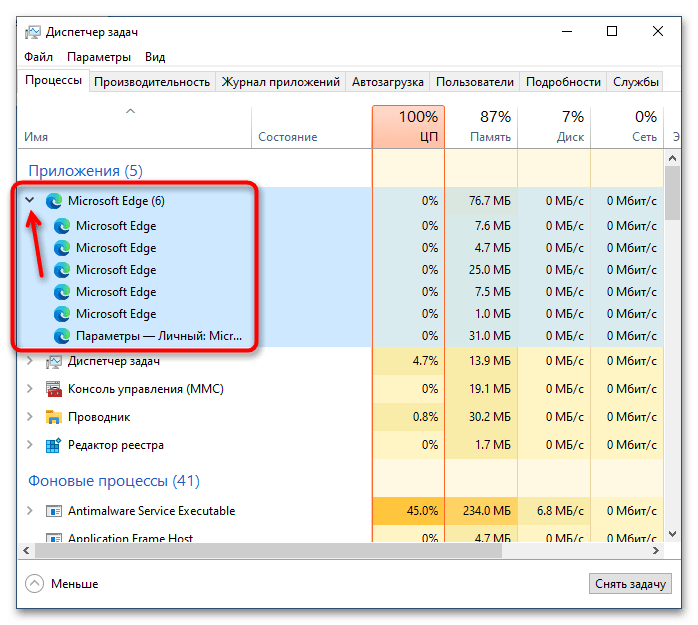
- Если слева от имени процесса располагается импровизированная стрелка, значит, процесс содержит один и более подпроцессов. Кликните по стрелке, чтобы просмотреть подпроцессы.
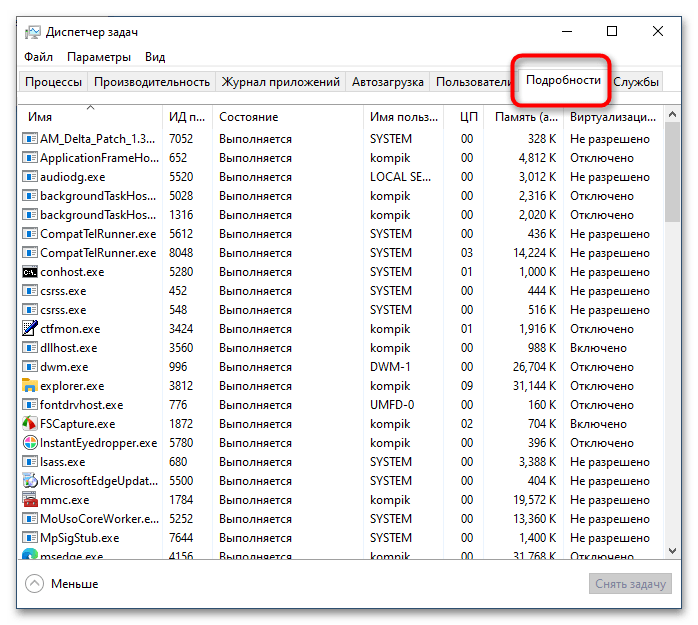
Просмотреть процессы в «Диспетчере задач» можно также на вкладке «Подробности». Здесь, помимо исполняемого файла процесса, для просмотра доступны такие данные, как его идентификатор, состояние, владелец, используемый объем памяти и название.
Способ 2: «PowerShell»
Вывести список запущенных процессов можно также с помощью консоли «PowerShell». Способ хорош тем, что позволяет получать дополнительные данные о процессах и гибко сортировать их при необходимости.
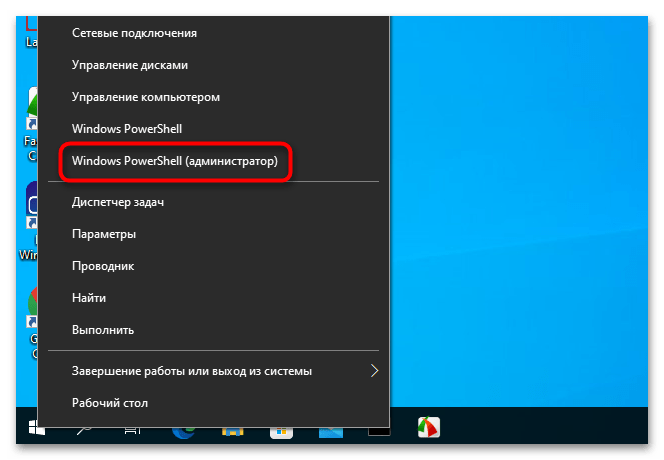
- Откройте консоль «PowerShell» от имени администратора из контекстного меню кнопки «Пуск».
- Введите в консоли команду
Get-Processи нажмите клавишу ввода.
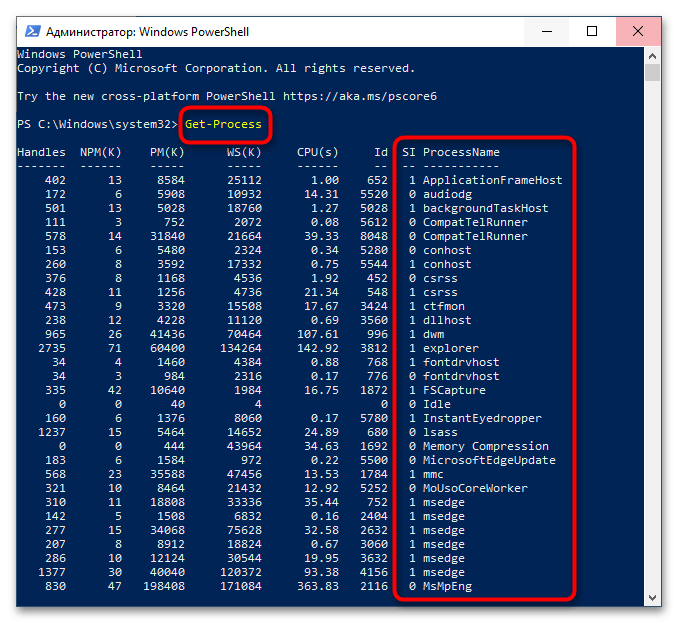
В результате вы получите список процессов с указанием таких свойств, как количество дескрипторов ввода («Handles»), выгружаемый и невыгружаемый размер данных процесса «(PM(K) и NPM(K))», объем используемой процессом памяти («WS(K)»), процессорное время («CPU(s)») и идентификатор («ID»). Имя процесса будет указано в столбце «ProcessName».
Способ 3: «Командная строка»
Для получения списка процессов сгодится и классическая «Командная строка», однако в этом случае вы получите несколько меньший объем свойств процессов.
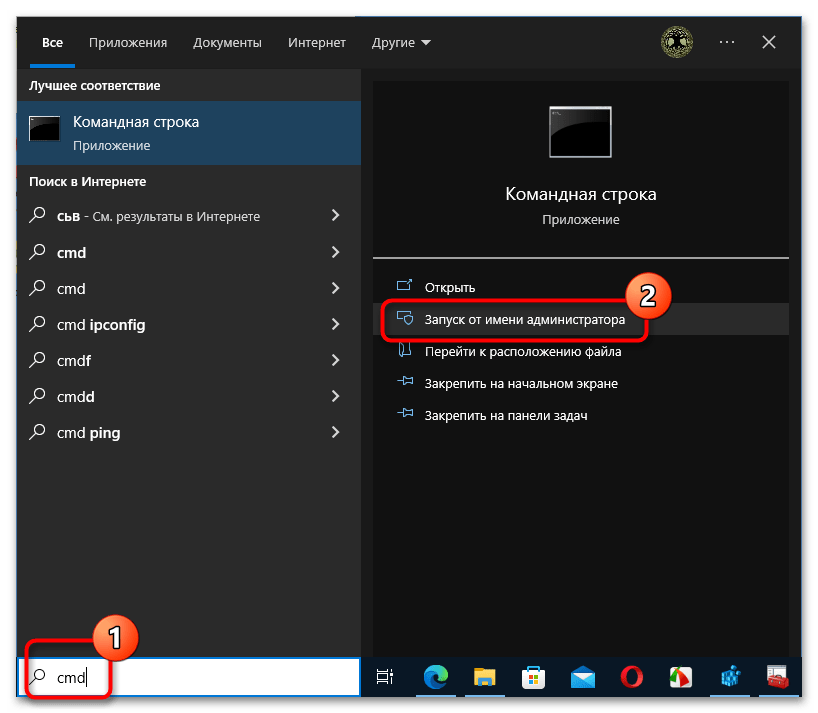
- Откройте «Командную строку» от имени администратора через поиск или другим известным вам методом.
Подробнее: Открытие «Командной строки» в Windows 10
- Выполните команду
tasklist.
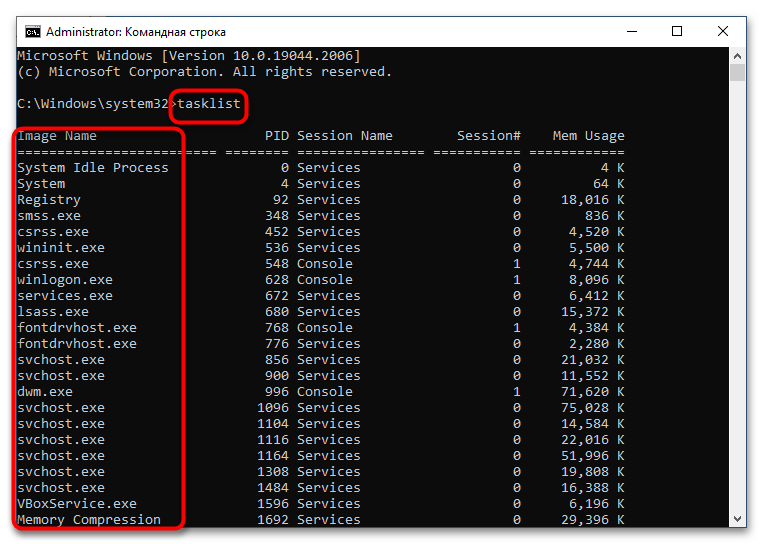
В результате, помимо названий процессов, вы получите следующие сведения: идентификаторы, имя сессии, номер сеанса и объем ОЗУ, потребляемый каждым процессом.
Способ 4: Сторонние приложения
Если вы хотите получить о запущенных процессах максимум деталей, лучше использовать специализированные сторонние программы, например Process Explorer — мощный бесплатный инструмент управления процессами.
Скачать Process Explorer с официального сайта
- Скачайте исполняемый файл утилиты procexp.exe или procexp64.exe и запустите.
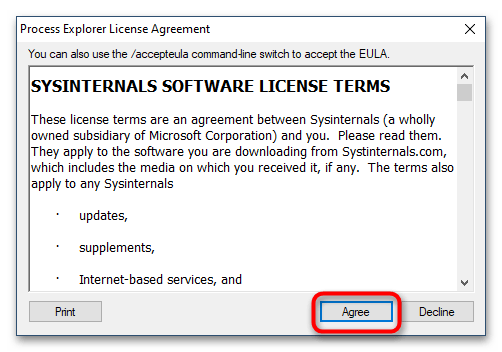
- Если до этого программа никогда не запускалась, вам будет предложено принять лицензионное соглашение.
- В результате в левой колонке приложения будет выведен список всех запущенных на компьютере процессов. Если нужно просмотреть свойства процесса, кликните по нему два раза мышкой.
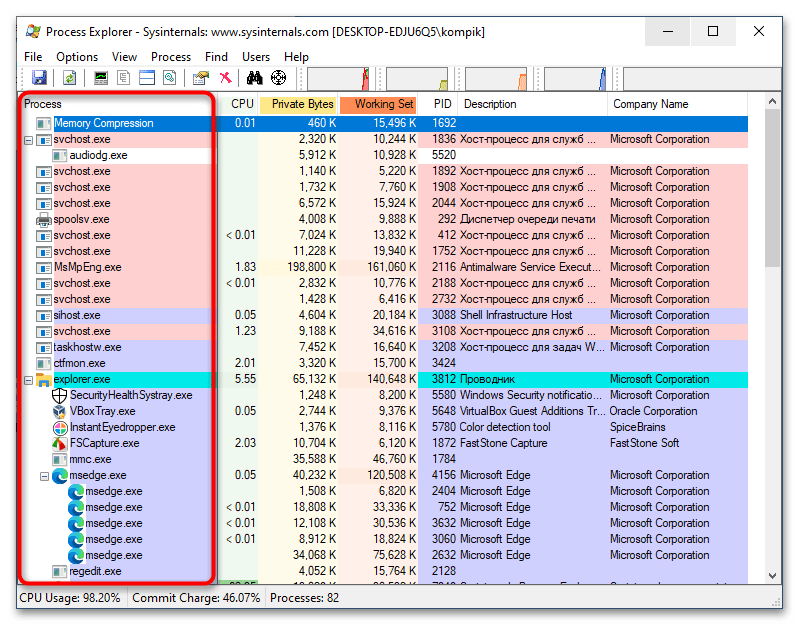
Одним лишь просмотром процессов и их свойств возможности Process Explorer не ограничиваются. С помощью этой небольшой портативной программы вы можете принудительно завершать работу процессов, изменять их приоритет, создавать дампы памяти, выявлять связанные динамические библиотеки, а также выполнять другие операции.

Еще статьи по данной теме:
Помогла ли Вам статья?
Process Explorer
для Windows

Process Explorer — мощная утилита для отслеживания в режиме реального времени запущенных в системе процессов. Показывает подробнейшую информацию о всех процессах, включая использование памяти, задействованных DLL библиотеках и многое другое.
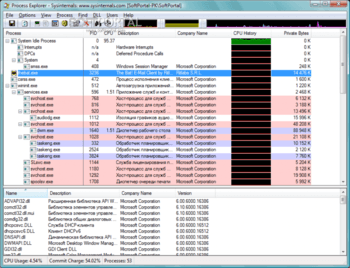
Рабочая область программы состоит из двух окон. В верхнем окошке отображается список текущих активных процессов, включая имена учетных записей, которым принадлежат эти процессы. Нижнее окошко, в зависимости от выбранного режима, может показывать различную дополнительную информацию. В первом случае (режим обработки) вы увидите все открытые дескрипторы выбранного в верхнем окне процесса, а в режиме библиотек DLL — все загруженные процессом динамические библиотеки и отображенные в память файлы.
Помимо этого, программа обладает мощными возможностями поиска, благодаря которым можно быстро узнать, у какого процесса открыт определенный дескриптор или загружена определенная библиотека DLL.
Process Explorer будет весьма полезна для разрешения проблем с версиями библиотек DLL и обнаружения утечек памяти.
![]()
Что нового в Process Explorer 17.02?
- Исправлены ошибки.
ТОП-сегодня раздела «Мониторинг»
![]() MSI Afterburner 4.6.4
MSI Afterburner 4.6.4
MSI Afterburner — настоящая находка для истинного оверклокера, с помощью которой можно…
![]() SpeedFan 4.52
SpeedFan 4.52
SpeedFan — бесплатный и удобный в использовании инструмент для контроля за температурой и…
![]() Speccy 1.32.803
Speccy 1.32.803
Speccy — небольшая бесплатная программа, позволяющая узнать массу полезной информации об…
![]() FPS Monitor 5440
FPS Monitor 5440
Приложение отслеживает состояние компонентов ПК и отображает информацию поверх экрана…
Отзывы о программе Process Explorer
Валерка про Process Explorer 16.32 [01-05-2021]
Крутая прога только хакеры умнее обходят ну и ладно снесу винду может и буду следить за подозрительными процессами
3 | 3 | Ответить
Михась про Process Explorer 16.30 [10-01-2020]
По умолчанию сниффера не отображаются. Нужно кликнуть ПКМ на любом столбце,колонке выбрать SELECT COLUMNS найти среди корешков ProcessNetwork поставить галочки напротив Receives(скачано), Send(отосланно) ,DeltaRexeive(скорость скачивания в секунду), DeltaSend(скорость отдачи в секунду), справа тоже ,но в Байтах,МБ и т.д. но имхо информативней в битах. Остаётся только взять за шкирку появившиеся далеко справа нужные колонки и переташить левее и ешё кликните на нужную колонку и статистика распледелится по нарастающей. Кстати, можно и иконки в трее выставить какие хочешь — очень удобно.Options TrayIcons и выбираем что надо.
8 | 7 | Ответить
Нейтралист Абсолютный в ответ Михась про Process Explorer 16.32 [10-06-2020]
v.16.22 менее урезана и показывает объём ОЗУ — в v.16.32 не удалось включить в строку состояние потребления ОЗУ: там есть только нагрузка на ЦПУ и своп.
Может быть, я рукодропер, но выставленный флажок с показом ОЗУ там ничего не даёт — показатель потребляемого ОЗУ в % просто не появляется там.
2 | 3 | Ответить
Александр про Process Explorer 16.22 [31-05-2019]
После запуска слетел Denwer и Punto Switcher
11 | 11 | Ответить
Neutralist про Process Explorer 16.21 [19-05-2017]
Более расширенный диспетчер задач для Windows XP и выше.
8 | 7 | Ответить
Козявка про Process Explorer 16.05 [30-09-2015]
а crossbrowser не убивает:(
7 | 8 | Ответить
Keep resource consumption in check for best performance
by Milan Stanojevic
Milan has been enthusiastic about technology ever since his childhood days, and this led him to take interest in all PC-related technologies. He’s a PC enthusiast and he… read more
Published on August 31, 2022
Reviewed by
Vlad Turiceanu

Passionate about technology, Windows, and everything that has a power button, he spent most of his time developing new skills and learning more about the tech world. Coming… read more
- System monitor tools for Windows 10 and 11 fully diagnose your OS’s performance.
- PC resource monitoring software collects information on system temperature or CPU usage.
- Some PC resource monitoring apps also offer details about network connections.
- Most such programs use simple methods to display the usage of your system resources.
XINSTALL BY CLICKING THE DOWNLOAD FILE
This software will repair common computer errors, protect you from file loss, malware, hardware failure and optimize your PC for maximum performance. Fix PC issues and remove viruses now in 3 easy steps:
- Download Restoro PC Repair Tool that comes with Patented Technologies (patent available here).
- Click Start Scan to find Windows issues that could be causing PC problems.
- Click Repair All to fix issues affecting your computer’s security and performance
- Restoro has been downloaded by 0 readers this month.
Keeping track of your system resources is relatively simple in Windows 10 and Windows 11. However, some users prefer using third-party applications to monitor system resources because they offer a better and more straightforward user interface.
If you require complete data for your system performance and processes, using these tools can offer detailed reports for CPU usage or temperature, RAM usage, or hard drive memory.
This type of information is crucial for the health of your PC, giving you everything you must know about the hardware or software quality and usability.
What does a Resource Monitor do?
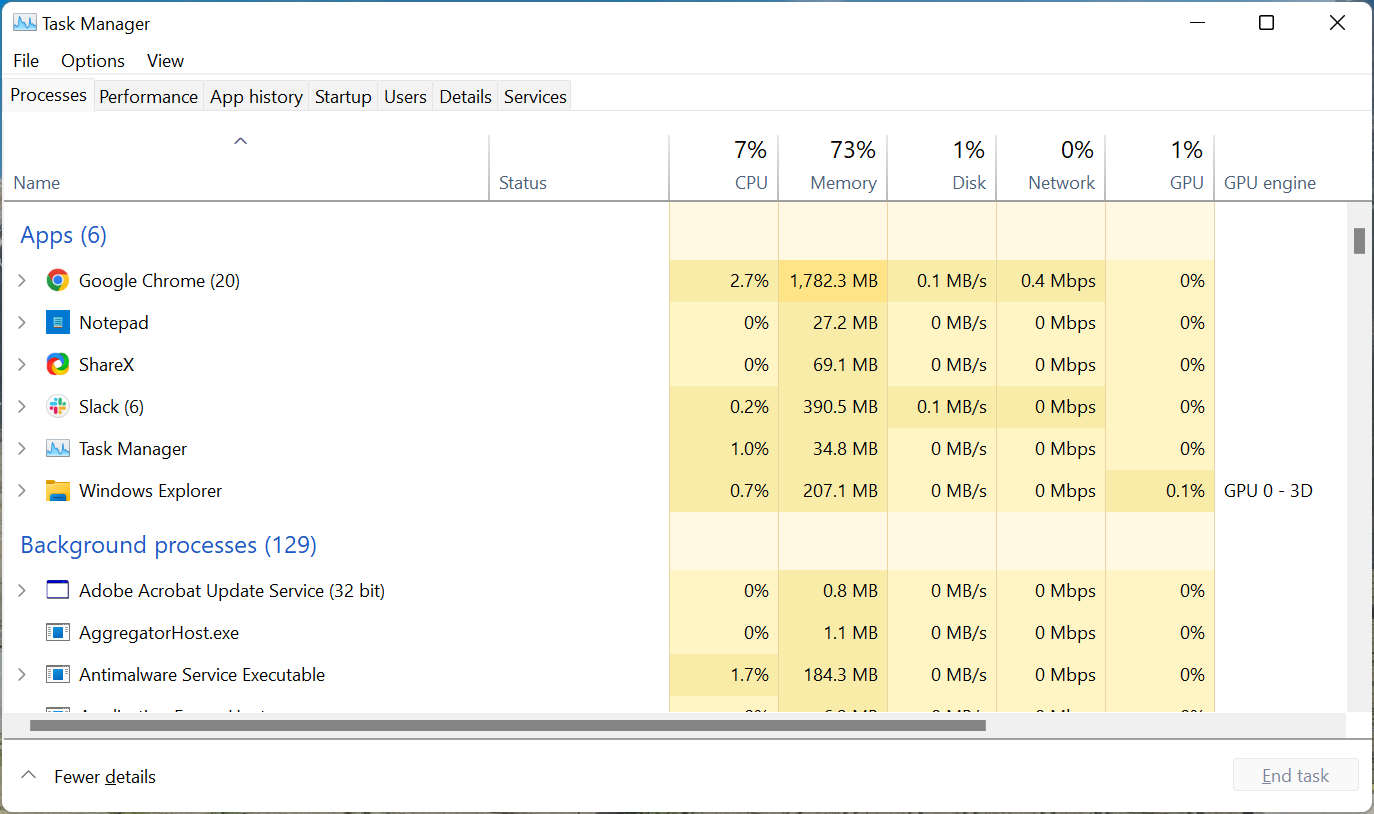
There are various ways to monitor resource consumption on Windows. The simplest option is to use the built-in Task Manager. It lists the CPU, Memory, Disk, Network, and GPU usage on the computer and is a free system monitor in Windows 10.
Along with that, it allows users to terminate applications and programs that hog the system resources and cause it to slow down.
But it doesn’t offer much information on critical aspects, making it slightly difficult to identify things, and this is where third-party tools come into the picture. We have listed the best available Windows Resource Monitors in this guide:
- Paessler PRTG – Simply the best
- AIDA64 Extreme – Provides comprehensive monitoring
- Wise System Monitor – Offer a simple UI
- Rainmeter – For easy monitoring
- FreeMeter – For graphical representation of resource consumption
- Solarwind Network Performance Monitor – Best for network monitoring
- Process Explorer – A Task Manager alternative
- TinyResMeter – Lightweight application for older devices
- CPUID HWMonitor – For detailed system information
- Moo0 System Monitor – Easily customizable
- TaskbarMeters – To quickly identify high resource consumption
What is Resource and Performance Monitor?
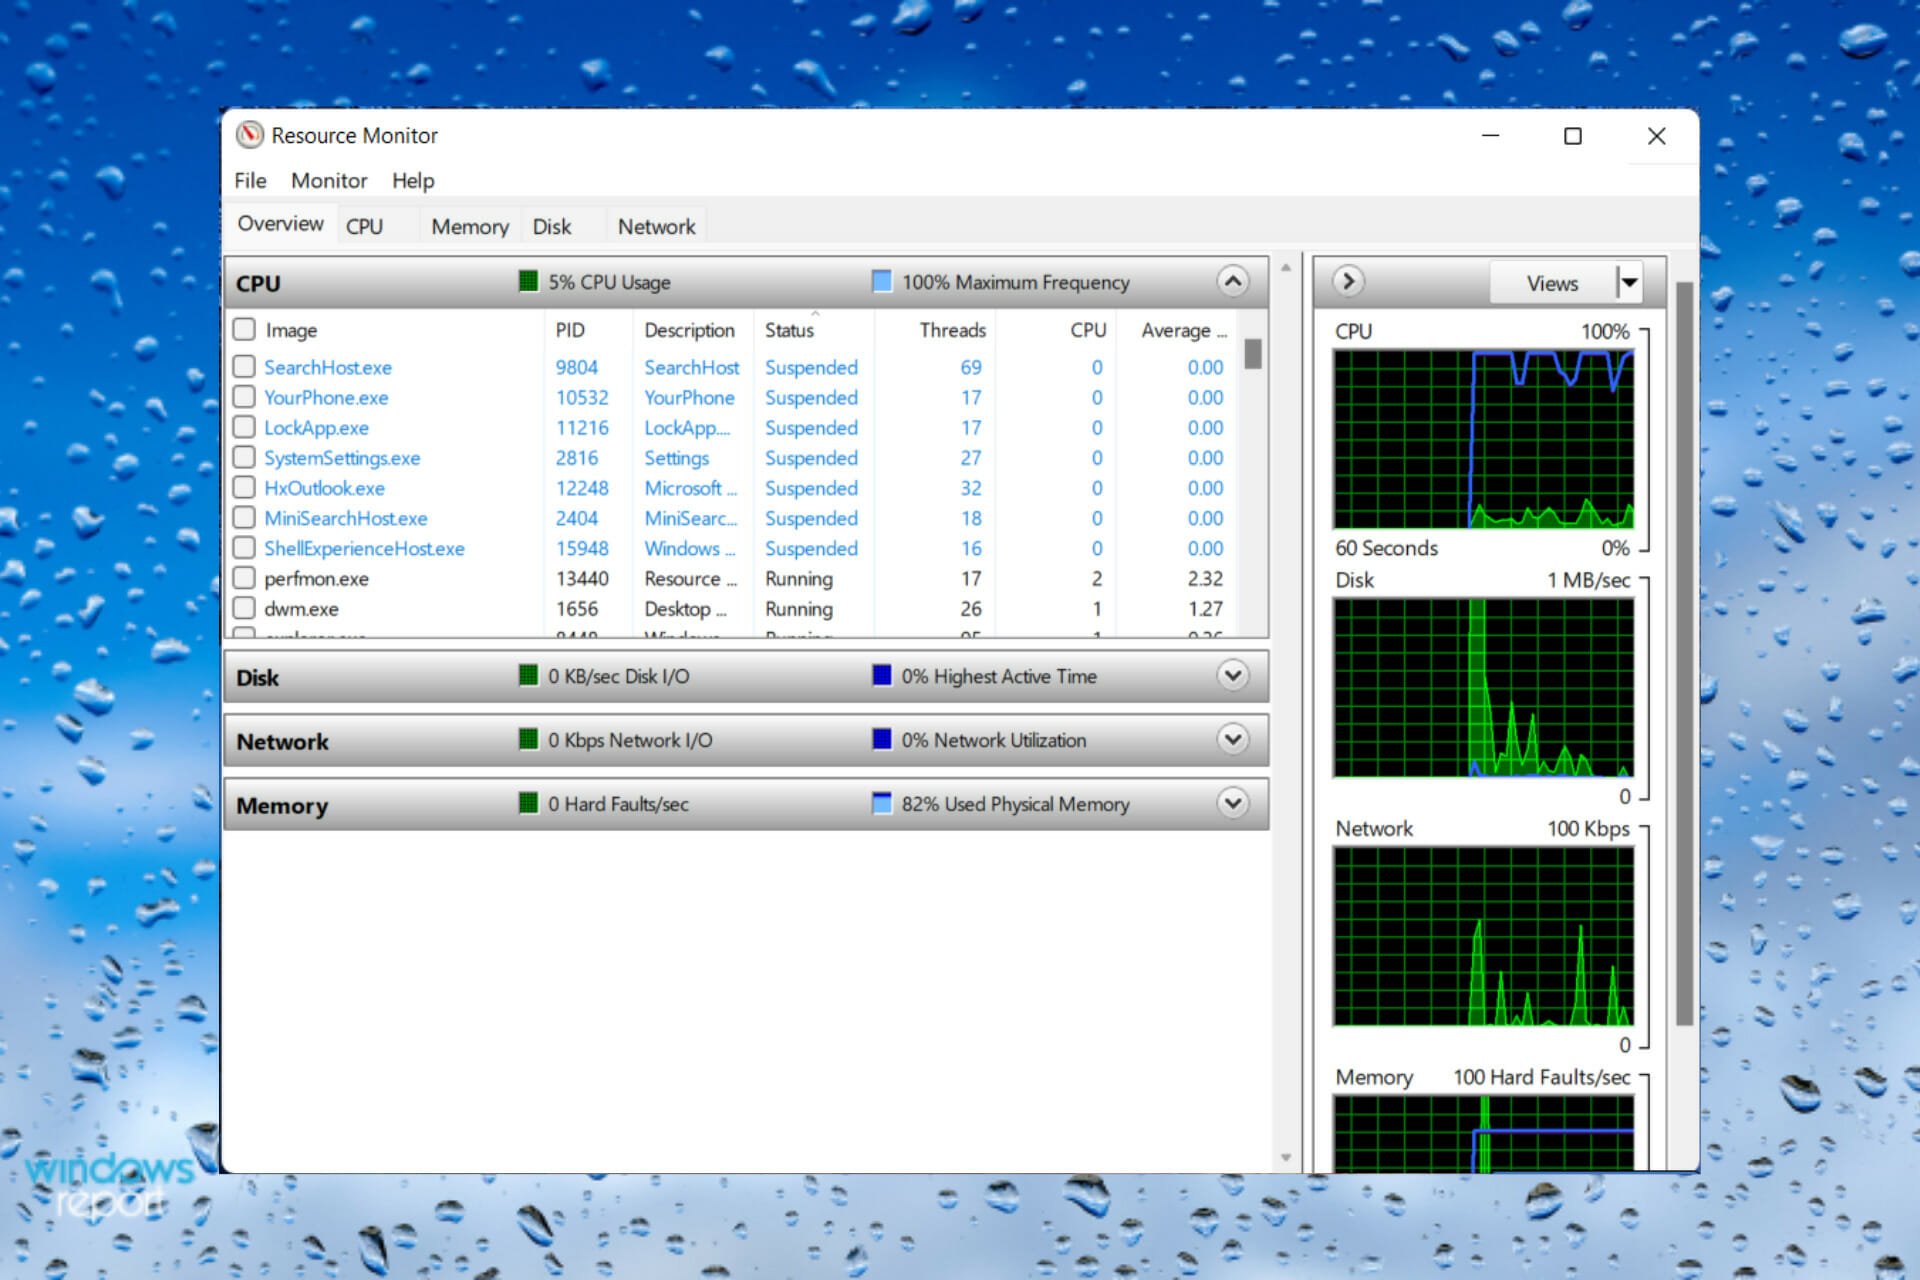
Windows has two built-in tools, the Resource Monitor and the Performance Monitor, both equally useful and handy when troubleshooting performance-related issues with the computer.
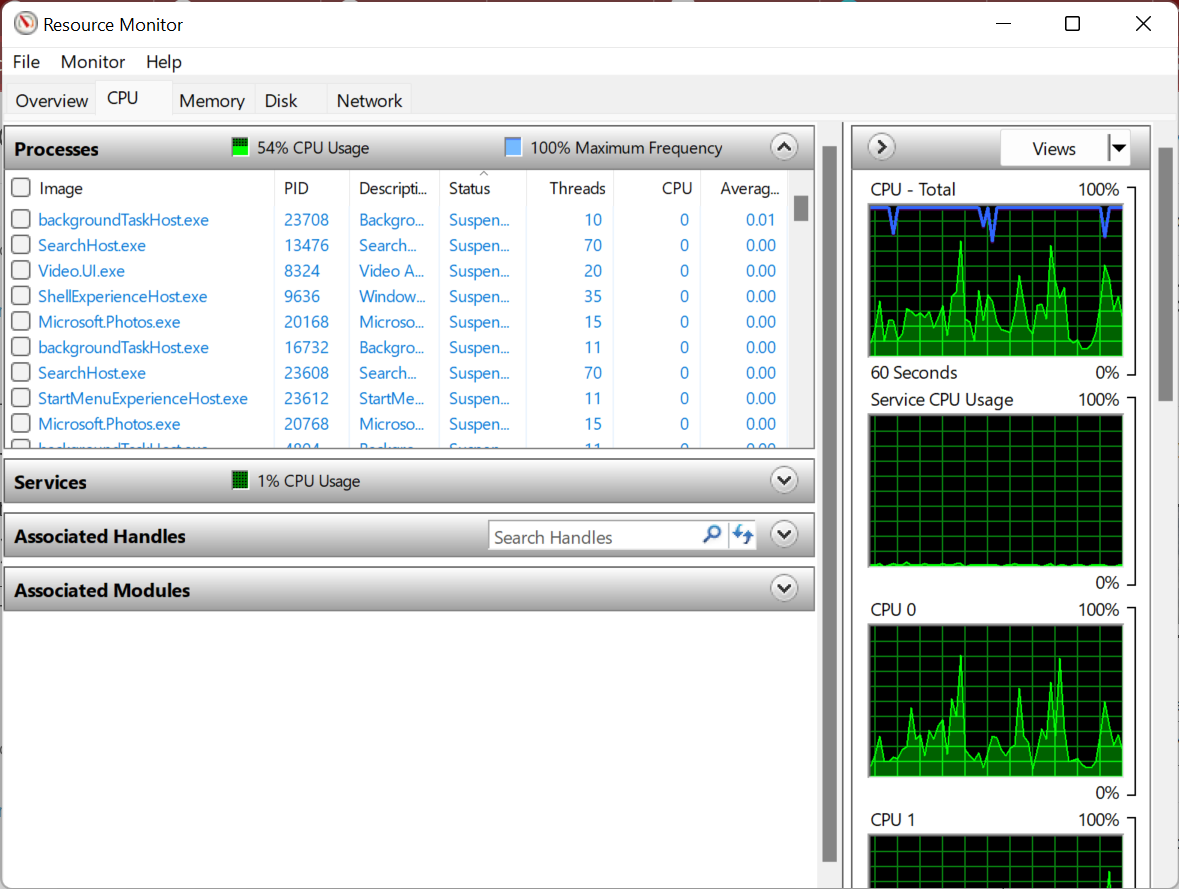
The Resource Monitor allows you to view how the various system resources are being consumed, for instance, RAM and CPU. It has a separate tab for each and also plots the resource consumption on a graph for better understanding.
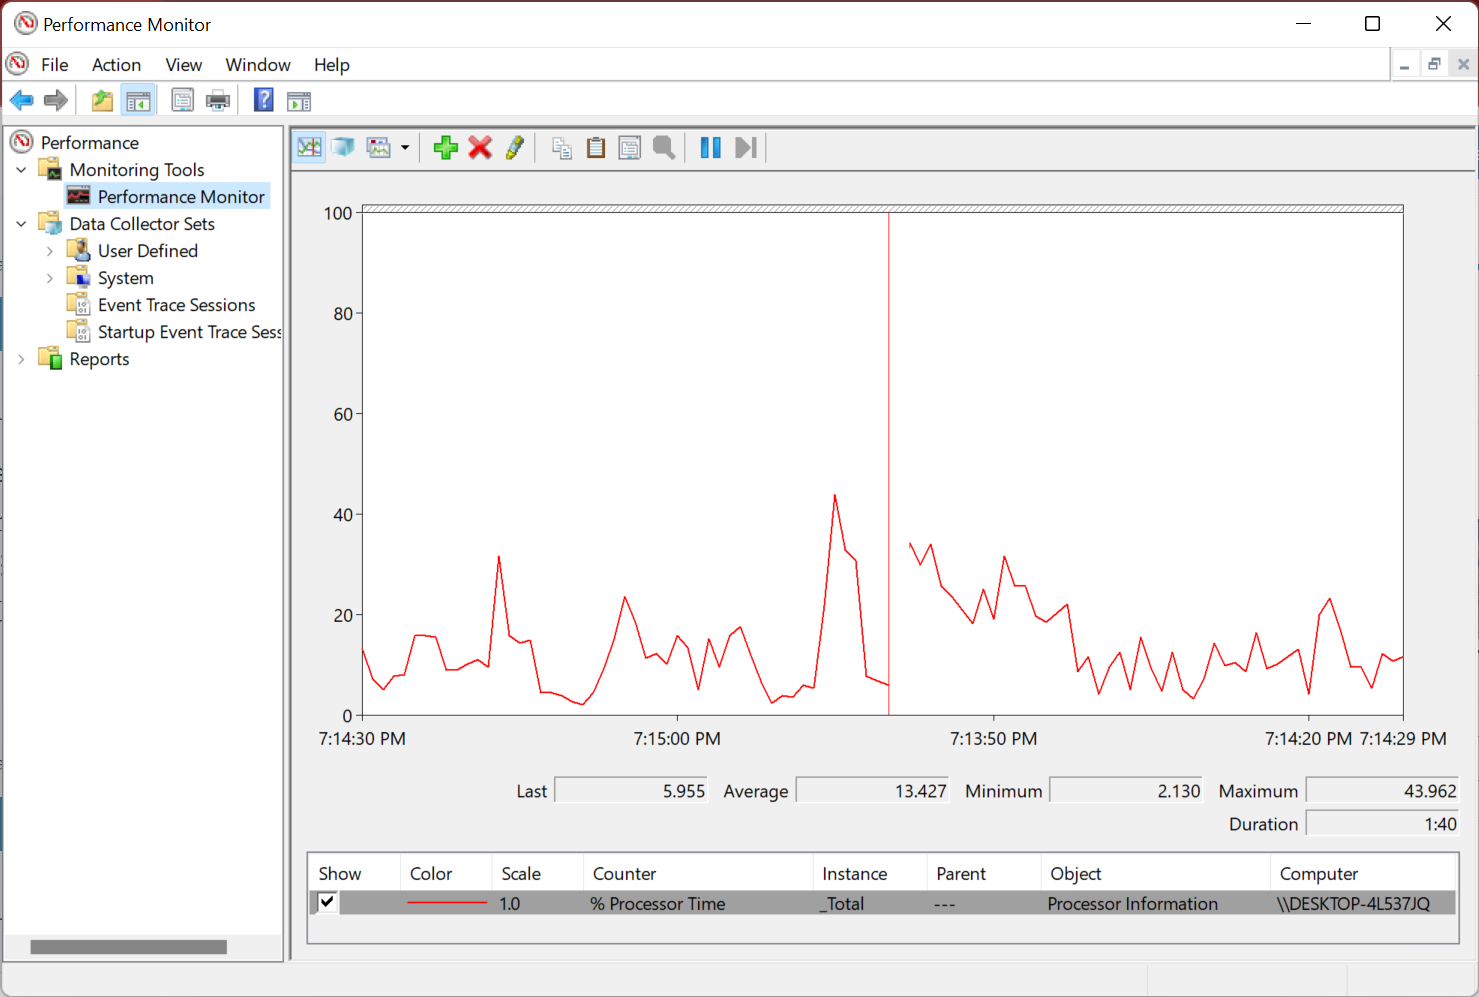
The Performance Monitor, as the name suggests, is used to analyze the performance of the computer and how the various programs and processes run. It provides the option to view this data both in real-time as well as go through the available logs for past performance analysis.
Though, if you’re looking for a dedicated tool to monitor your system resources, we have gathered here a neat list of programs that you need to check out. Also, some of the options here can be used as a Remote System Monitor, while a few offer a Windows 10 system monitor widget.
- What does a Resource Monitor do?
- Which are the best system resources monitoring tools?
- Paessler PRTG — Simply the best
Paessler PRTG – Simply the best
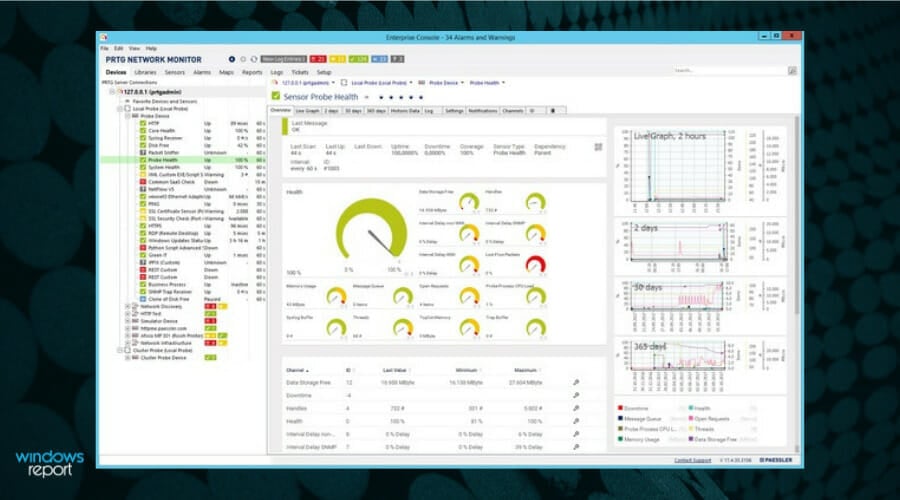
Paessler PRTG, the best Resource Monitor in Windows 10 to download, is an all-in-one software that provides complete monitoring services for your PC, applications, network, and more. Basically, it entails the IT infrastructure at your fingertips.
Anyone should know that monitoring system resources are a must-do task for any PC. So, keeping track of your hardware components using this third-party software can give you detailed data about CPU usage or other processes.
On the same page, you can use PRTG technology to monitor hardware data such as CPU or RAM capabilities, hard drive storage, network printer, routers, and so forth
Moreover, Paessler offers the possibility to track processes through features like built-in alerting technology, cluster failover solution for safety, real-time maps or dashboards, distributed network monitoring, and a multi-user interface.
To get a better idea, the software monitors your PC components’ performance using different sensors that show how fast the processor goes. As an example, an SNPM CPU load is a sensor used to monitor your network channels and see helpful data.
Thus keeping an eye on the system resources, contribute to better functionality on your device, also monitors traffic-related information at a glance.

Paessler PRTG
Consider a monitoring software that handles your PC performance seamlessly. Try out Paessler PRTG!
AIDA64 Extreme – Provides comprehensive monitoring

AIDA64 Extreme is a comprehensive system analyzer and benchmark tool which includes some powerful features such as CPU, RAM, GPU, and system functionalities monitoring.
It can also offer benchmarks and can provide a detailed audit of your system resources.
Its interface is very intuitive and similar to Microsoft Console Management. You can consult a large number of activity indicators.
This software also allows you to stress test all your components in a large variety of combinations.
You will also have great support from AIDA’s team at your disposal. Download and give it a try.

Aida64
Get real-time diagnostics about an overclocked system and support to measure your device’s performance.
Wise System Monitor – Offer a simple UI

Wise System Monitor, one of the best System Monitors in Windows 10, is another useful tool that can help you monitor system resources. The main tool allows you to see all your running processes and see how much of the computer resources they use.
There’s also a Hardware monitor included that allows you to see all hardware-related information. You can see detailed information about your motherboard, CPU, graphics card, memory, etc.
If you want, you can also see relevant information about your operating system.
As for the resource monitor, it is at the bottom right corner, just above your Taskbar. The tool will display information such as download and upload speed, RAM and CPU usage, as well as CPU temperature.
If you want to see detailed information, you just need to click a certain field, and you’ll see which applications are using most of that resource.
Wise System Monitor is a decent tool for monitoring your system resources. The tool keeps all information easily accessible, so it’s perfect for basic users.
Wise System Monitor also allows you to see your system information which can be rather useful for some users.
This is a free and simple application, and the only flaw might be the lack of any customization.
If you’re looking for a straightforward application to monitor system resources, be sure to check Wise System Monitor.

Wise System Monitor
See detailed, but easy-to-understand information regarding your system and hardware status with this free tool.
Rainmeter – For easy monitoring
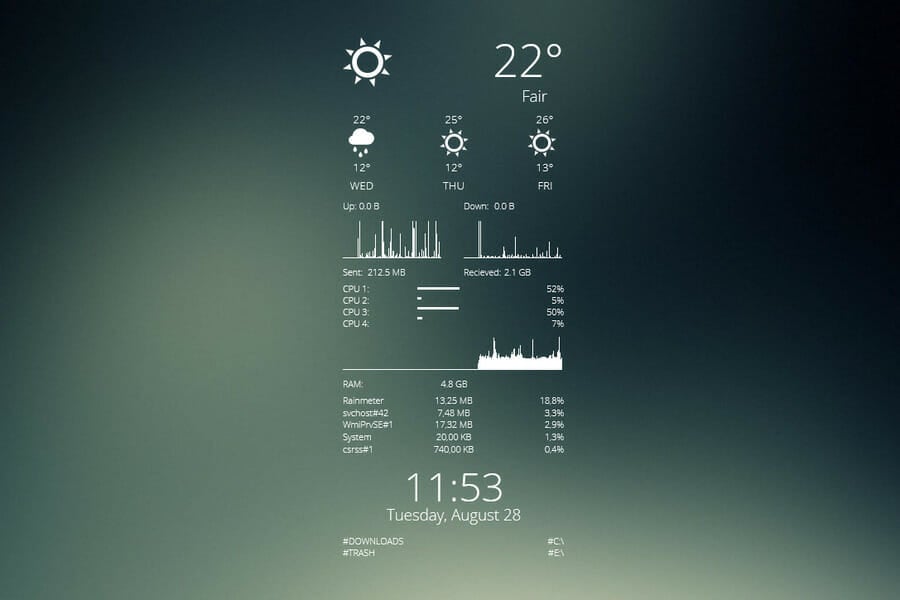
Rainmeter is a simple open-source tool that lets you monitor your system resources. The tool will display small gadgets on your desktop so you can easily monitor your CPU and RAM usage.
In addition, you can check the hard drive space as well as the speed for upload and download with the Resource Monitor.
You can easily choose which gadgets you want to display, and you can easily move the gadgets anywhere on your screen.
Although Rainmeter is simple to use, it offers extensive support for customization. By customizing this tool, you can add new skins and a new feature to the application.
If you’re not a developer, there’s an active community that is constantly developing new skins and features.
Rainmeter is available in a portable version, so there’s no need to install it on your PC to run it.
The tool offers all the basic features that you need, but if you want to use the full potential of Rainmeter, we strongly suggest that you try using different skins for the tool.
This is a great tool for system monitoring, but basic users might be turned away by extensive customization.
⇒ Get Rainmeter
FreeMeter – For graphical representation of resource consumption

If you’re looking for a reliable and easy-to-use tool to monitor system resources, you should consider FreeMeter. The application has a simple user interface, and it will show you all the necessary information in the form of graphs.
The tool offers comprehensive performance information that will help you tackle any issue in order to get the best experience possible.
FreeMeter shows easy-to-follow reports and real-time status updates of your system uptime as well as hard drive space.
Along with that, it monitors CPU usage. The professional version can display kernel CPU usage and user CPU usage separately.
In terms of Internet connection, the software is able to monitor both wireless and Ethernet speeds separately.
It can also help with troubleshooting and fixing latency issues. FreeMeter monitors network ping and helps with slow connections.
FreeMeter offers a free version as well as a premium one with a larger set of features. Give it a try and see if it meets your needs.
⇒ Get FreeMeter
Solarwind Network Performance Monitor – Best for network monitoring

This multi-solution company can offer multi-vendor network monitoring on your own PC that shows network connection data at a glance.
Using this comprehensive software, you can see detailed information for network performance aspects like hardware internet issues or cloud server monitoring.
According to your monitoring needs, it’s easy to control your IT infrastructure with a detailed view of physical network performance or cloud server data.
More so, you have absolute control over the network processes and document every matter regarding the connectivity with key metrics and drill-down analysis meant to cover everything.
Some PC issues are hard to tackle, especially when it comes to corrupted repositories or missing Windows files. If you are having troubles fixing an error, your system may be partially broken.
We recommend installing Restoro, a tool that will scan your machine and identify what the fault is.
Click here to download and start repairing.
It is also possible to monitor and analyze Cisco devices’ networks from the comfort of your home. More exactly, you have access to availability or performance graphics in one view.
If you need to detect Cisco routers or other devices, it can’t be more simple than automatically discovering and identifying the network.
Furthermore, for more insights, you can run packet inspections and see network slowdown problems and their causes.
Analyzing over 1.200 applications to see the response time or classifying network traffic gives you the perfect methods to resolve the issues.
Finally, you will efficiently manage the network performance with instant notifications when issues arrive and critical health data for network hardware.
⇒ Get Solarwind Network Performance Monitor
Process Explorer – A Task Manager alternative
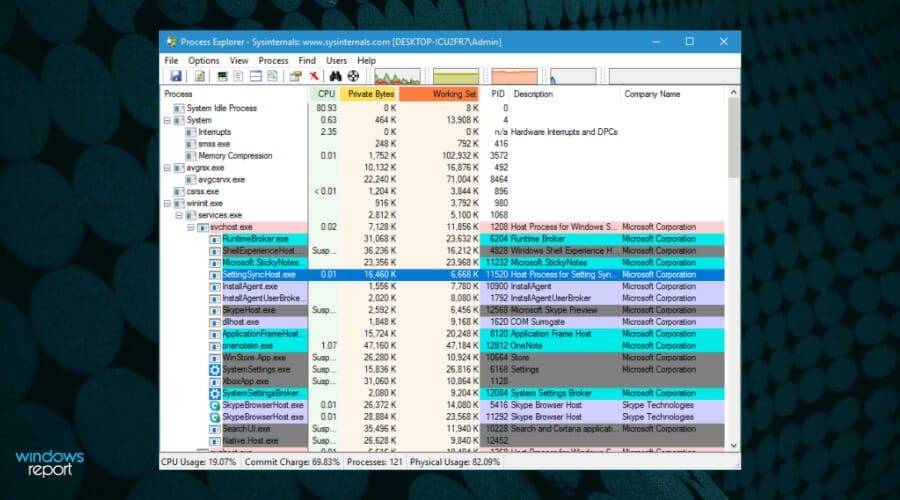
Process Explorer is designed as a Task Manager alternative, and this tool will list all your active processes. Using this tool, you can easily end a process or change its priority.
In addition, you can also monitor system resources by using Process Explorer.
There are four graphs available in Process Explorer, and each graph represents a single resource. If you want detailed information, simply click one of the graphs, and a new window will appear.
From there, you can see the summary or check the CPU, memory, I/O, and GPU usage individually.
This tool also comes with a small graph that will appear in your Taskbar so you can constantly monitor your system resources.
Process Explorer is a great Task Manager alternative, but it can also be used to monitor system resources. This application is free and portable, so be sure to give it a try.
⇒ Get Process Explorer
TinyResMeter – Lightweight application for older devices
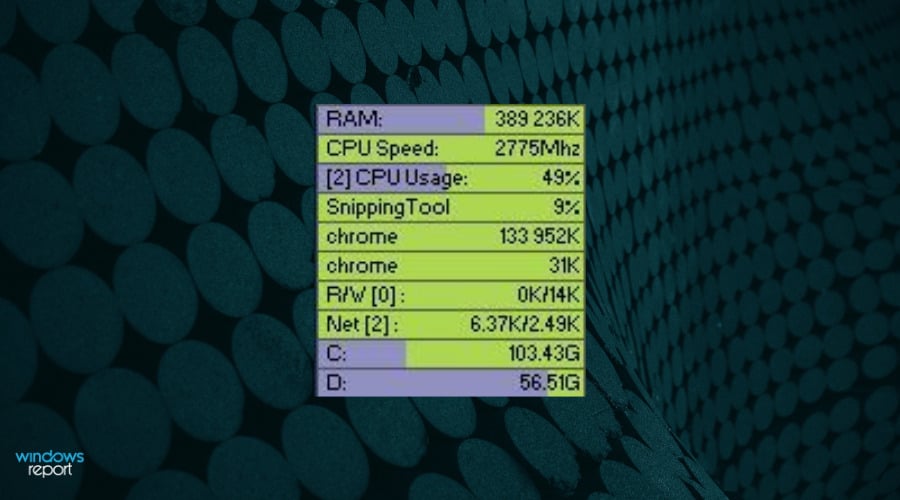
Another simple tool that allows you to monitor system resources is TinyResMeter. This is a portable and lightweight application, so it can run on almost any PC.
The application doesn’t have a visually appealing user interface, but it will show you all the necessary information.
System information can be displayed in a horizontal or vertical menu. If you want, you can customize the font and colors, but you can also customize available fields.
You can also enter your own labels for the fields. As for available fields, you can display RAM, CPU speed, CPU usage, network speed, etc.
TinyResMeter comes with a bit outdated interface, but it can still be useful. The tool allows you to right-click each field and see detailed information about it.
For example, by right-clicking your hard drive, you can see the total amount of space, label, system type, and all other necessary information.
As for the flaws, the tool feels a bit sluggish at times, and there’s also one visual bug that we noticed.
Every time you hover your mouse over the TinyResMeter, it will turn black, and after a second, it will turn back to normal. This is a small bug, but it can be irritating at times.
TinyResMeter is a simple and portable application that lets you monitor system resources. Despite its simplicity, the application feels a bit outdated, and it has a few minor bugs.
⇒ Get TinyResMeter
CPUID HWMonitor – For detailed system information

If you want to see detailed information regarding your system, HWMonitor is the perfect tool for you.
This system monitor tool is free, and it will allow you to monitor your hardware and see all the relevant information.
The application comes with a hardware tree that you can expand in order to see the necessary information. Using this tool, you can see important information such as temperature, fan speed, and utilization.
Although you can see the information about your motherboard, CPU, graphic card, and hard drive, it seems that you can’t see information regarding your RAM or network connection.
Unlike other tools on our list, HWMonitor doesn’t offer a real-time graph, and in order to check your system resources, you’ll need to keep the HWMonitor window open.
This tool offers a lot of information about your hardware, and it can be useful if you want to know more about your components. As for resource monitoring, the tool offers almost all necessary information, but some users might have issues finding the desired information.
HWMonitor is a decent tool, it’s free and portable, but it doesn’t show any information regarding your network connection or RAM, which is its biggest flaw, in our opinion.
⇒ Get HWMonitor
Moo0 System Monitor – Easily customizable

Moo0 System Monitor is a free and portable tool for monitoring system resources. This tool consists of several graphs that show you all the necessary system information.
Using this tool, you can see CPU usage and temperature, GPU usage and temperature, amount of free memory, HDD temperature, network speed, etc.
If you want, you can also add additional fields to show more information.
The tool supports some customization, and you can change the size of the tool or its transparency. You can also auto-hide this tool after a certain period of inactivity.
The tool also supports many different color schemes, and you can even set the color scheme to change automatically.
Moo0 System Monitor is a great tool, it’s simple and portable, so it will be perfect for both basic and advanced users.
We have to mention that this tool can sometimes take up a lot of space on your screen depending on the number of fields that you have, so keep that in mind.
Overall, Moo0 System Monitor is a great tool, and you should definitely check it out.
⇒ Get Moo0 System Monitor
TaskbarMeters – To quickly identify high resource consumption

Taskbar Meters is a set of applications that allows you to monitor your system resources. There are three applications available, and they all work the same way.
Each application will position itself in your Taskbar, showing your resource usage.
Every application is designed to change color in the Taskbar, so you’ll quickly notice if you’re using too much of your resources.
Using these tools, you can monitor your CPU, RAM, and disk usage, which is more than enough for primary users. Then, if you want, you can adjust the colors or update the frequency of each tool.
We have to mention that these applications use a simple method to display the usage of your system resources.
Unfortunately, using this method, you can’t see the exact numbers, which can be a flaw for some users.
The only flaw of these tools is the lack of ability to show detailed information about CPU, RAM, or disk usage, which can turn away some users.
⇒ Get TaskbarMeters
- Best PC performance monitoring software for Windows 10/11
- Best cloud monitoring & performance tools
- Best bandwidth monitors for Windows 10/11
- Fix: Low system resources on Windows 10/11 [Easy Guide]
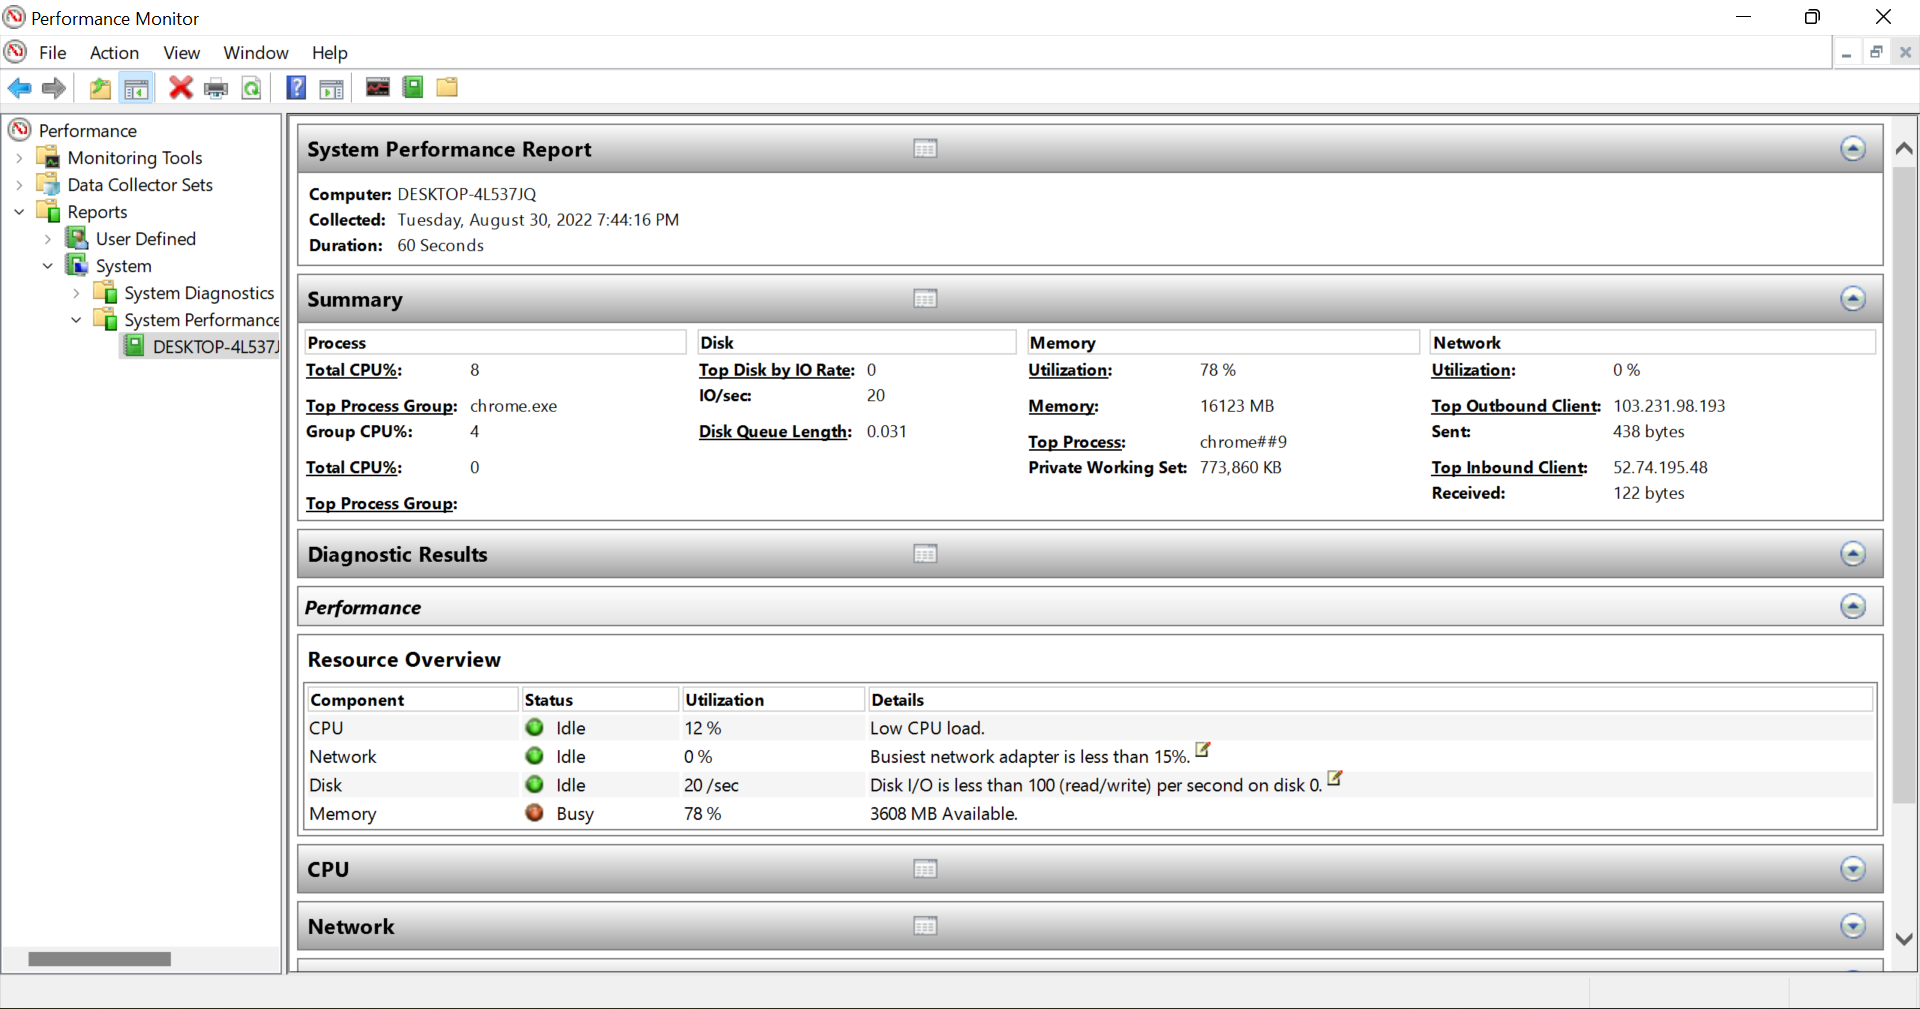
How do I check my system performance?
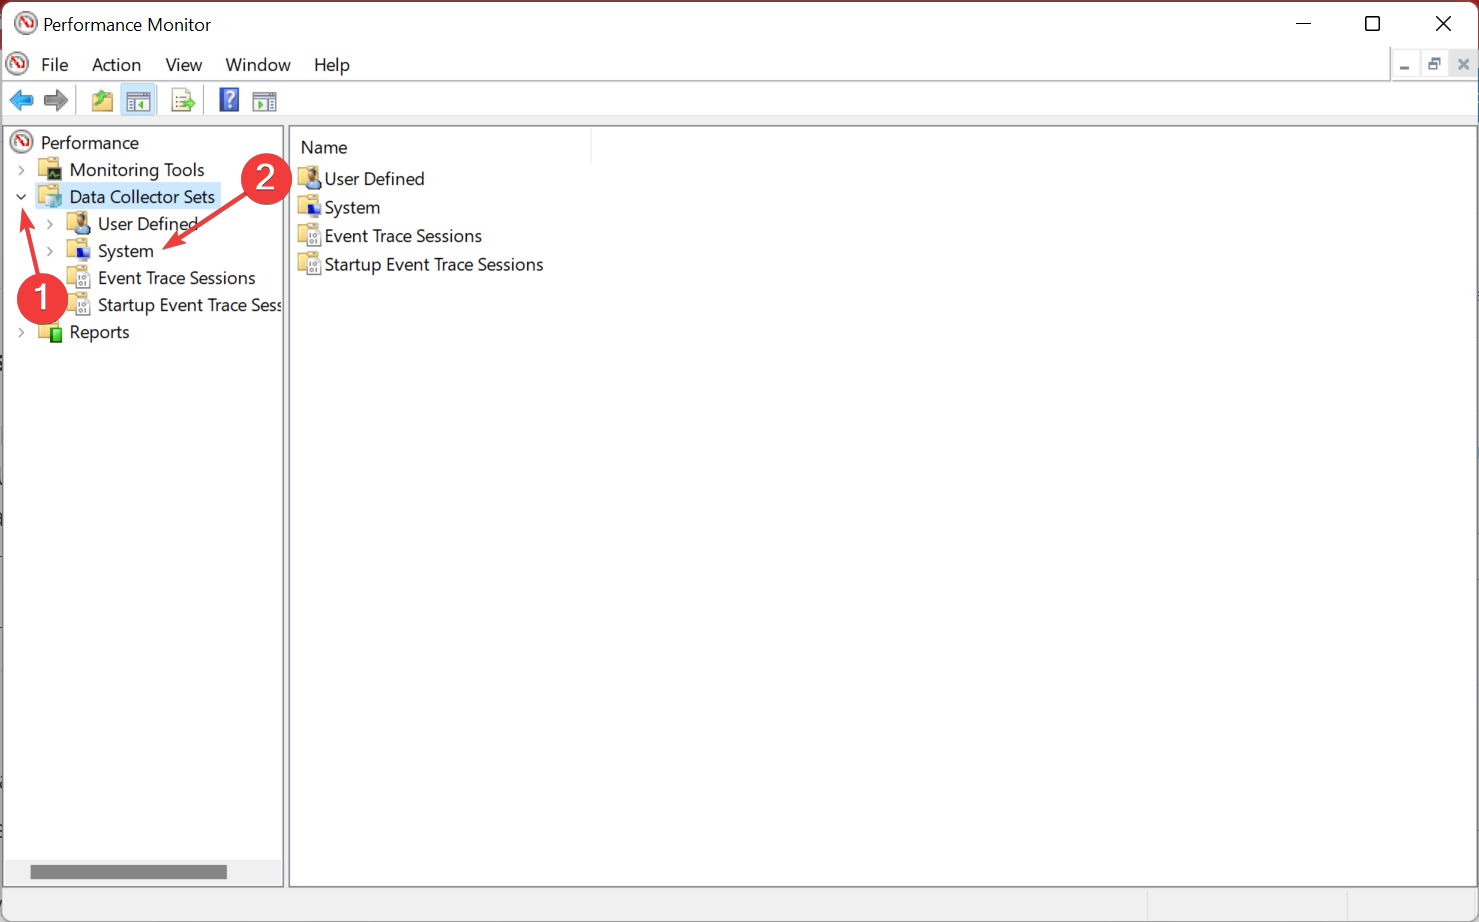
- Open the Performance Monitor, expand Data Collector Sets, and double-click on System under it.

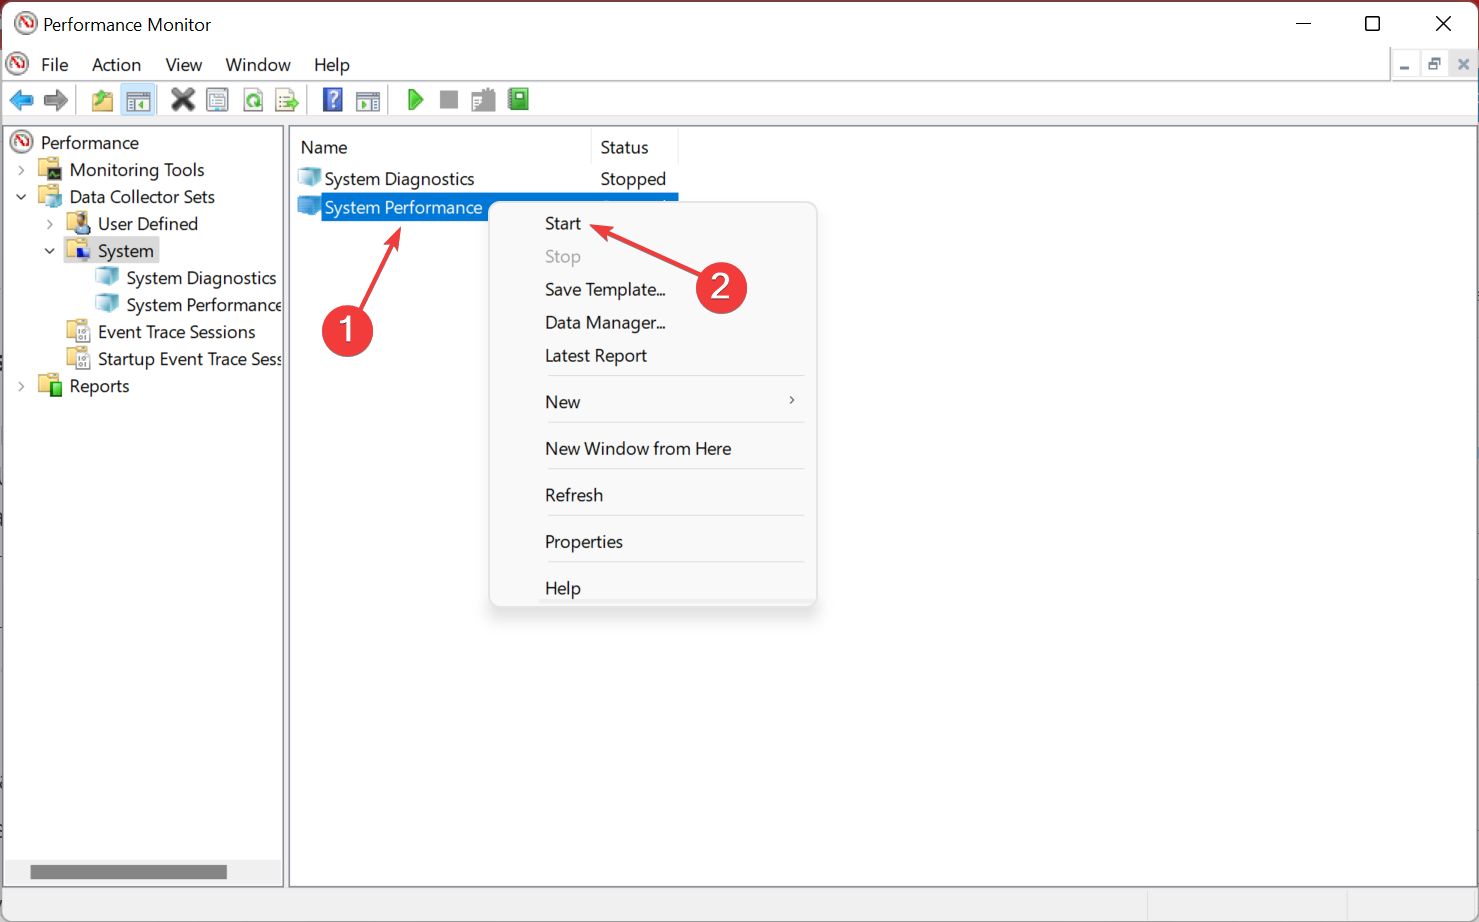
- Right-click on System Performance and select Start.
- This will trigger a 60-second test to analyze the computer’s performance.
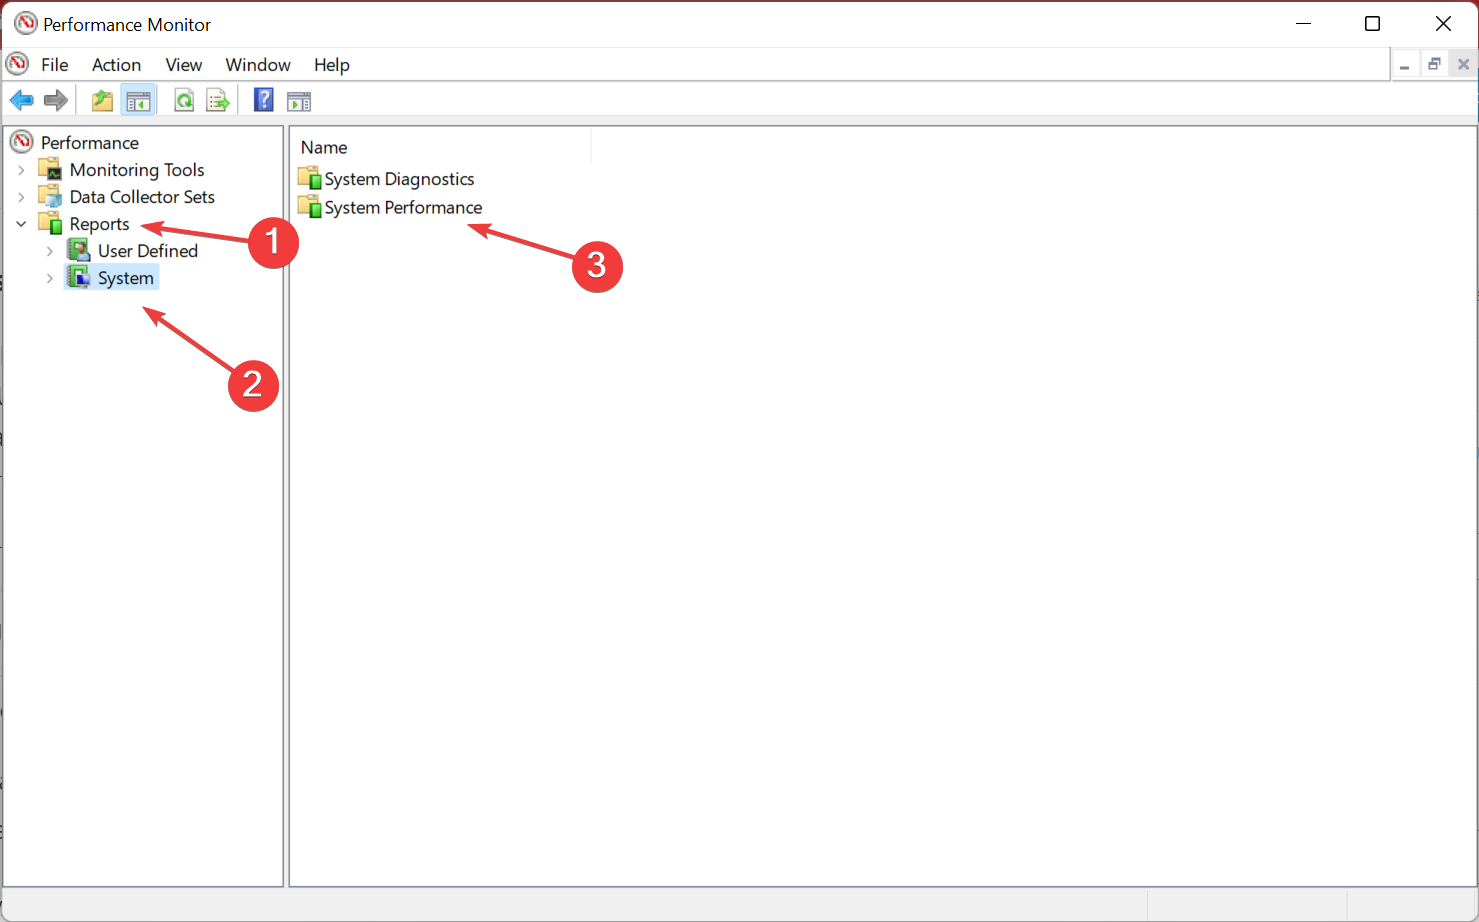
- After the period, expand Reports, select System under it, and then double-click on System Performance.
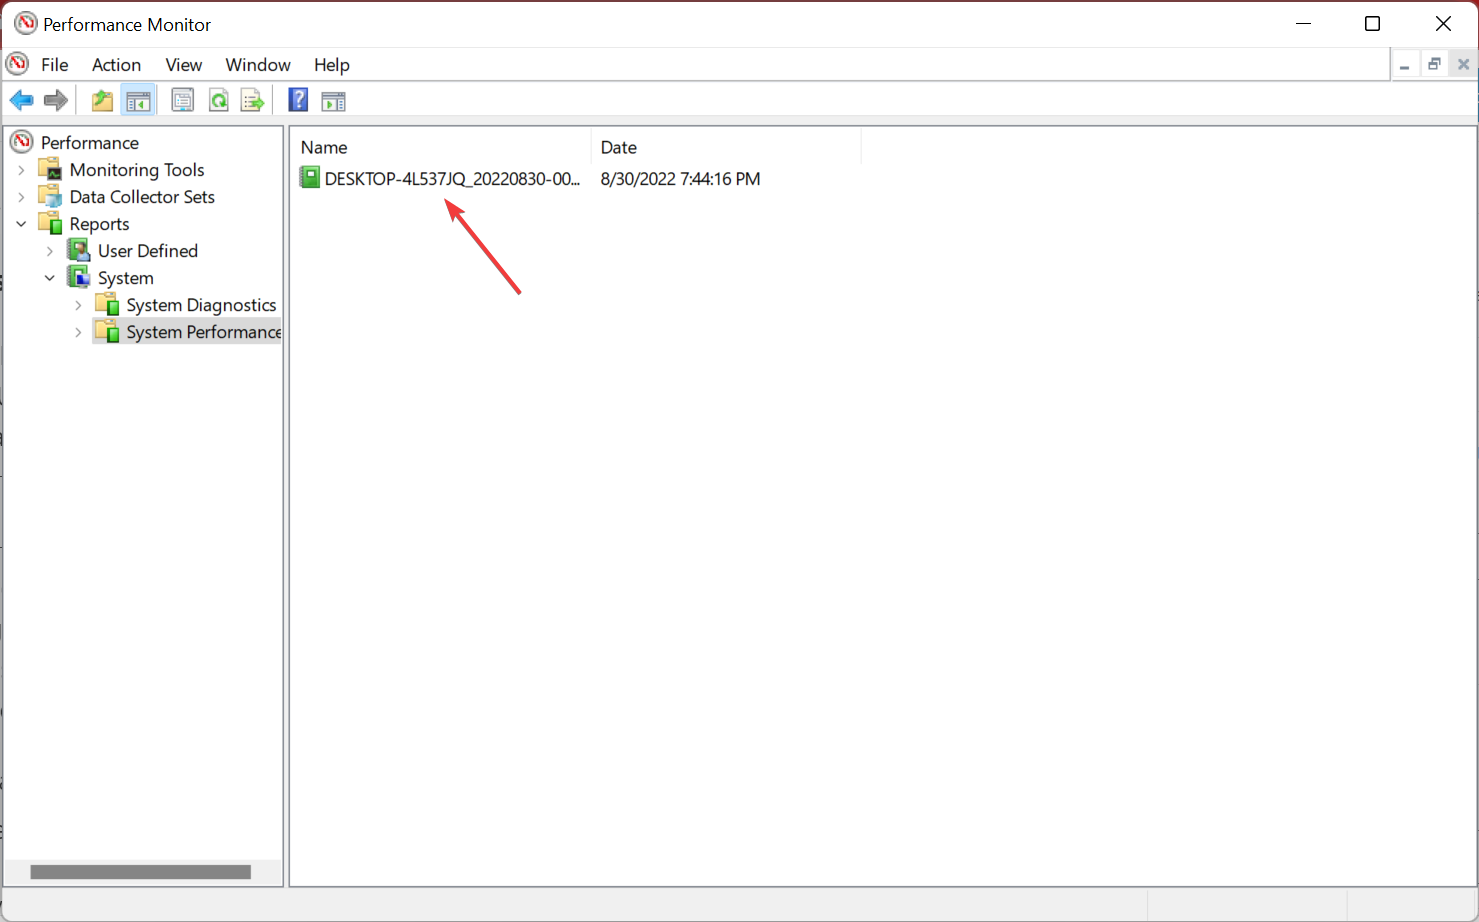
- Now, double-click on the report listed here.
- You can now view the system performance and identify what’s consuming the maximum resources and other critical information.

If you want to monitor system resources, feel free to use any of these tools because they will provide the necessary information.
It is essential to maintain your computer healthy. The first step is to monitor the system resources accordingly, and this list is more than sufficient to provide the best options for everyone and every PC.
You can use the Resource Monitor in Windows 10 for logging data or try the other third-party tools here.
If you found some problems, here’s what you should do if the system runs low on resources on Windows 10/11.
We’d like to hear which of these tools you prefer and why. Use the comments section to get in touch with us.
Still having issues? Fix them with this tool:
SPONSORED
If the advices above haven’t solved your issue, your PC may experience deeper Windows problems. We recommend downloading this PC Repair tool (rated Great on TrustPilot.com) to easily address them. After installation, simply click the Start Scan button and then press on Repair All.
![]()
Newsletter
Keep resource consumption in check for best performance
by Milan Stanojevic
Milan has been enthusiastic about technology ever since his childhood days, and this led him to take interest in all PC-related technologies. He’s a PC enthusiast and he… read more
Published on August 31, 2022
Reviewed by
Vlad Turiceanu
Passionate about technology, Windows, and everything that has a power button, he spent most of his time developing new skills and learning more about the tech world. Coming… read more
- System monitor tools for Windows 10 and 11 fully diagnose your OS’s performance.
- PC resource monitoring software collects information on system temperature or CPU usage.
- Some PC resource monitoring apps also offer details about network connections.
- Most such programs use simple methods to display the usage of your system resources.
XINSTALL BY CLICKING THE DOWNLOAD FILE
This software will repair common computer errors, protect you from file loss, malware, hardware failure and optimize your PC for maximum performance. Fix PC issues and remove viruses now in 3 easy steps:
- Download Restoro PC Repair Tool that comes with Patented Technologies (patent available here).
- Click Start Scan to find Windows issues that could be causing PC problems.
- Click Repair All to fix issues affecting your computer’s security and performance
- Restoro has been downloaded by 0 readers this month.
Keeping track of your system resources is relatively simple in Windows 10 and Windows 11. However, some users prefer using third-party applications to monitor system resources because they offer a better and more straightforward user interface.
If you require complete data for your system performance and processes, using these tools can offer detailed reports for CPU usage or temperature, RAM usage, or hard drive memory.
This type of information is crucial for the health of your PC, giving you everything you must know about the hardware or software quality and usability.
What does a Resource Monitor do?
There are various ways to monitor resource consumption on Windows. The simplest option is to use the built-in Task Manager. It lists the CPU, Memory, Disk, Network, and GPU usage on the computer and is a free system monitor in Windows 10.
Along with that, it allows users to terminate applications and programs that hog the system resources and cause it to slow down.
But it doesn’t offer much information on critical aspects, making it slightly difficult to identify things, and this is where third-party tools come into the picture. We have listed the best available Windows Resource Monitors in this guide:
- Paessler PRTG – Simply the best
- AIDA64 Extreme – Provides comprehensive monitoring
- Wise System Monitor – Offer a simple UI
- Rainmeter – For easy monitoring
- FreeMeter – For graphical representation of resource consumption
- Solarwind Network Performance Monitor – Best for network monitoring
- Process Explorer – A Task Manager alternative
- TinyResMeter – Lightweight application for older devices
- CPUID HWMonitor – For detailed system information
- Moo0 System Monitor – Easily customizable
- TaskbarMeters – To quickly identify high resource consumption
What is Resource and Performance Monitor?
Windows has two built-in tools, the Resource Monitor and the Performance Monitor, both equally useful and handy when troubleshooting performance-related issues with the computer.
The Resource Monitor allows you to view how the various system resources are being consumed, for instance, RAM and CPU. It has a separate tab for each and also plots the resource consumption on a graph for better understanding.
The Performance Monitor, as the name suggests, is used to analyze the performance of the computer and how the various programs and processes run. It provides the option to view this data both in real-time as well as go through the available logs for past performance analysis.
Though, if you’re looking for a dedicated tool to monitor your system resources, we have gathered here a neat list of programs that you need to check out. Also, some of the options here can be used as a Remote System Monitor, while a few offer a Windows 10 system monitor widget.
- What does a Resource Monitor do?
- Which are the best system resources monitoring tools?
- Paessler PRTG — Simply the best
Paessler PRTG – Simply the best
Paessler PRTG, the best Resource Monitor in Windows 10 to download, is an all-in-one software that provides complete monitoring services for your PC, applications, network, and more. Basically, it entails the IT infrastructure at your fingertips.
Anyone should know that monitoring system resources are a must-do task for any PC. So, keeping track of your hardware components using this third-party software can give you detailed data about CPU usage or other processes.
On the same page, you can use PRTG technology to monitor hardware data such as CPU or RAM capabilities, hard drive storage, network printer, routers, and so forth
Moreover, Paessler offers the possibility to track processes through features like built-in alerting technology, cluster failover solution for safety, real-time maps or dashboards, distributed network monitoring, and a multi-user interface.
To get a better idea, the software monitors your PC components’ performance using different sensors that show how fast the processor goes. As an example, an SNPM CPU load is a sensor used to monitor your network channels and see helpful data.
Thus keeping an eye on the system resources, contribute to better functionality on your device, also monitors traffic-related information at a glance.
Paessler PRTG
Consider a monitoring software that handles your PC performance seamlessly. Try out Paessler PRTG!
AIDA64 Extreme – Provides comprehensive monitoring
AIDA64 Extreme is a comprehensive system analyzer and benchmark tool which includes some powerful features such as CPU, RAM, GPU, and system functionalities monitoring.
It can also offer benchmarks and can provide a detailed audit of your system resources.
Its interface is very intuitive and similar to Microsoft Console Management. You can consult a large number of activity indicators.
This software also allows you to stress test all your components in a large variety of combinations.
You will also have great support from AIDA’s team at your disposal. Download and give it a try.
Aida64
Get real-time diagnostics about an overclocked system and support to measure your device’s performance.
Wise System Monitor – Offer a simple UI
Wise System Monitor, one of the best System Monitors in Windows 10, is another useful tool that can help you monitor system resources. The main tool allows you to see all your running processes and see how much of the computer resources they use.
There’s also a Hardware monitor included that allows you to see all hardware-related information. You can see detailed information about your motherboard, CPU, graphics card, memory, etc.
If you want, you can also see relevant information about your operating system.
As for the resource monitor, it is at the bottom right corner, just above your Taskbar. The tool will display information such as download and upload speed, RAM and CPU usage, as well as CPU temperature.
If you want to see detailed information, you just need to click a certain field, and you’ll see which applications are using most of that resource.
Wise System Monitor is a decent tool for monitoring your system resources. The tool keeps all information easily accessible, so it’s perfect for basic users.
Wise System Monitor also allows you to see your system information which can be rather useful for some users.
This is a free and simple application, and the only flaw might be the lack of any customization.
If you’re looking for a straightforward application to monitor system resources, be sure to check Wise System Monitor.
Wise System Monitor
See detailed, but easy-to-understand information regarding your system and hardware status with this free tool.
Rainmeter – For easy monitoring
Rainmeter is a simple open-source tool that lets you monitor your system resources. The tool will display small gadgets on your desktop so you can easily monitor your CPU and RAM usage.
In addition, you can check the hard drive space as well as the speed for upload and download with the Resource Monitor.
You can easily choose which gadgets you want to display, and you can easily move the gadgets anywhere on your screen.
Although Rainmeter is simple to use, it offers extensive support for customization. By customizing this tool, you can add new skins and a new feature to the application.
If you’re not a developer, there’s an active community that is constantly developing new skins and features.
Rainmeter is available in a portable version, so there’s no need to install it on your PC to run it.
The tool offers all the basic features that you need, but if you want to use the full potential of Rainmeter, we strongly suggest that you try using different skins for the tool.
This is a great tool for system monitoring, but basic users might be turned away by extensive customization.
⇒ Get Rainmeter
FreeMeter – For graphical representation of resource consumption
If you’re looking for a reliable and easy-to-use tool to monitor system resources, you should consider FreeMeter. The application has a simple user interface, and it will show you all the necessary information in the form of graphs.
The tool offers comprehensive performance information that will help you tackle any issue in order to get the best experience possible.
FreeMeter shows easy-to-follow reports and real-time status updates of your system uptime as well as hard drive space.
Along with that, it monitors CPU usage. The professional version can display kernel CPU usage and user CPU usage separately.
In terms of Internet connection, the software is able to monitor both wireless and Ethernet speeds separately.
It can also help with troubleshooting and fixing latency issues. FreeMeter monitors network ping and helps with slow connections.
FreeMeter offers a free version as well as a premium one with a larger set of features. Give it a try and see if it meets your needs.
⇒ Get FreeMeter
Solarwind Network Performance Monitor – Best for network monitoring
This multi-solution company can offer multi-vendor network monitoring on your own PC that shows network connection data at a glance.
Using this comprehensive software, you can see detailed information for network performance aspects like hardware internet issues or cloud server monitoring.
According to your monitoring needs, it’s easy to control your IT infrastructure with a detailed view of physical network performance or cloud server data.
More so, you have absolute control over the network processes and document every matter regarding the connectivity with key metrics and drill-down analysis meant to cover everything.
Some PC issues are hard to tackle, especially when it comes to corrupted repositories or missing Windows files. If you are having troubles fixing an error, your system may be partially broken.
We recommend installing Restoro, a tool that will scan your machine and identify what the fault is.
Click here to download and start repairing.
It is also possible to monitor and analyze Cisco devices’ networks from the comfort of your home. More exactly, you have access to availability or performance graphics in one view.
If you need to detect Cisco routers or other devices, it can’t be more simple than automatically discovering and identifying the network.
Furthermore, for more insights, you can run packet inspections and see network slowdown problems and their causes.
Analyzing over 1.200 applications to see the response time or classifying network traffic gives you the perfect methods to resolve the issues.
Finally, you will efficiently manage the network performance with instant notifications when issues arrive and critical health data for network hardware.
⇒ Get Solarwind Network Performance Monitor
Process Explorer – A Task Manager alternative
Process Explorer is designed as a Task Manager alternative, and this tool will list all your active processes. Using this tool, you can easily end a process or change its priority.
In addition, you can also monitor system resources by using Process Explorer.
There are four graphs available in Process Explorer, and each graph represents a single resource. If you want detailed information, simply click one of the graphs, and a new window will appear.
From there, you can see the summary or check the CPU, memory, I/O, and GPU usage individually.
This tool also comes with a small graph that will appear in your Taskbar so you can constantly monitor your system resources.
Process Explorer is a great Task Manager alternative, but it can also be used to monitor system resources. This application is free and portable, so be sure to give it a try.
⇒ Get Process Explorer
TinyResMeter – Lightweight application for older devices
Another simple tool that allows you to monitor system resources is TinyResMeter. This is a portable and lightweight application, so it can run on almost any PC.
The application doesn’t have a visually appealing user interface, but it will show you all the necessary information.
System information can be displayed in a horizontal or vertical menu. If you want, you can customize the font and colors, but you can also customize available fields.
You can also enter your own labels for the fields. As for available fields, you can display RAM, CPU speed, CPU usage, network speed, etc.
TinyResMeter comes with a bit outdated interface, but it can still be useful. The tool allows you to right-click each field and see detailed information about it.
For example, by right-clicking your hard drive, you can see the total amount of space, label, system type, and all other necessary information.
As for the flaws, the tool feels a bit sluggish at times, and there’s also one visual bug that we noticed.
Every time you hover your mouse over the TinyResMeter, it will turn black, and after a second, it will turn back to normal. This is a small bug, but it can be irritating at times.
TinyResMeter is a simple and portable application that lets you monitor system resources. Despite its simplicity, the application feels a bit outdated, and it has a few minor bugs.
⇒ Get TinyResMeter
CPUID HWMonitor – For detailed system information
If you want to see detailed information regarding your system, HWMonitor is the perfect tool for you.
This system monitor tool is free, and it will allow you to monitor your hardware and see all the relevant information.
The application comes with a hardware tree that you can expand in order to see the necessary information. Using this tool, you can see important information such as temperature, fan speed, and utilization.
Although you can see the information about your motherboard, CPU, graphic card, and hard drive, it seems that you can’t see information regarding your RAM or network connection.
Unlike other tools on our list, HWMonitor doesn’t offer a real-time graph, and in order to check your system resources, you’ll need to keep the HWMonitor window open.
This tool offers a lot of information about your hardware, and it can be useful if you want to know more about your components. As for resource monitoring, the tool offers almost all necessary information, but some users might have issues finding the desired information.
HWMonitor is a decent tool, it’s free and portable, but it doesn’t show any information regarding your network connection or RAM, which is its biggest flaw, in our opinion.
⇒ Get HWMonitor
Moo0 System Monitor – Easily customizable
Moo0 System Monitor is a free and portable tool for monitoring system resources. This tool consists of several graphs that show you all the necessary system information.
Using this tool, you can see CPU usage and temperature, GPU usage and temperature, amount of free memory, HDD temperature, network speed, etc.
If you want, you can also add additional fields to show more information.
The tool supports some customization, and you can change the size of the tool or its transparency. You can also auto-hide this tool after a certain period of inactivity.
The tool also supports many different color schemes, and you can even set the color scheme to change automatically.
Moo0 System Monitor is a great tool, it’s simple and portable, so it will be perfect for both basic and advanced users.
We have to mention that this tool can sometimes take up a lot of space on your screen depending on the number of fields that you have, so keep that in mind.
Overall, Moo0 System Monitor is a great tool, and you should definitely check it out.
⇒ Get Moo0 System Monitor
TaskbarMeters – To quickly identify high resource consumption
Taskbar Meters is a set of applications that allows you to monitor your system resources. There are three applications available, and they all work the same way.
Each application will position itself in your Taskbar, showing your resource usage.
Every application is designed to change color in the Taskbar, so you’ll quickly notice if you’re using too much of your resources.
Using these tools, you can monitor your CPU, RAM, and disk usage, which is more than enough for primary users. Then, if you want, you can adjust the colors or update the frequency of each tool.
We have to mention that these applications use a simple method to display the usage of your system resources.
Unfortunately, using this method, you can’t see the exact numbers, which can be a flaw for some users.
The only flaw of these tools is the lack of ability to show detailed information about CPU, RAM, or disk usage, which can turn away some users.
⇒ Get TaskbarMeters
- Best PC performance monitoring software for Windows 10/11
- Best cloud monitoring & performance tools
- Best bandwidth monitors for Windows 10/11
- Fix: Low system resources on Windows 10/11 [Easy Guide]
How do I check my system performance?
- Open the Performance Monitor, expand Data Collector Sets, and double-click on System under it.
- Right-click on System Performance and select Start.
- This will trigger a 60-second test to analyze the computer’s performance.
- After the period, expand Reports, select System under it, and then double-click on System Performance.
- Now, double-click on the report listed here.
- You can now view the system performance and identify what’s consuming the maximum resources and other critical information.
If you want to monitor system resources, feel free to use any of these tools because they will provide the necessary information.
It is essential to maintain your computer healthy. The first step is to monitor the system resources accordingly, and this list is more than sufficient to provide the best options for everyone and every PC.
You can use the Resource Monitor in Windows 10 for logging data or try the other third-party tools here.
If you found some problems, here’s what you should do if the system runs low on resources on Windows 10/11.
We’d like to hear which of these tools you prefer and why. Use the comments section to get in touch with us.
Still having issues? Fix them with this tool:
SPONSORED
If the advices above haven’t solved your issue, your PC may experience deeper Windows problems. We recommend downloading this PC Repair tool (rated Great on TrustPilot.com) to easily address them. After installation, simply click the Start Scan button and then press on Repair All.
![]()