Введение
В системе Zabbix есть возможность привязать шаблон к серверам и компьютерам на базе Windows. Называется Template OS Windows.
В один прекрасный момент я понял: а неплохо бы еще туда прикрутить кучу счетчиков
Практика «Агента»
Если у Вас установлен Zabbix агент, то общаться мы будем с ОС через него.
При просмотра шаблона Template OS Windows обращаем внимание на элемент данных:
Average disk write queue length perf_counter[234(_Total)1404].
Что же означают эти цифры 234(_Total)1404. ?
В ОС Windows эти цифры обозначают внутренние идентификаторы счетчиков производительности. Но если у Вас установленна база Zabbix с кодировкой UTF8, то ничего не мешает нам использовать русские названия в счетчиках
Получаем счетчики следующим образом:
typeperf -q
А если у нас несколько жестких дисков (интерфейсов и т.п.):
typeperf -qx
Слишком много информации? Фильтруем:
typeperf "Физический диск(_Total)"
Другой вариант получить счетчики:
lodctr /s:perfcount.txt
Открыв файл мы увидем идентификаторы и их название в начале на английском, а затем на русском языке.
Практика SNMP
Но что делать, когда нельзя (или нет желания) установить агент?
Для этого, мы будем читать счетчики через SNMP:
snmpwalk -Of -c public -v 2c 192.168.0.1
Если выполнять под ОС Windows, то результат будет вида:
.iso.3.6.1.2.1.1.1.0 = STRING: «Hardware: Intel64 Family 6 Model 44 Stepping 2 AT/AT COMPATIBLE — Software: Windows Version 6.1 (Build 7601 Multiprocessor Free)»
Если выполнять под ОС Linux, то результат будет вида:
.iso.org.dod.internet.mgmt.mib-2.system.sysDescr.0 = STRING: Hardware: Intel64 Family 6 Model 44 Stepping 2 AT/AT COMPATIBLE — Software: Windows Version 6.1 (Build 7601 Multiprocessor Free)
(Также можно поискать соответствие цифр с названиями на http://support.ipmonitor.com/snmp_center.aspx)
Linux вариант более информативный.
Заключение
Осталось подключить необходмые счетки и можно будет следить за производительностью системы.
Примеры шаблонов:
Agent Windows: http://yadi.sk/d/emnLSQlv1VPxj (Производительность дисковой системы)
SNMP Windows: http://yadi.sk/d/aHcKTrJm1VPyJ (Мониторим сетевой интефейс)
SNMP Printers: http://yadi.sk/d/5lggU-8d1VPyN (Состояние расходников принтеров HP)
Данная статья рассказывает о мониторинге журналов Windows через Zabbix и служит опорой в виде практических примеров, реализованных мной ранее. Важным моментом здесь является не столько сбор данных самого журнала, сколько правильная настройка триггера.

Шаблон или прототип элемента мониторинга будет выглядеть следующим образом (параметры для удобства пронумерованы):
eventlog[1- имя журнала,2-регулярное выражение,3-важность,4-источник,5-eventid,6-макс кол-во строк, 7-режим]
Тип данных: журнал (лог)

Далее рассмотрим конкретные практические примеры.
1. Ошибки в журнале приложений.
Максимально простой пример сбора ошибок в журнале «Приложение» (события уровня «Ошибка»)
eventlog[Application,,"Error",,,,skip]
2. Ошибки отложенной записи.
eventlog[System,,"Warning",,50,,skip]
краткие пояснения:
System — журнал система
Warning — тип события: предупреждение
50 — id события равно 50
skip — берем только свежие значения (не перечитываем весь лог)
триггер:
count(/Terminal server/eventlog[System,,"Warning",,50,,skip],30m)>7 and nodata(/Terminal server/eventlog[System,,"Warning",,50,,skip],60m)<>1
где Terminal server — это просто имя шаблона, в котором используются элемент данных и триггер
3. Ошибки диска.
eventlog[System,,"Warning",,153,,skip]
триггер:
count(/Template OS Windows by Zabbix agent active/eventlog[System,,"Warning",,153,,skip],30m)>5 and nodata(/Template OS Windows by Zabbix agent active/eventlog[System,,"Warning",,153,,skip],60m)<>1
4. ошибки в журнале событий от службы MSSQLSERVER.
eventlog[Application,,"Error","MSSQLSERVER",,,skip]
триггер:
count(/Template OS Windows SQL for 1C/eventlog[Application,,"Error","MSSQLSERVER",,,skip],8m)>0 and nodata(/Template OS Windows SQL for 1C/eventlog[Application,,"Error","MSSQLSERVER",,,skip],10m)<>1
Полезные ссылки:
https://www.zabbix.com/documentation/5.0/ru/manual/config/items/itemtypes/zabbix_agent/win_keys
1
2
Доброго времени суток!
Развернули Zabbix, и почти сразу столкнулись с довольно весомой проблемой.
С машин пользователей в логи (и на почту) валится целая куча мусора, которая не является важной или существенной. К примеру: «Problem started at 16:20:06 on 2020.08.04 Problem name: «sppsvc» (Защита программного обеспечения) is not running (startup type automatic delayed)»
Понятно, что это все можно настроить, вот только как раз с этим проблема и возникла.
За сбор информации сервисов винды отвечает шаблон Template OS Windows by Zabbix agent. Пытаюсь отсечь неугодные мне службы следующим образом:
Макрос: {$SERVICE.NAME.MATCHES}
Значение: ^.*$
Макрос:{$SERVICE.NAME.NOT_MATCHES}
Значение: ^RemoteRegistry|MMCSS|gupdate|SysmonLog|clr_optimization_v.+|clr_optimization_v.+|sppsvc|gpsvc|Pml Driver HPZ12|Net Driver HPZ12|MapsBroker|IntelAudioService|Intel(R) TPM Provisioning Service|dbupdate|DoSvc$ (те самые неважные службы)
Макрос: {$SERVICE.STARTUPNAME.MATCHES}
Значение:^automatic$
Макрос: {$SERVICE.STARTUPNAME.NOT_MATCHES}
Значение: ^manual|disabled$
Но как раз это и не срабатывает. Мусор как валился, так и валится.
Подскажите, что сделано не так? В какую сторону еще копать?
Заранее спасибо.
In this post, we will look at how to install and configure Zabbix Agent on the Windows platform.
1. Download Windows Zabbix Agent
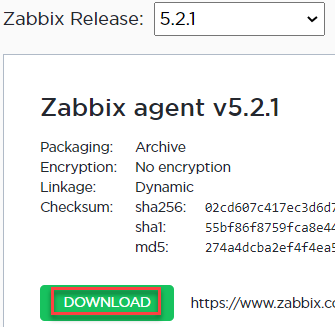
1. Download the Windows Zabbix Agent from officially Zabbix website. Below is an example for x64 machine with no encryption. Here is the direct download link https://www.zabbix.com/download_agents and select the following from the given options.
| OS Distribution | OS Version | Hardware | Zabbix Version | Encryption | Packaging |
| Windows | Any | amd64 | 5.2 | No encryption | MSI |
2. You will see the Zabbix Release options as below and usually, you would go for the latest release and click on download.
3. Downloaded file will be a zip file and unzip the file, you will see the below content.
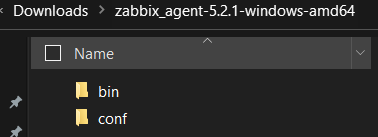
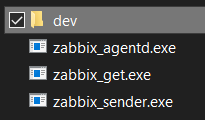
- bin folder has the following files
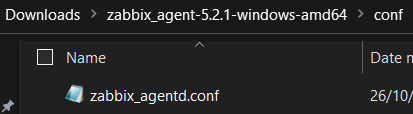
- conf folder has the configuration file
2. Move files on the target endpoint
For this example, my target endpoint is Windows Server 2019 OS (TEKNEX-CA01).
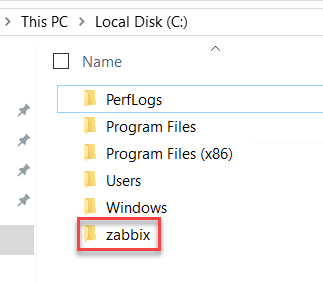
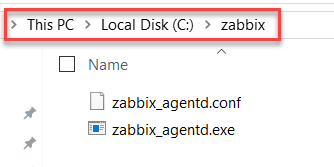
1. Create zabbix folder in the Windows root directory
c:zabbix
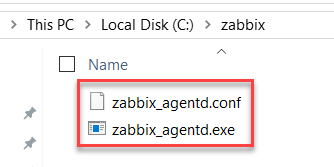
2. Copy below files to newly created zabbix folder
- binzabbix_agentd.exe
- confzabbix_agentd.conf
3. Prepare Windows firewall
By default, Zabbix agent communicates over 10050 port, and I am sticking with the default port.
1. Add port TCP 10050 in the allow list for inbound communication. You could use GUI to achieve this, however, it is easier to run the following PowerShell command. This will add TCP port 10050 in the inbound allow list.
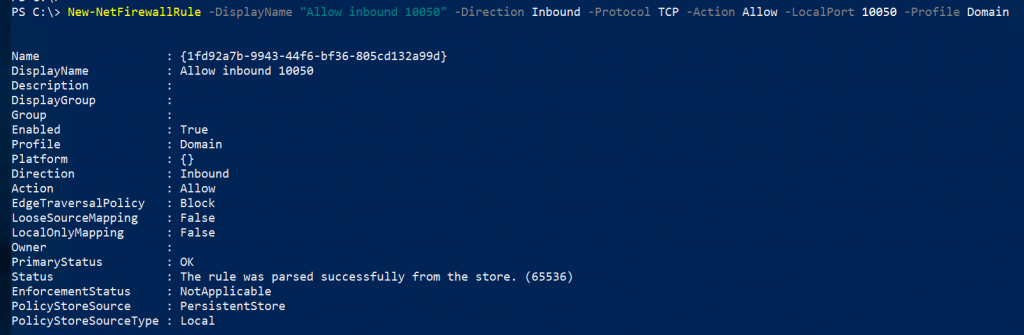
Ensure you apply to the correct profile, TEKNEX-CA01 is part of the domain and this is why I am applying inbound to the Domain profile only. Run the following one-line command in PowerShell as administrator.
New-NetFirewallRule -DisplayName "Allow inbound 10050" -Direction Inbound -Protocol TCP -Action Allow -LocalPort 10050 -Profile Domain
To add this firewall rule to all profiles, you can use the following command. This command will allow inbound port 10050 on Domain, Private and Public profile.
New-NetFirewallRule -DisplayName "Allow inbound 10050" -Direction Inbound -Protocol TCP -Action Allow -LocalPort 10050 -Profile Any
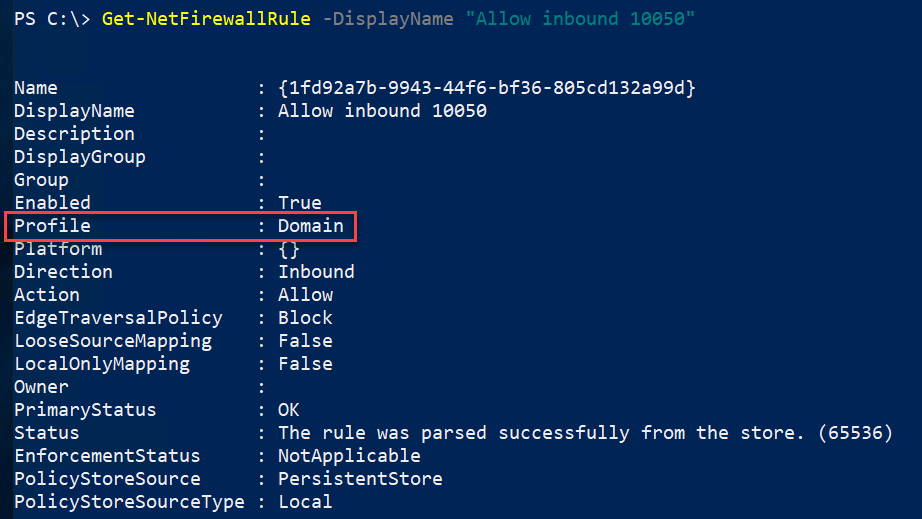
2. Confirm the rule has been added by running the following command.
Get-NetFirewallRule -DisplayName "Allow inbound 10050"
4. Update Zabbix configuration file
Open zabbix_agentd.conf with any editor, even Windows built-in notepad will do the job. Uncomment the following and update accordingly. Save the file once you make changes.
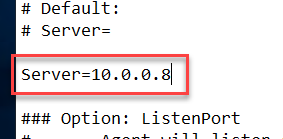
- Server
Provide Zabbix server IP address
- ListenPort
Keep this default as 10050, unless you changed it

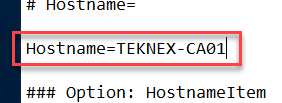
- Hostname
Enter the hostname if your Zabbix does not resolve the hostname to IP address. If your DNS is functioning correctly, you can use the variable system.name. To keep things simple, I will just provide hostname manually.
5. Install and Start Zabbix service
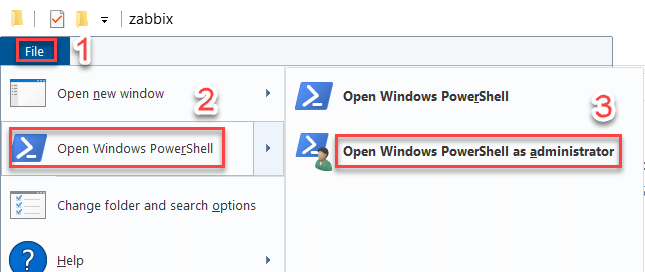
1. Browse to zabbix folder on Windows endpoint
2. Select File in the Navigation pane > hover over Windows PowerShell > click Open Windows PowerShell as administrator
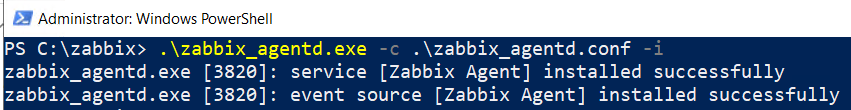
3. Run the below command to install Zabbix.
PS C:zabbix> .zabbix_agentd.exe -c .zabbix_agentd.conf -i
You will see this message when you run the above command
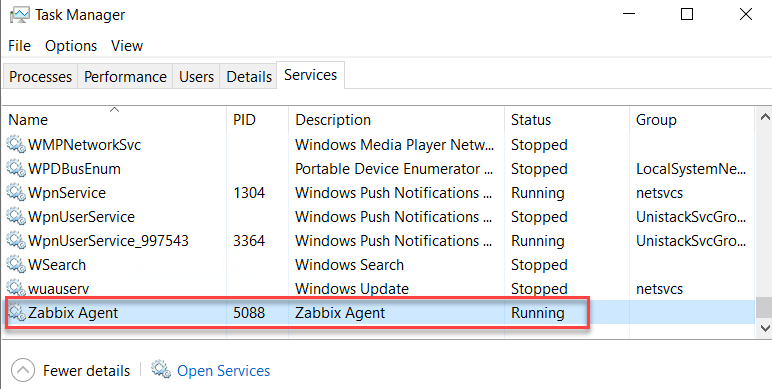
4. Run the following command to start Zabbix service or you could start the service from the Task Manager

4. Verify Zabbix agent service in the Task Manager
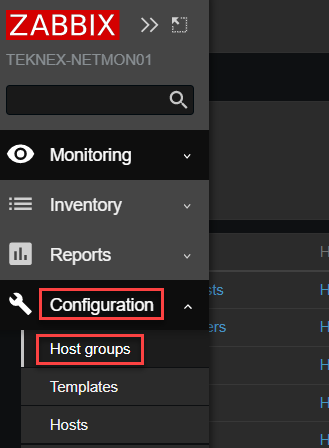
6. Create a new Group on Zabbix Server
To add a host, we need to create a host group first. If you already have a group then you can skip this part.
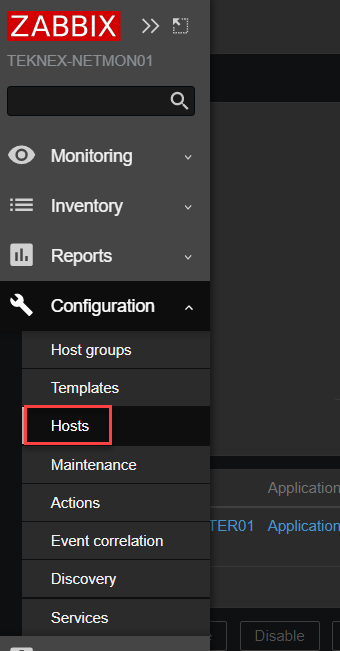
1. Login to Zabbix front end > Extend Configuration > Click on Host groups
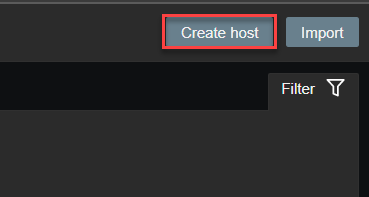
2. Click on Create host group on the top right hand corner
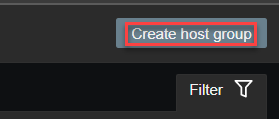
3. Give a name to new host group and click Add

7. Add a host on Zabbix Server
1. Login to Zabbix front end > Extend Configuration > Click on Hosts
2. Click on Create host on the top right hand corner
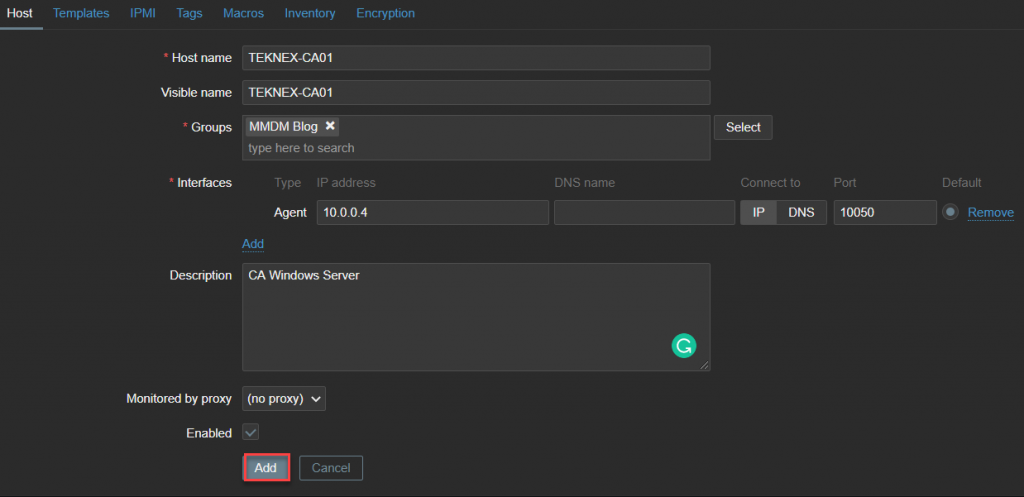
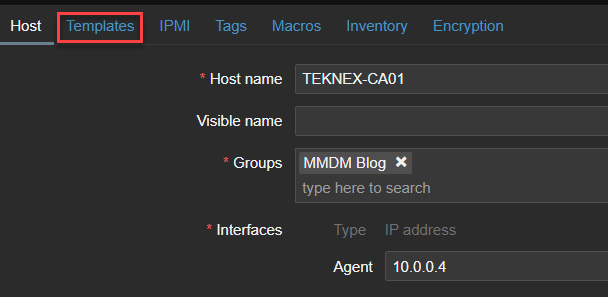
3. Enter the following information and click on Add
| Host name | TEKNEX-CA01 | This must match the Zabbix conf file. |
| Visible Name | TEKNEX-CA01 | This can be anything meaningful. |
| Groups | MMDM Blog | |
| Agent IP Address | 10.0.0.4 | The IP address of the endpoint TEKNEX-CA01. |
| DNS name | Leave it blank | FQDN of the endpoint. In my case, it could be TEKNEX-CA01.TEKNEX.LOCAL. |
| Connect to | IP | Zabbix server will connect to agent via IP address. |
| Port | 10050 | This must match the Zabbix conf file. 10050 is the default. |
| Description | Add something meaningful | |
| Monitored by proxy | no proxy | |
| Enabled | Checked | Keep this option checked |
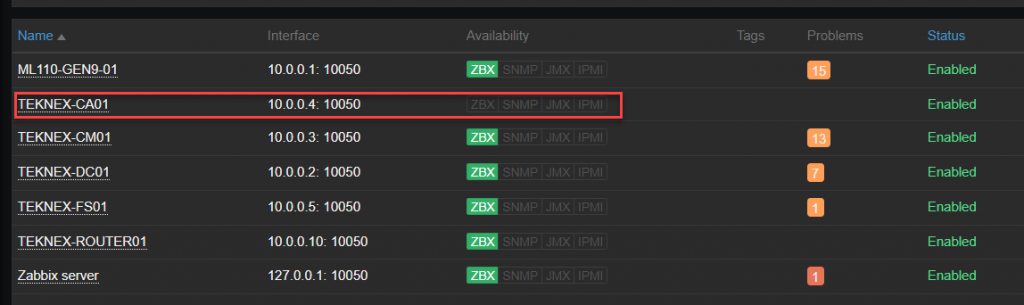
You will see something like following once you add a host under Configuration > Hosts
8. Link a template with the host
A host must have a template linked so that Zabbix Agent can report back to Zabbix Server with the requested data. In this step, let’s link a template with our newly added host TEKNEX-CA01.
1. Go to Configuration > Hosts
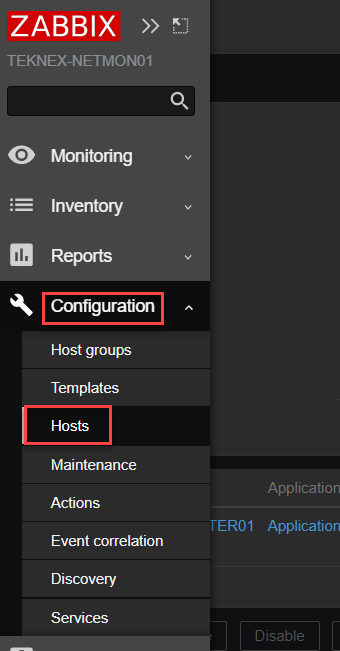
2. Click on newly added host TEKNEX-CA01

4. On the TEKNEX-CA01 host page, click on Templates
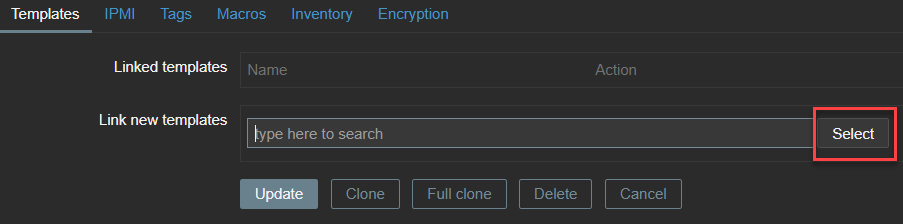
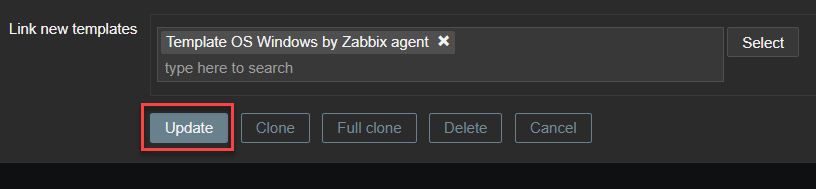
5. Next to Link new templates click on select
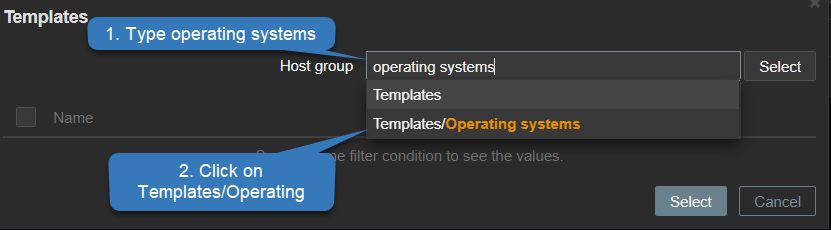
6. In the Host group search, type operating systems and click on Templates/Operating Systems
7. Check Template OS Windows by Zabbix Agent and click on Select
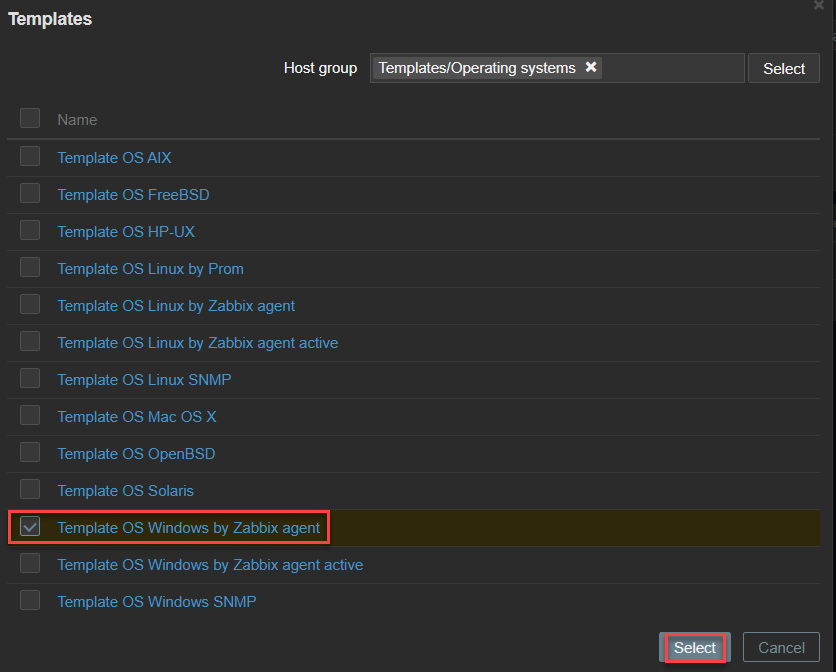
8. Click on update to save changes
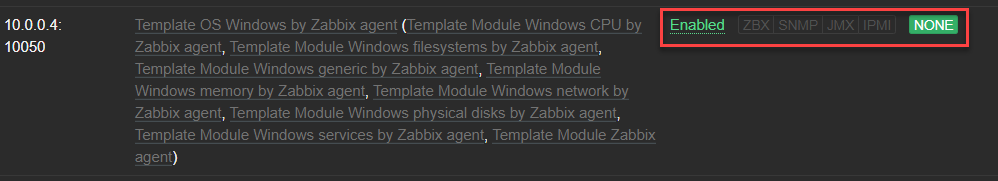
9. Check availability
It can take a couple of minutes for the Zabbix server to initiate an initial communication with the endpoint. Once you attach a template, communication might not start straight away and you will see something like below under Configuration > Hosts
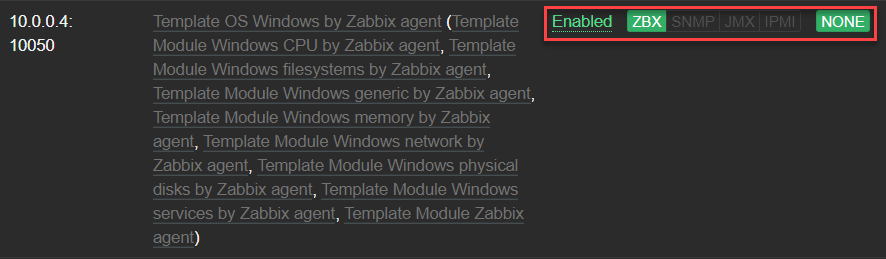
Once the communication has initiated, ZBX will turn into green and you would see something like below.
10. Troubleshooting
If you have waited long enough and ZBX did not turn into green, this indicates that there is something not right. Check the following:
- Inbound port 10500 is opened for the required profile. In the above example, I used Domain Profile because the endpoint is part of a domain.
- Ping endpoint from the Zabbix server and it should ping successfully
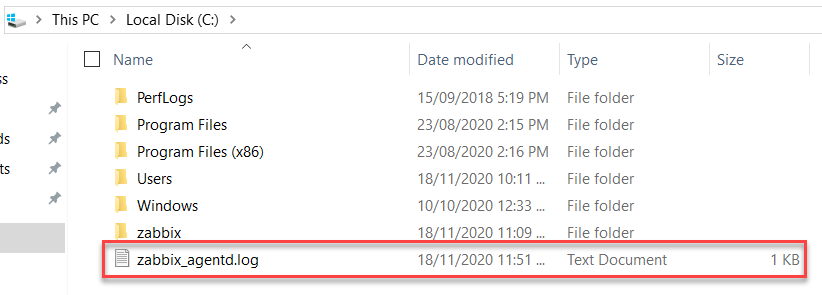
- Check the log file on the endpoint located in the Windows root directory and it can indicate you if there is an issue
Your feedback is very important. Let me know how did you go in the comments below.
Liked it? Take a second to support Jay Singh on Patreon!

In this tutorial, I will show you how to install Zabbix agent for Windows server using an MSI Installer package and how to monitor Windows server with Zabbix monitoring system.
Using this guide you can monitor almost the entire Windows OS family: Windows server 2012 R2, Windows Server 2016, Windows Server 2019, Windows 10, Windows 8 and Windows 7.
Installation is quite simple, just download and install the Zabbix agent MSI installer following steps 1 and 2, but if you want to learn more, read the full guide.
In short, Zabbix agent is a lightweight application that can collect various performance data from the operating system – such as CPU, memory, disk, and network interface utilization – and forward it to a central point (server) for storage and visualization. It runs on any modern operating system and is very flexible because its functionality can be extended with scripts and modules.
You can read more about the Zabbix agent on the Zabbix official site and if you stumbled on this tutorial by accident and you never heard of the Zabbix monitoring system, then stop whatever you doing and install it on your favorite Linux distribution in less than 10 minutes: CentOS/RHEL, Ubuntu, Debian, Rasberry Pi.
Need help with installing Zabbix agent on Linux OS? Check out this guide:
Zabbix Agent (Linux): Install on Ubuntu, CentOS, RHEL, Debian, etc.
Step 1: Download Zabbix Agent Installer for Windows (msi)
In this tutorial, I will use the latest Zabbix agent 5.0.2 LTS version, that version is compatible with Zabbix server 5.x or newer.
| Windows Zabbix Agent v1 LTS v6.0.x | Download: 64-bit or 32-bit |
| Windows Zabbix Agent v2 LTS v6.0.x (recommended) | Download: 64-bit or 32-bit |
I always recommend using the latest LTS version to take full advantage of new features and improved performance so make sure to download installer zabbix_agent2-6.0.7-windows-amd64-openssl.msi for 64-bit Windows or zabbix_agent2-6.0.7-windows-i386-openssl.msi for 32-bit Windows.
And don’t try to install a 32-bit package on 64-bit Windows because it won’t work!
Step 2: Install Zabbix Agent on Windows using MSI installer
I will install Zabbix Agent on Windows server using installation wizard but if you prefer command-line based installation check out section “Install Zabbix agent via Windows command-line (CMD)”
Just to make clear, in this tutorial I will use Zabbix server with IP address 192.168.5.43 to monitor Windows machine called w01services with IP address 192.168.5.22.
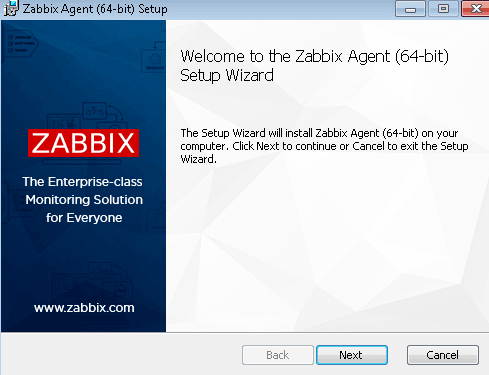
Double click on Zabbix MSI installer that you have downloaded in the previous step and click “Next” just as shown in the image below.
Accept the terms and click the “Next” button.

Define custom “Host name” or use fully qualified domain name (FQDN) of the Windows machine in the “Host name” field. Then enter IP address of the Zabbix server under “Zabbix server IP/DNS” and “Server or Proxy for active checks” field and you are done.
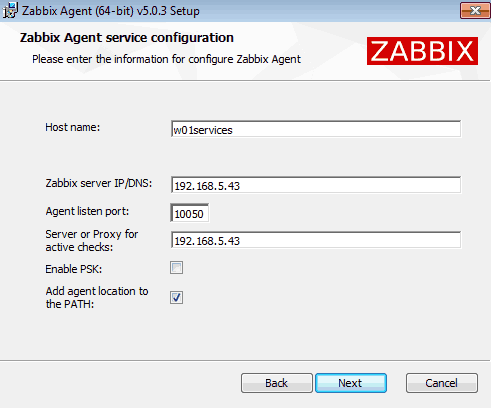
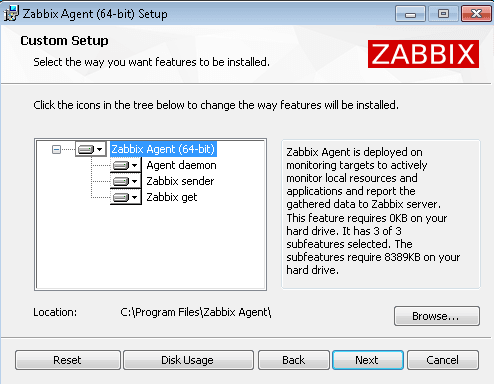
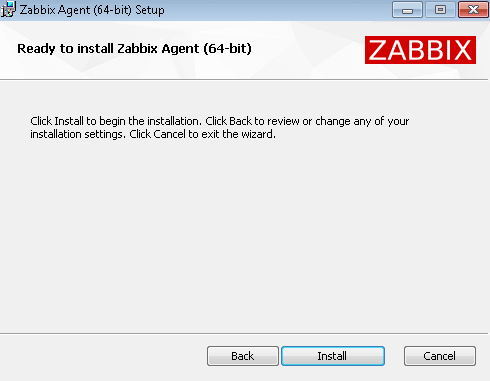
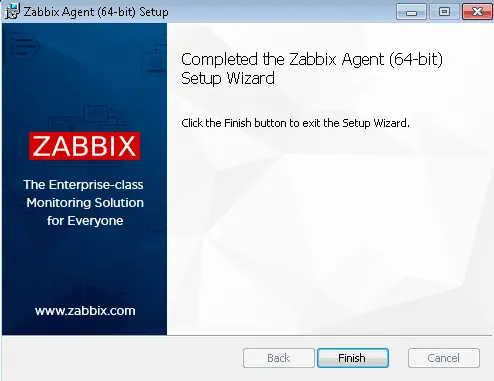
Select “Add agent location to the PATH” and go through the rest of the installation by clicking “Next“, “Install” and “Finish“.
You don’t need to configure Windows firewall manually because the MSI installer will automatically add a firewall rule to permit Zabbix TCP port 10050.
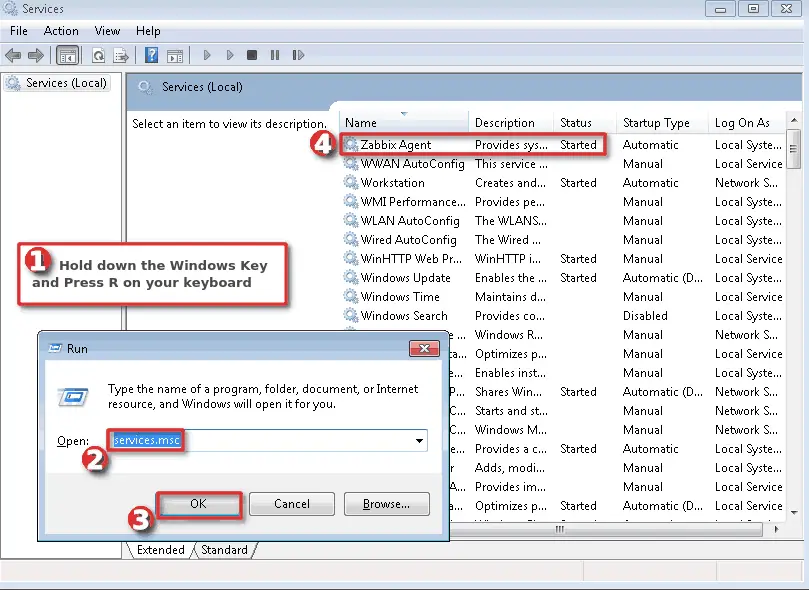
Finally, we need to check that the Zabbix agent is up and running.
Hold down the “Windows key” and press “R” on the keyboard, type “services.msc“, press “OK” and check the “Status” column for “Zabbix Agent” service exactly as shown in the picture below. Status should be “Started” if the installation was successful.
WELL DONE!
You have successfully installed and configured Zabbix agent on Windows OS!
Now it’s time to add that Windows host to Zabbix monitoring system.
Step 3: Add Windows host to Zabbix monitoring system
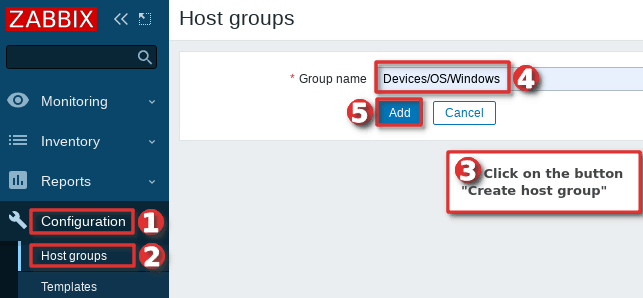
You can add a host to existing host group or you can create a new host group for your Windows servers. I will create host group “Devices/OS/Windows“ using “Host groups” option under “Configuration” section on the Zabbix frontend. Click “Create host group” button, define “Group name” and click “Add” (you only need to create host group once):
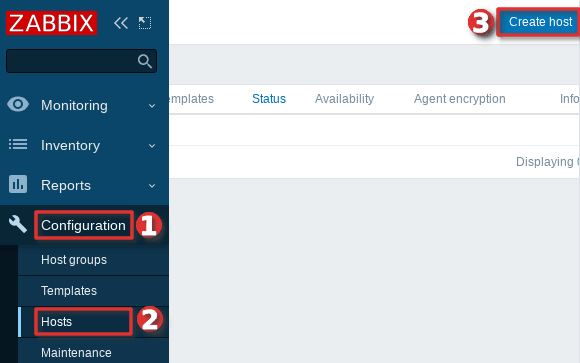
Navigate to “Host” menu under “Configuration” tab and then click “Create host” option to create a host in Zabbix:
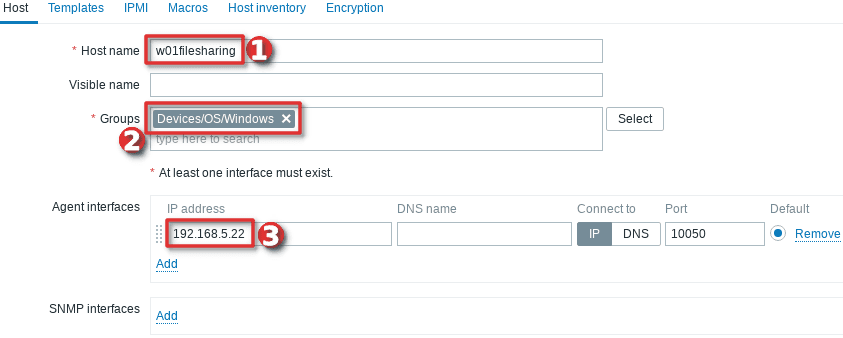
Define “Hostname” and set “Groups” using your newly created host group. Then set the IP address of the Windows server under “Agent interfaces” section
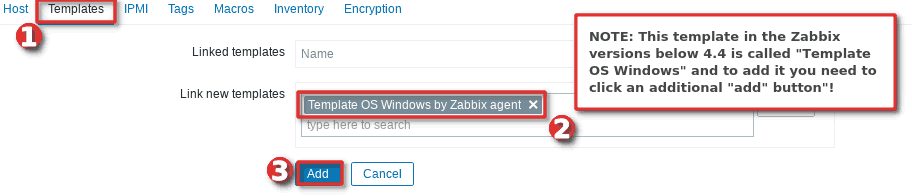
Switch to tab “Templates” and choose the “Template OS Windows by Zabbix agent” template under section “Link new template” by typing “OS Windows …”.
And you’re done! If you are interested in automating this whole process of adding Windows hosts to Zabbix see the section “Configure auto registration for Windows Zabbix agents“
Note that in this tutorial I m using a template “Template OS Windows by Zabbix agent” that can only monitor passive Zabbix agents. However, if you want to monitor your host using Zabbix agents in active mode use a template called “Template OS Windows by Zabbix agent active“. Check out the section “Understanding Active vs Passive Zabbix Agent mode” to learn more about the differences between the active and passive agent mode.
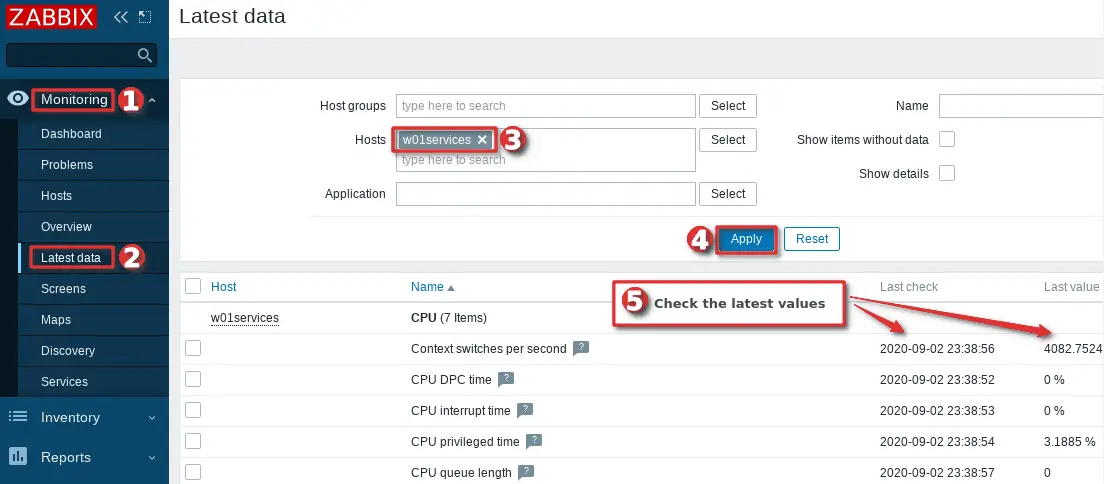
Step 4: Check if Zabbix Agent is working correctly
You can check that the Zabbix agent is working properly by using the “Latest Data” option on the Zabbix frontend. Wait up to 5 minutes after you have installed and started Zabbix agent to allow for data to be collected. Look at columns “Last check” and “Latest value” and if they are updating then the agent is working.
Your agent should be working and collecting data by now, but if you experience any problems, restart Zabbix agent service and check the log “C:Program Fileszabbixzabbix_agentd.log“. And if there is nothing unusual in the log file then check the firewall – make sure that TCP port 10050 on the host (where Zabbix agent is installed) and TCP port 10051 on the Zabbix server side are open.
CONGRATULATIONS!
You have successfully installed Zabbix Agent and your Windows server is being monitored!
No need to do anything else as other steps are optional!
CONTINUE TO LEARN MORE:
How to manage Zabbix agent service on Windows
Auto registration of Zabbix agents (Windows OS)
Learn how to Secure Zabbix Agent
Alternative Zabbix agent installation via Windows command-line (CLI)
Understanding Active vs Passive Zabbix Agent mod
Step 5: Restart Zabbix Agent service on Windows
In the previous steps, we learned how to check the status of Zabbix agent service using the “services.msc” option, and now we will learn how to use the command line interface (CMD) to stop or start the agent and check its status.
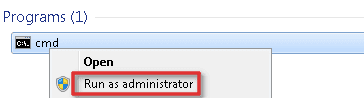
Click on “Windows Start” button and type “cmd” in the search bar, right-click on “cmd” icon and select option “Run as administrator” and use these commands to start/stop the agent:
net stop "Zabbix Agent"
net start "Zabbix Agent"
And to check Zabbix agent service status use the command:
sc query "Zabbix Agent" | findstr /i "STATE"
You should get status “RUNNING” if the Zabbix agent is up and running!
Step 6: Configure auto registration for Windows Zabbix Agents
Adding one or two hosts to Zabbix manually is not a big problem. However, what if you need to add more servers to Zabbix? Or you just want to automate that tedious process of adding Windows hosts to Zabbix and linking them with the correct template and host group?
Don’t worry, you don’t have to write the script because Zabbix has a tool called “Auto registration”.
Before we configure Zabbix frontend, make sure that all of your Zabbix agents have “HostMetadata=Windows” line in their configuration file (default path: “C:Program Fileszabbixzabbix_agentd.conf“). And if that line does not exist, add it and restart the Zabbix Agent afterward. You can automate that via CLI like this:
echo HostMetadata=Windows >> C:"Program Files"zabbixzabbix_agentd.conf
net stop "Zabbix Agent"
net start "Zabbix Agent"
In the future always install the Zabbix agent on Windows with the “HostMetadata=Windows” parameter if you are planning to use the auto-registration feature!
Now that we’ve clarified that let’s configure auto-registration on the Zabbix frontend.
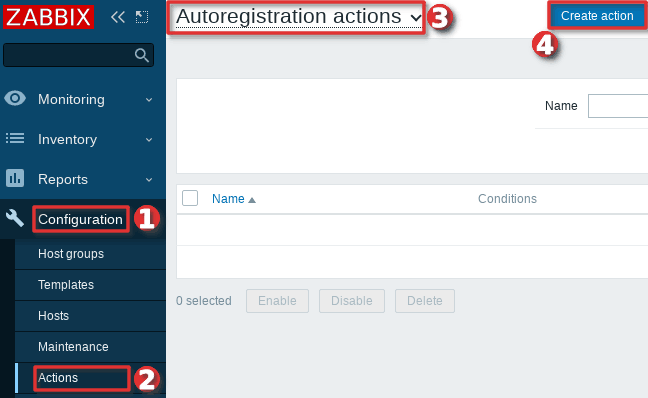
Go to the “Actions” tool under the “Configuration” section, then select “Auto registration” from the dropdown menu and click the “Create action” button.
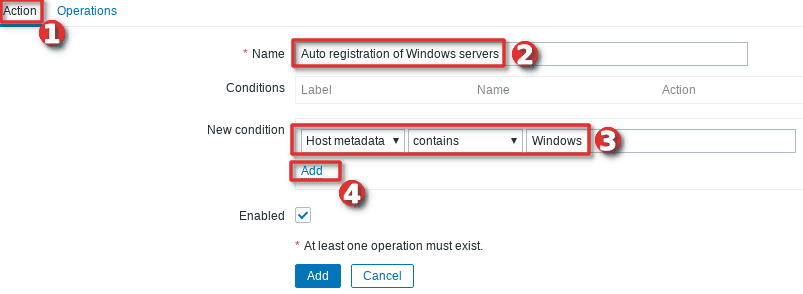
On the “Action” tab define the “Name” of the action and add a “New condition” that will check if the “Host metadata” contains the word “windows”.
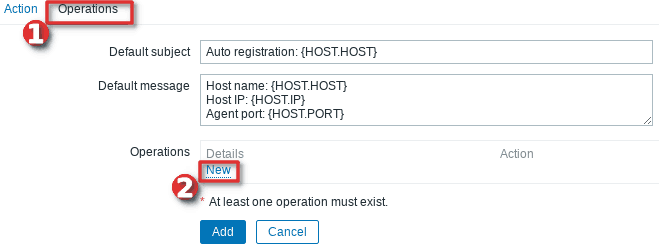
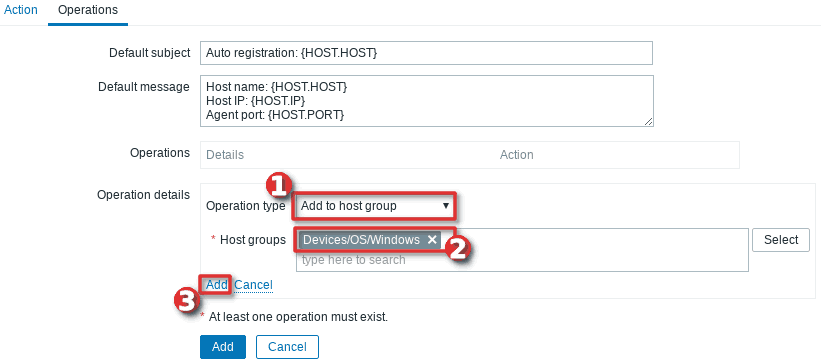
Then, change tab to “Operations” and add new operation.
Define “Operation type” as “Add to host group” and then select to which “Host groups” will Windows hosts be added when discovered. In my case, I will use my custom host group called “Devices/OS/Windows“.
After that, you need to add a new operation by setting “Link to the template” as “Operation type” and then select which templates will be linked with the newly discovered Windows hosts. In my example, I will use template “Template OS Windows by Zabbix agent” (passive checks)
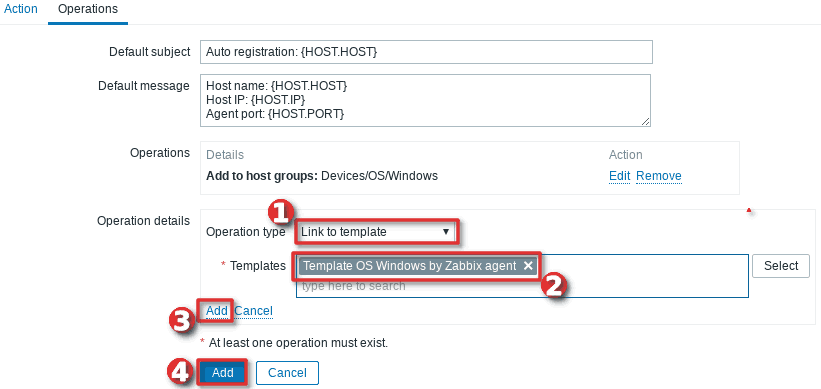
Well done! Auto-registration is configured. Wait a few minutes and your Windows server should appear in Zabbix. From now on, every time you install a Zabbix agent on a Windows server, it will automatically be added to the Zabbix and linked with the appropriate host group and template.
Note, that you can add anything you want to the “HostMetadata” parameter. For example, you can have a host that has in Zabbix agent configuration file defined “HostMetadata=Windows:Tomcat:Prod” or another with “HostMetadata=Windows:MSSQL:Test“. For the first host, you can configure auto-registration to add to host groups: “Windows”, “Web servers” and “Production servers” and to link templates that can monitor Windows and Tomcat server. And the second host can be added to host groups: “Windows”, “Databases”, and “Test servers” and linked with templates that can monitor Windows server and Microsoft SQL database.
Using PSK encryption on the Zabbix agents? Then there is one more step left, you need to add your PSK identity and PSK key using the “Auto Registration” option under the “Administration“→”General” section just as shown in the image below:
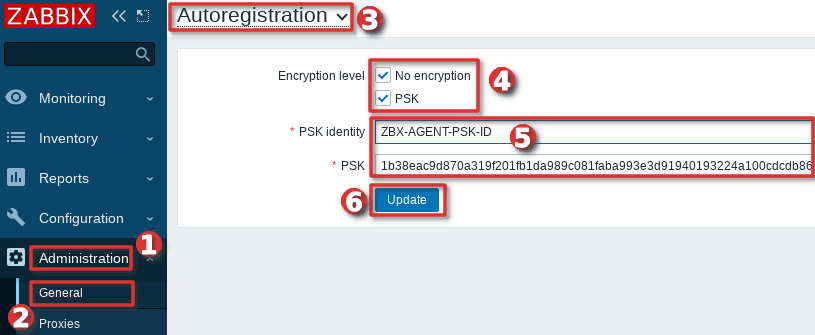
From now on, during the auto registration process, Zabbix will configure provided PSK identity and key on each registered host.
Step 7: Configure PSK encryption on Zabbix Agent (Windows)
Zabbix supports encrypted communications between Zabbix server and Zabbix agent using Transport Layer Security (TLS) protocol v.1.2. You can use certificate-based and pre-shared key-based encryption (PSK), but in this tutorial we will configure PSK encryption.
In this step, I will show you how to configure PSK encryption on an already installed Zabbix agent, but keep in mind that all of these configurations can be configured during the installation
a. Generate PSK key
Generate 256-bit (32 bytes) PSK key with openssl command on Zabbix server (or use some other tool on Windows):
$ openssl rand -hex 32
1b38eac9d870a319f201fb1da989c081faba993e3d91940193224a100cdcdb86
On Windows server, create a new text file “ZabbixAgentPSK.txt” in the default Zabbix agent installation folder (“C:Program Fileszabbix“) and put that PSK key in the first line of the file. Don’t forget to save the file before closing.
b. Configure Zabbix agent to support PSK encryption
Open “C:Program Fileszabbixzabbix_agentd.conf” file with text editor (Notepad++) and add this configuration anywhere in file:
TLSConnect=psk
TLSAccept=psk
TLSPSKFile=C:Program FileszabbixZabbixAgentPSK.txt
TLSPSKIdentity=ZBX-AGENT-PSK-ID
Save and exit file. Keep in mind that “TLSPSKIdentity” can be anything, so for security reasons set something else – don’t use mine!
Don’t forget to restart Zabbix agent service after changing the configuration file!
c. Enable PSK encryption on the agent in Zabbix frontend
Communication between Zabbix agent and server is not yet encrypted because we have enabled PSK encryption on the agent side but not on the server side.
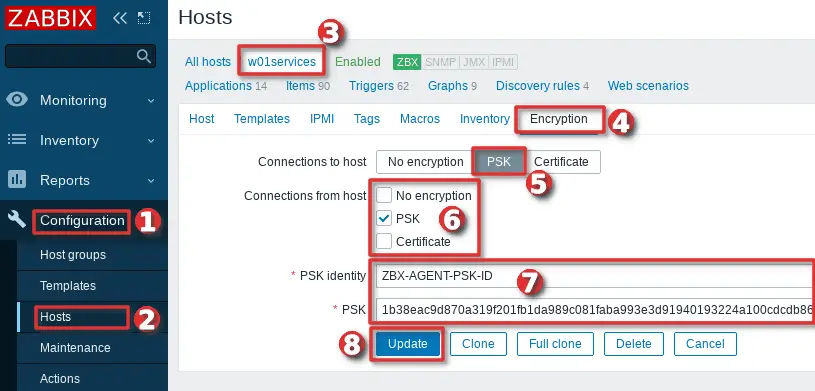
We need to enable encryption on the server side so go to web frontend and select your “Hosts” tab under the “Configuration” section and find and click on your Windows hosts.
On the “Encryption” tab set PSK under “Connections from hosts” option and copy/paste “PSK identity” and “PSK” (key) that is configured on the Zabbix agent.
When you are done with configuration click the “Update” button just as shown in the image below.
Keep in mind, that you can automate the configuration of the host encryption (PSK) on the frontend using the Zabbix auto registration process.
Step 8: Install Zabbix agent via Windows command-line (CMD)
This step is for those who prefer command-line based installation instead of wizard-based installation.
a. Run CMD as administrator
Click on “Windows Start” button and type “CMD” in the search bar, right-click on “cmd” and select option “Run as administrator“:
b. Download Zabbix agent
Download installer zabbix_agent2-6.0.7-windows-amd64-openssl.msi for 64-bit Windows or zabbix_agent2-6.0.7-windows-i386-openssl.msi for 32-bit Windowsand save it on a “C:” disk or somewhere else.
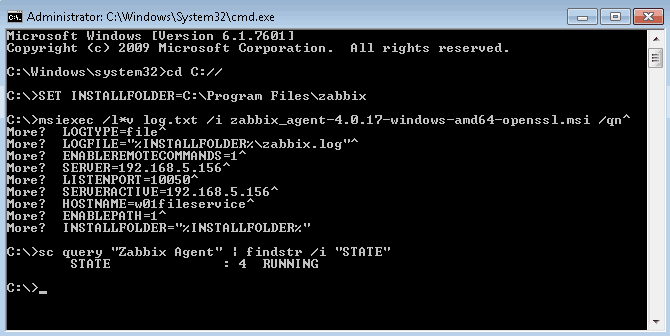
c. Change directory and set installation folder
Change directory to the path where you have downloaded the MSI file and set the installation folder with commands:
cd C://
SET INSTALLFOLDER=C:Program Fileszabbix
d. Install Zabbix agent using msiexec
Here is an example of Zabbix agent installation that will work for most people, just change parameteres “SERVER“, “SERVERACTIVE” and “HOSTNAME” to suit your enviroment.
msiexec /l*v log.txt /i zabbix_agent2-6.0.7-windows-amd64-openssl.msi /qn^
LOGTYPE=file^
LOGFILE="%INSTALLFOLDER%zabbix.log"^
SERVER=192.168.5.156^
LISTENPORT=10050^
SERVERACTIVE=192.168.5.156^
HOSTNAME=w01fileservice^
ENABLEPATH=1^
INSTALLFOLDER="%INSTALLFOLDER%"
Check “Zabbix agent” service status with the command:
sc query "Zabbix Agent" | findstr /i "STATE"
If the Zabbix agent is up and running then the status should be “RUNNING“.
Note, if you are planning to use the auto-registration feature don’t forget to add “HostMetadata=Windows” parameter to “zabbix_agentd.conf” and restart Zabbix agent afterward because Zabbix CLI installation doesn’t support “HostMetadata” parameter:
echo HostMetadata=Windows >> C:"Program Files"zabbixzabbix_agentd.conf
net stop "Zabbix Agent"
net start "Zabbix Agent"
e. Example of Zabbix agent installation with additional options
You can set almost any Zabbix agent parameter during installation, here is one example of an installation where many parameters are used.
SET INSTALLFOLDER=C:Program Fileszabbix

msiexec /l*v log.txt /i zabbix_agent2-6.0.7-windows-amd64-openssl.msi /qn^
LOGTYPE=file^
LOGFILE="%INSTALLFOLDER%zabbix.log"^
SERVER=10.10.10.162^
LISTENPORT=10055^
SERVERACTIVE=10.10.10.162^
HOSTNAME=cmr_server^
TLSCONNECT=psk^
TLSACCEPT=psk^
TLSPSKIDENTITY=CompanyPSKID^
TLSPSKFILE="%INSTALLFOLDER%company_key.psk"^
TLSCAFILE="c:tempfile1.txt"^
TLSCRLFILE="c:tempfil2.txt"^
TLSSERVERCERTISSUER="Company CA"^
TLSSERVERCERTSUBJECT="Company Cert"^
TLSCERTFILE="c:tempfile4.txt"^
TLSKEYFILE="c:tempfile5.txt"^
ENABLEPATH=1^
INSTALLFOLDER="%INSTALLFOLDER%"
SKIP=fw
Parameter “SKIP=fw” means that the firewall exception rule will not be added. Explanations of other parameters can be found in the official Zabbix documentation section Zabbix Agent (Windows).
Step 9: Understanding Active vs Passive Zabbix Agent mode
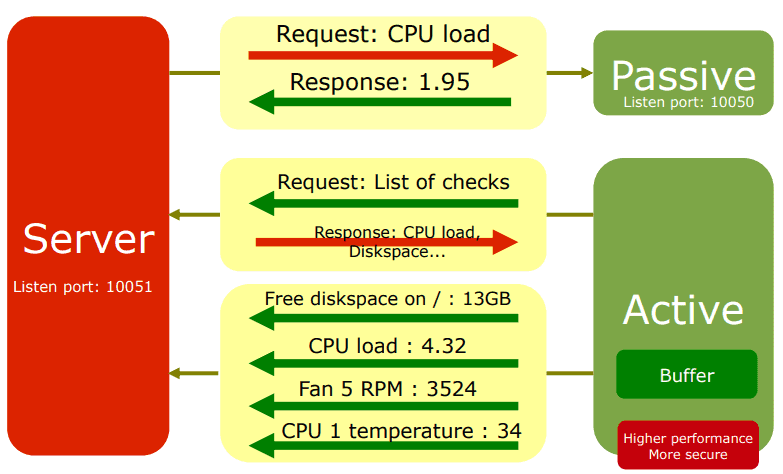
When using a Zabbix agent in active mode, it will connect to the Zabbix server via port 10051 to retrieve configuration and send data. This is a great feature that allows an active Zabbix agent to work behind the firewall and to offload the Zabbix server in large environments.
On the other hand, if you use a Zabbix agent in passive mode Zabbix server will initiate a connection via port 10050 and retrieve data from the agent. The Zabbix server will do this for every metric (item) every few minutes – which is very inefficient! Because of this, active mode is more recommended.
An additional advantage of the Zabbix agent in active mode is that it can read logs from the device and that is not possible if the Zabbix agent is used in passive mode.
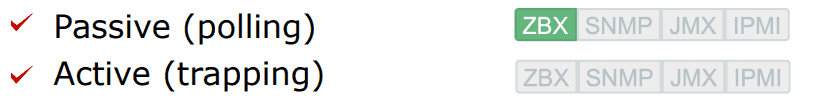
You can detect on Zabbix host if the agent is working in active or passive mode. Passive mode will show red or green “ZBX” icon in the agent status bar and active mode will show grey “ZBX” icon:
Learn how to setup Zabbix email notifications and escalations in a few minutes!

Несколько шаблонов для Zabbix для мониторинга Windows
По следам заметок о ZABBIX- свободная система мониторинга и отслеживания статусов разнообразных сервисов компьютерной сети, серверов и сетевого оборудования.
В системе Zabbix есть возможность привязать шаблон к серверам и компьютерам на базе Windows. Называется Template OS Windows.
В один прекрасный момент я понял: а неплохо бы еще туда прикрутить кучу счетчиков
Что-то похожее про счетчики производительности в microsoft windows уже писал Typeperf — выводим данные о производительности Microsoft Windows Server,Windows Xp
Практика «Агента»
Если у Вас установлен Zabbix агент, то общаться мы будем с ОС через него.
При просмотра шаблона Template OS Windows обращаем внимание на элемент данных:
Average disk write queue length perf_counter[234(_Total)1404].
Что же означают эти цифры 234(_Total)1404. ?
В ОС Windows эти цифры обозначают внутренние идентификаторы счетчиков производительности. Но если у Вас установлена база Zabbix с кодировкой UTF8, то ничего не мешает нам использовать русские названия в счетчиках.
Получаем счетчики следующим образом:
typeperf -q
А если у нас несколько жестких дисков (интерфейсов и т.п.):
typeperf -qx
Слишком много информации? Фильтруем:
typeperf "Физический диск(_Total)"
Другой вариант получить счетчики:
lodctr /s:perfcount.txt
Открыв файл мы увидем идентификаторы и их название в начале на английском, а затем на русском языке.
Практика SNMP
Но что делать, когда нельзя (или нет желания) установить агент?
Для этого, мы будем читать счетчики через SNMP:
snmpwalk -Of -c public -v 2c 192.168.0.1
Если выполнять под ОС Windows, то результат будет вида:
.iso.3.6.1.2.1.1.1.0 = STRING: «Hardware: Intel64 Family 6 Model 44 Stepping 2 AT/AT COMPATIBLE — Software: Windows Version 6.1 (Build 7601 Multiprocessor Free)»
Если выполнять под ОС Linux, то результат будет вида:
.iso.org.dod.internet.mgmt.mib-2.system.sysDescr.0 = STRING: Hardware: Intel64 Family 6 Model 44 Stepping 2 AT/AT COMPATIBLE — Software: Windows Version 6.1 (Build 7601 Multiprocessor Free)
(Также можно поискать соответствие цифр с названиями на http://support.ipmonitor.com/snmp_center.aspx )
Linux вариант более информативный.
Заключение
Осталось подключить необходмые счетки и можно будет следить за производительностью системы.
Примеры шаблонов:
Agent Windows: http://yadi.sk/d/emnLSQlv1VPxj (Производительность дисковой системы)
SNMP Windows: http://yadi.sk/d/aHcKTrJm1VPyJ (Мониторим сетевой интефейс)
SNMP Printers: http://yadi.sk/d/5lggU-8d1VPyN (Состояние расходников принтеров HP)
Взято с Хабрахабр

Серверное программное и аппаратное обеспечение совершенствуется каждый день, но всегда есть вероятность сбоев.
Какой бы идеальной и отлаженной ни была система, нужно быть готовым ко всему. Сидеть перед монитором и следить за показателями 24/7, конечно можно, но зачем, если всё автоматизируется.
В данной статье я расскажу и покажу, как настроить удаленный мониторинг сервера с помощью Telegram и Zabbix.
Что для этого нужно?
- Скачайте и установите дистрибутив Zabbix сервер по ссылке https://www.zabbix.com/ru;
- Рабочий сервер должен быть 1С;
- Скачайте на сервер Zabbix agent;
- Зарегайте Telegram аккаунт.
Установка Zabbix Agent
Заходим на сервер 1С, у меня используется Windows Server 2016, затем на официальный сайт Zabbix и скачиваем Agent для сервера.
Важно! Верcия Agenta должна совпадать с вашим сервером Zabbix.

Выбираем: Windows, Any, amd64, 5.0 LTS, OpenSSL, MSI.
Запускаем скачанный дистрибутив.

В окне настройки прописываем Host name сервера 1С, в строке Zabbix server IP/DNS указываем адрес Zabbix сервера, нажимаем далее и начинаем установку.

После того как Agent установлен на ваш сервер, нужно проверять его работоспособность и выполнение.
Запускаем “Службы” и смотрим статус Zabbix Agent.

При правильной установке состояние приобретет значение “выполняется”, а тип запуска будет автоматическим.
После этого приступаем к добавлению мониторинга на сервер 1С.
Включение мониторинга на сервере Zabbix
Заходим на web-интерфейс вашего Zabbix сервера: “Настройка” — “Узлы сети”.
Нажимаем “Создать узел сети”.

- “Имя узла сети” и “Видимое имя” пишем 1cBitFinans;
- В группах выбираем “Discovered hosts”;
- В строке IP адрес агента указываем ip вашего 1С сервера.

После этого переходим во вкладку “Шаблоны”.

Необходимо выбрать и присоединить шаблон “Template OS Windows by Zabbix agent”.
После этого нажимаем синюю кнопку “Добавить” и ваш узел сети будет уже создан.
Чтобы убедиться, что ваш сервер уже стоит на мониторинге и все прошло успешно, заходим в “Настройки”, “Узлы сети”. У вас должен появиться добавленный узел сети 1cBitFinans.
После того как вы добавили новый узел сети должен загореться зеленый статус доступности ZBX. Обычно добавление и изменение статуса на ZBX занимает от 5 до 10 минут. Как только нужный вам статус загорится — мониторинг работает исходя из стандартных шаблонов.
По умолчанию на мониторинге будет стоять почти все, что есть на сервере.
- Службы;
- Состояние нагрузки на CPU;
- Загруженность памяти на диске;
- Сетевые интерфейсы;
- Питание;
- Утилизация ОЗУ.

На данном этапе внедрения мониторинга все основные шаблоны подключены и если зайти во вкладку “Мониторинг” и выбрать“Панель”, установив нужные виджеты, будут отображаться все проблемы, возникающие с вашим сервером.

Большинство пользователей на этом этапе делают остановку, выводят панель на экран для мониторинга и наблюдают за происходящим. Но этот способ не подойдёт для круглосуточного контроля, потому что не будет возможности отойти от компьютера.
Каждый сейчас пользуется каким-то мессенджером и туда удобно получать оповещения о состоянии системы. Наиболее удобен в этом плане Telegram.
Установка важности триггеров
Для начала правильно расставляем приоритеты критичности ошибок, чтобы установить уведомления только на важные.
Заходим “Настройки”(1), “Узлы сети”(2), из списка нажимает на сервер “1сBitFinans”(3), после этого переходим на вкладку “Элементы данных”(4).
В данной вкладке по умолчанию шаблон, который вы установили. Он включит мониторинг всех данных на сервере. Чтобы не отвлекаться на уже известные проблемы, отключите мониторинг определенных служб, мониторинг загруженности CPU.

Во вкладке “Триггеры”, видно, какие триггеры будут срабатывать при той или иной проблеме на сервере. Их также можно отключить по необходимости. Проверено на личном опыте, что Zabbix предлагает неправильно расставленные критичности того или иного триггера.

Поэтому нажимаем на название нужного триггера и меняем его важность на ту, которая необходима. Нажимаем “Обновить” и все готово.

Настройка отправки уведомлений о проблемах сервера в Telegram
Осталось самое интересное и то, ради чего мы все это проделали — добавляем уведомления в Telegram.
Заходим в “Настроки”(1), “Действия”(2), “Создать действие”(3).

Задаем нужное имя, всегда старайтесь присваивать одни и те же имена, чтобы быстрее можно было находить и проводить настройку.
В строке “Условия” необходимо нажать “Добавить”. Тип “Триггер”, оператор “равно”. В строке “Триггер” нажимаем выбрать и ищем нужный нам host по имени, в нашем случае “1сBitFinans”.

Перед вами появились все Триггеры, которые вы перед этим настроили, можете добавить все, а можно выбрать только особенно критичные, чтобы не приходило большого количество спама.

Помечаем галочками нужные Триггеры и нажимаем “Выбрать”. После этого в предыдущем окне нажимаем “Добавить”.
Следующим действием, переходим во вкладку “Операции”. Длительность шага операции по умолчанию стоит 1h, я рекомендую выставлять на 1m.
Теперь вам необходимо добавить все три операции для корректного срабатывания вашего уведомления.

Нажимаем “Добавить”, в следующим окне вам нужно выбрать:
- Тип операции “Отправить сообщение”.
- Можно установить заранее созданную группу пользователей, тогда уведомление будет приходить сразу нескольким адресатам.
- “Отправлять адресатам” — я выбираю в качестве решения данный параметр, ставлю Admin, так как в моем случае на него настроены уведомления.
- “Отправлять только через” — выбираю “Telegram”.
Нажимаем “Add”. Поздравляю, у вас получилось!

В конце нужно убедиться, что все активировалось и работает.
Для этого заходим во вкладку, где создавали действие. В списке появилось действие, обращаем внимание на “Состояние” — должно гореть зеленым цветом “Активировано”.

Если все сделано правильно, при возникновении проблемы вы получите уведомление через Telegram.
