In this tutorial, you configure Visual Studio Code to use the Microsoft Visual C++ compiler and debugger on Windows.
After configuring VS Code, you will compile and debug a simple Hello World program in VS Code. This tutorial does not teach you details about the Microsoft C++ toolset or the C++ language. For those subjects, there are many good resources available on the Web.
If you have any problems, feel free to file an issue for this tutorial in the VS Code documentation repository.
Prerequisites
To successfully complete this tutorial, you must do the following:
-
Install Visual Studio Code.
-
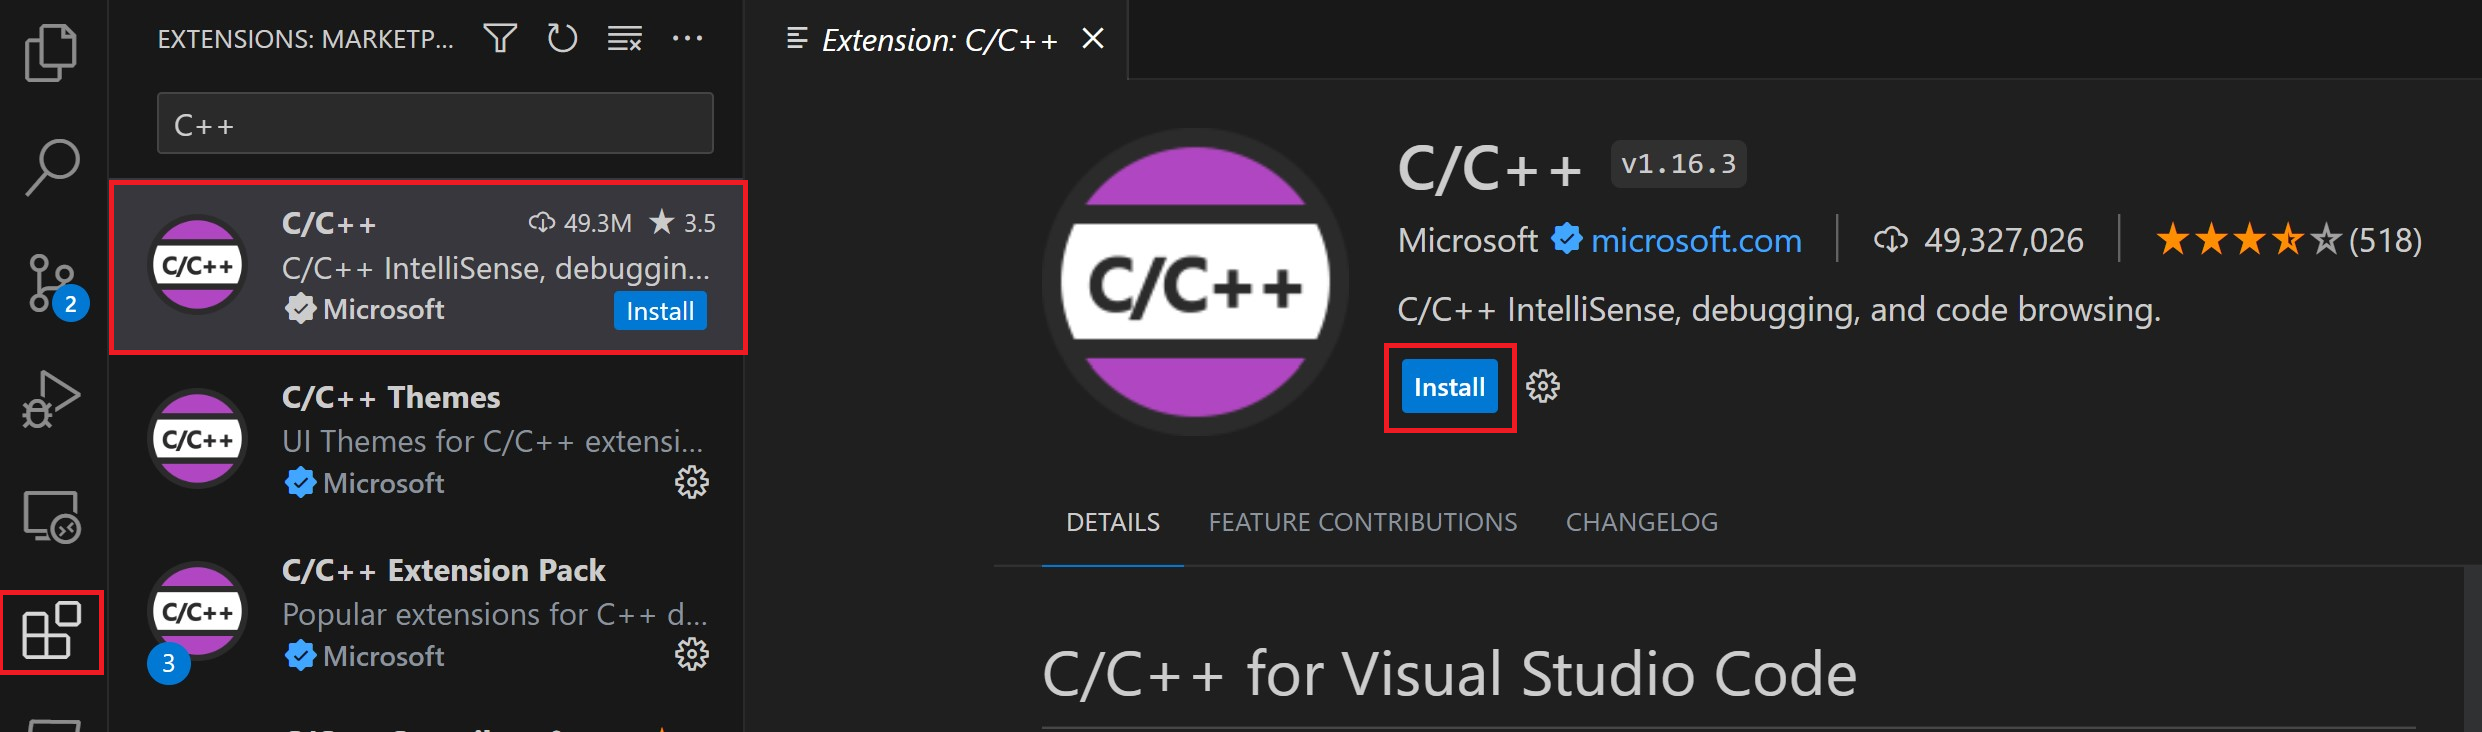
Install the C/C++ extension for VS Code. You can install the C/C++ extension by searching for ‘c++’ in the Extensions view (⇧⌘X (Windows, Linux Ctrl+Shift+X)).

-
Install the Microsoft Visual C++ (MSVC) compiler toolset.
If you have a recent version of Visual Studio, open the Visual Studio Installer from the Windows Start menu and verify that the C++ workload is checked. If it’s not installed, then check the box and select the Modify button in the installer.
You can also install the Desktop development with C++ workload without a full Visual Studio IDE installation. From the Visual Studio Downloads page, scroll down until you see Tools for Visual Studio 2022 under the All Downloads section and select the download for Build Tools for Visual Studio 2022.
This will launch the Visual Studio Installer, which will bring up a dialog showing the available Visual Studio Build Tools workloads. Check the Desktop development with C++ workload and select Install.


Note: You can use the C++ toolset from Visual Studio Build Tools along with Visual Studio Code to compile, build, and verify any C++ codebase as long as you also have a valid Visual Studio license (either Community, Pro, or Enterprise) that you are actively using to develop that C++ codebase.
Check your Microsoft Visual C++ installation
To use MSVC from a command line or VS Code, you must run from a Developer Command Prompt for Visual Studio. An ordinary shell such as PowerShell, Bash, or the Windows command prompt does not have the necessary path environment variables set.
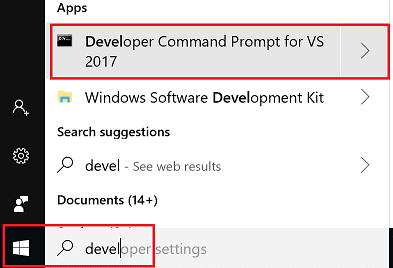
To open the Developer Command Prompt for VS, start typing ‘developer’ in the Windows Start menu, and you should see it appear in the list of suggestions. The exact name depends on which version of Visual Studio or the Visual Studio Build Tools you have installed. Select the item to open the prompt.
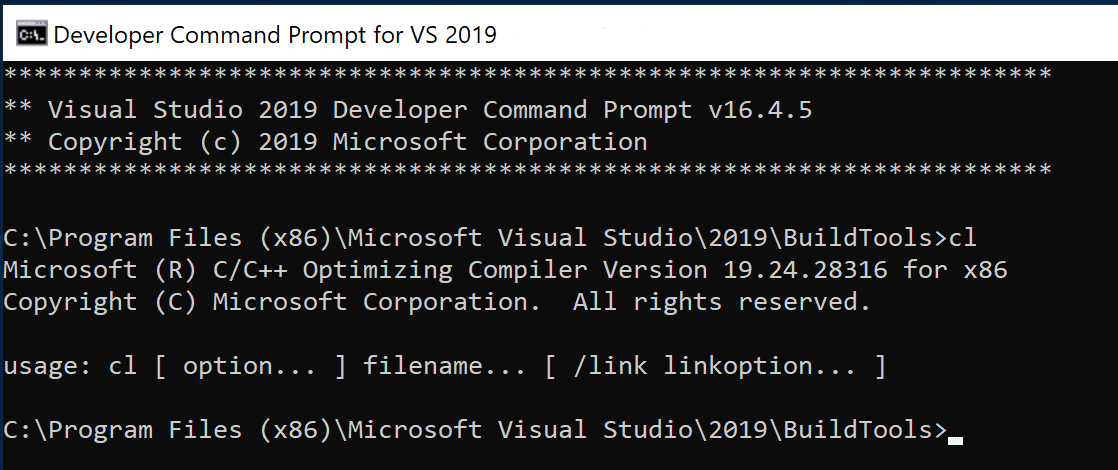
You can test that you have the C++ compiler, cl.exe, installed correctly by typing ‘cl’ and you should see a copyright message with the version and basic usage description.
If the Developer Command Prompt is using the BuildTools location as the starting directory (you wouldn’t want to put projects there), navigate to your user folder (C:users{your username}) before you start creating new projects.
Note: If for some reason you can’t run VS Code from a Developer Command Prompt, you can find a workaround for building C++ projects with VS Code in Run VS Code outside a Developer Command Prompt.
Create Hello World
From the Developer Command Prompt, create an empty folder called «projects» where you can store all your VS Code projects, then create a subfolder called «helloworld», navigate into it, and open VS Code (code) in that folder (.) by entering the following commands:
mkdir projects
cd projects
mkdir helloworld
cd helloworld
code .
The «code .» command opens VS Code in the current working folder, which becomes your «workspace». As you go through the tutorial, you will see three files created in a .vscode folder in the workspace:
tasks.json(build instructions)launch.json(debugger settings)c_cpp_properties.json(compiler path and IntelliSense settings)
Add a source code file
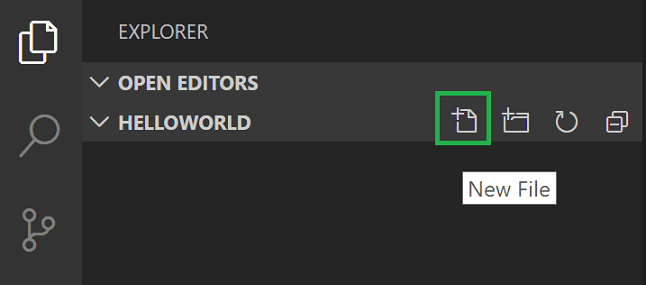
In the File Explorer title bar, select the New File button and name the file helloworld.cpp.
Add hello world source code
Now paste in this source code:
#include <iostream>
#include <vector>
#include <string>

using namespace std;

int main()
{
    vector<string> msg {"Hello", "C++", "World", "from", "VS Code", "and the C++ extension!"};

    for (const string& word : msg)
    {
        cout << word << " ";
    }
    cout << endl;
}
Now press ⌘S (Windows, Linux Ctrl+S) to save the file. Notice how the file you just added appears in the File Explorer view (⇧⌘E (Windows, Linux Ctrl+Shift+E)) in the side bar of VS Code:
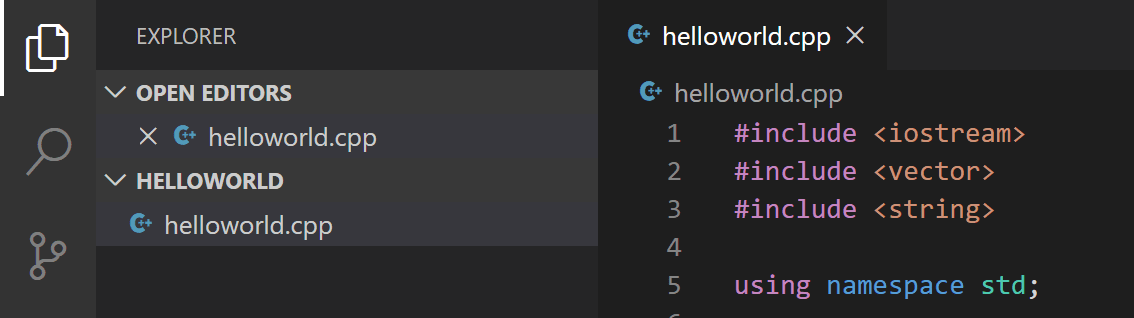
You can also enable Auto Save to automatically save your file changes, by checking Auto Save in the main File menu.
The Activity Bar on the far left lets you open different views such as Search, Source Control, and Run. You’ll look at the Run view later in this tutorial. You can find out more about the other views in the VS Code User Interface documentation.
Note: When you save or open a C++ file, you may see a notification from the C/C++ extension about the availability of an Insiders version, which lets you test new features and fixes. You can ignore this notification by selecting the
X(Clear Notification).
Explore IntelliSense
In your new helloworld.cpp file, hover over vector or string to see type information. After the declaration of the msg variable, start typing msg. as you would when calling a member function. You should immediately see a completion list that shows all the member functions, and a window that shows the type information for the msg object:
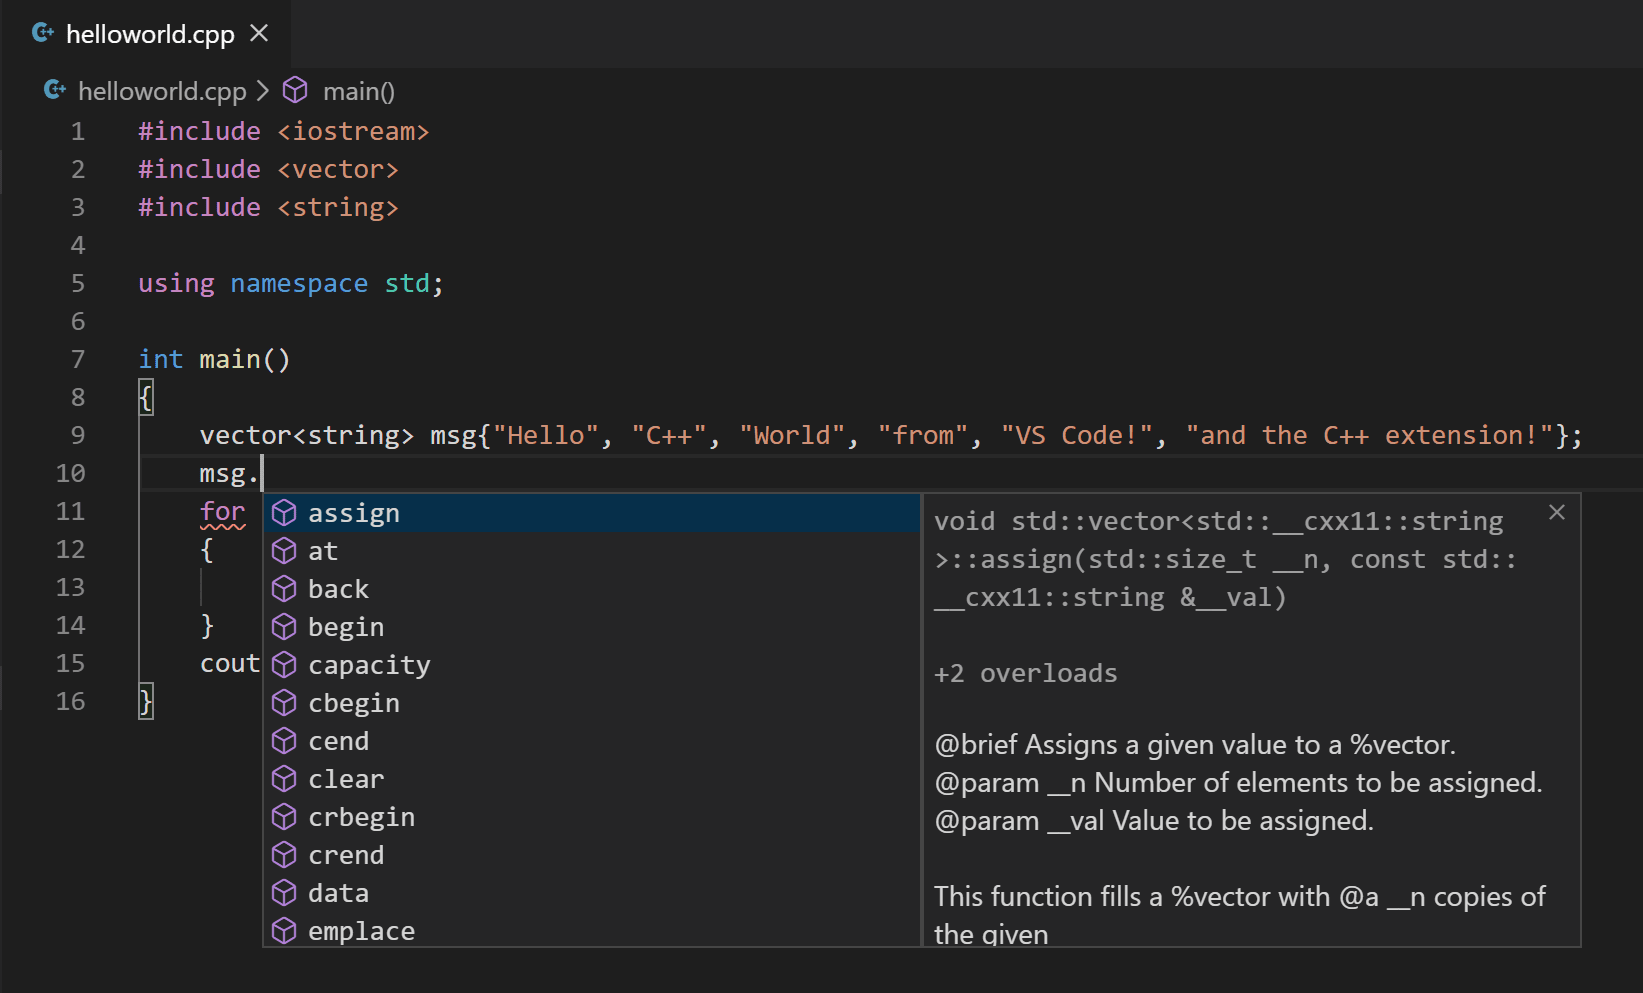
You can press the Tab key to insert the selected member; then, when you add the opening parenthesis, you will see information about any arguments that the function requires.
Run helloworld.cpp
Remember, the C++ extension uses the C++ compiler you have installed on your machine to build your program. Make sure you have a C++ compiler installed before attempting to run and debug helloworld.cpp in VS Code.
-
Open
helloworld.cppso that it is the active file. -
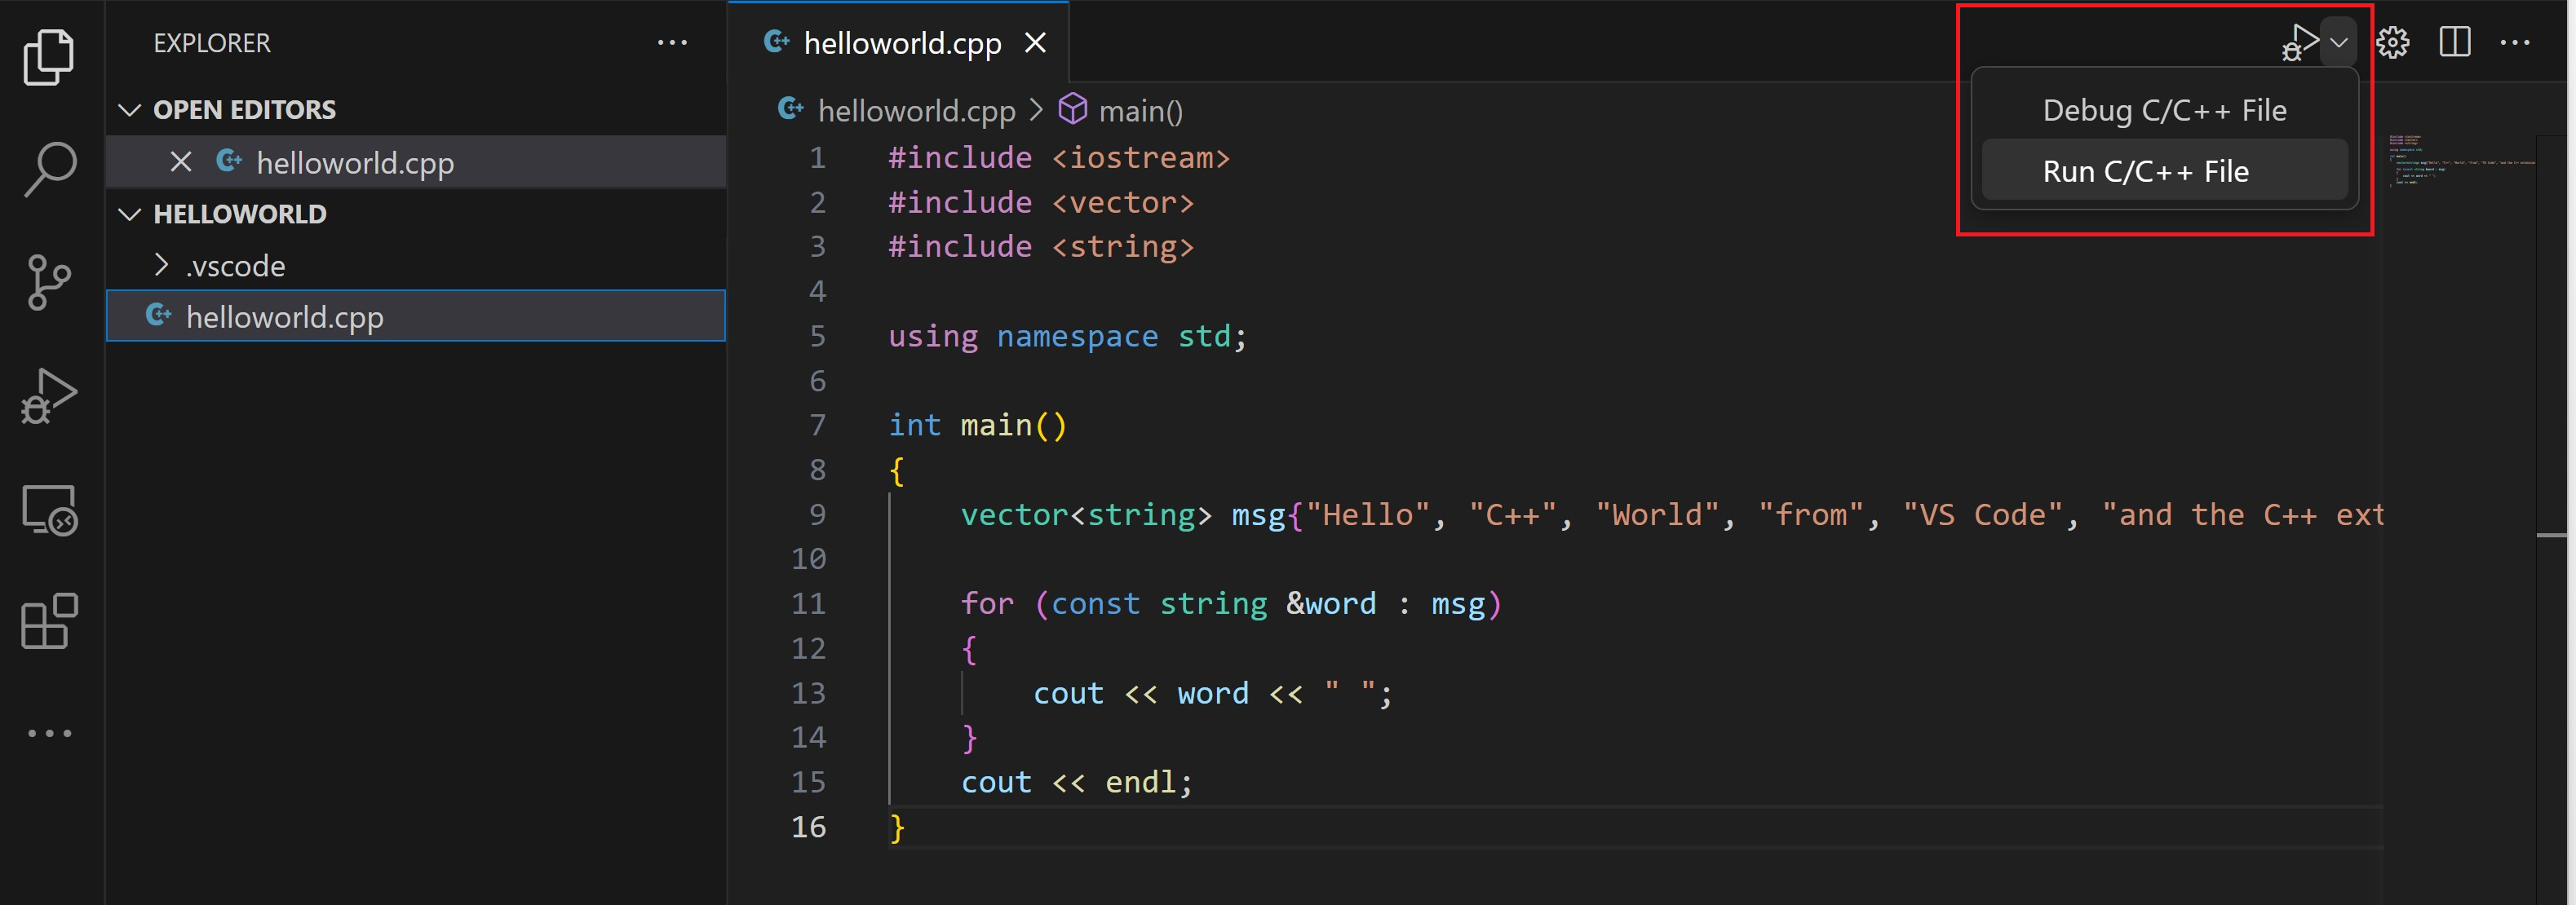
Press the play button in the top right corner of the editor.
-
Choose C/C++: cl.exe build and debug active file from the list of detected compilers on your system.
You’ll only be asked to choose a compiler the first time you run helloworld.cpp. This compiler will be set as the «default» compiler in tasks.json file.
-
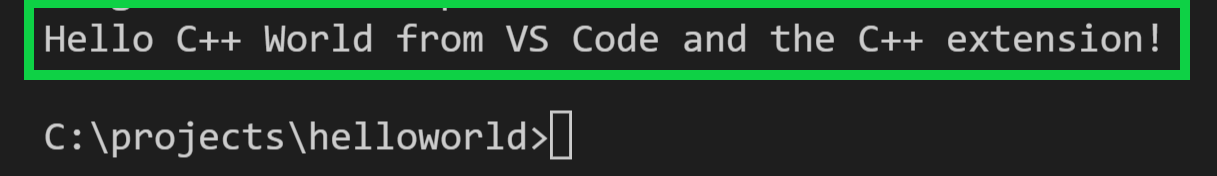
After the build succeeds, your program’s output will appear in the integrated Terminal.
If you get an error trying to build and debug with cl.exe, make sure you have started VS Code from the Developer Command Prompt for Visual Studio using the code . shortcut.

The first time you run your program, the C++ extension creates tasks.json, which you’ll find in your project’s .vscode folder. tasks.json stores build configurations.
Your new tasks.json file should look similar to the JSON below:
{
  "version": "2.0.0",
  "tasks": [
    {
      "type": "shell",
      "label": "C/C++: cl.exe build active file",
      "command": "cl.exe",
      "args": [
        "/Zi",
        "/EHsc",
        "/Fe:",
        "${fileDirname}\${fileBasenameNoExtension}.exe",
        "${file}"
      ],
      "problemMatcher": ["$msCompile"],
      "group": {
        "kind": "build",
        "isDefault": true
      },
      "detail": "Task generated by Debugger."
    }
  ]
}
Note: You can learn more about
tasks.jsonvariables in the variables reference.
The command setting specifies the program to run; in this case that is «cl.exe». The args array specifies the command-line arguments that will be passed to cl.exe. These arguments must be specified in the order expected by the compiler.
This task tells the C++ compiler to take the active file (${file}), compile it, and create an executable file (/Fe: switch) in the current directory (${fileDirname}) with the same name as the active file but with the .exe extension (${fileBasenameNoExtension}.exe), resulting in helloworld.exe for our example.
The label value is what you will see in the tasks list; you can name this whatever you like.
The detail value is what you will as the description of the task in the tasks list. It’s highly recommended to rename this value to differentiate it from similar tasks.
The problemMatcher value selects the output parser to use for finding errors and warnings in the compiler output. For cl.exe, you’ll get the best results if you use the $msCompile problem matcher.
From now on, the play button will read from tasks.json to figure out how to build and run your program. You can define multiple build tasks in tasks.json, and whichever task is marked as the default will be used by the play button. In case you need to change the default compiler, you can run Tasks: Configure default build task. Alternatively you can modify the tasks.json file and remove the default by replacing this segment:
    "group": {
        "kind": "build",
        "isDefault": true
    },
with this:
"group": "build",
Modifying tasks.json
You can modify your tasks.json to build multiple C++ files by using an argument like "${workspaceFolder}/*.cpp" instead of ${file}.This will build all .cpp files in your current folder. You can also modify the output filename by replacing "${fileDirname}\${fileBasenameNoExtension}.exe" with a hard-coded filename (for example "${workspaceFolder}\myProgram.exe").
Debug helloworld.cpp
- Go back to
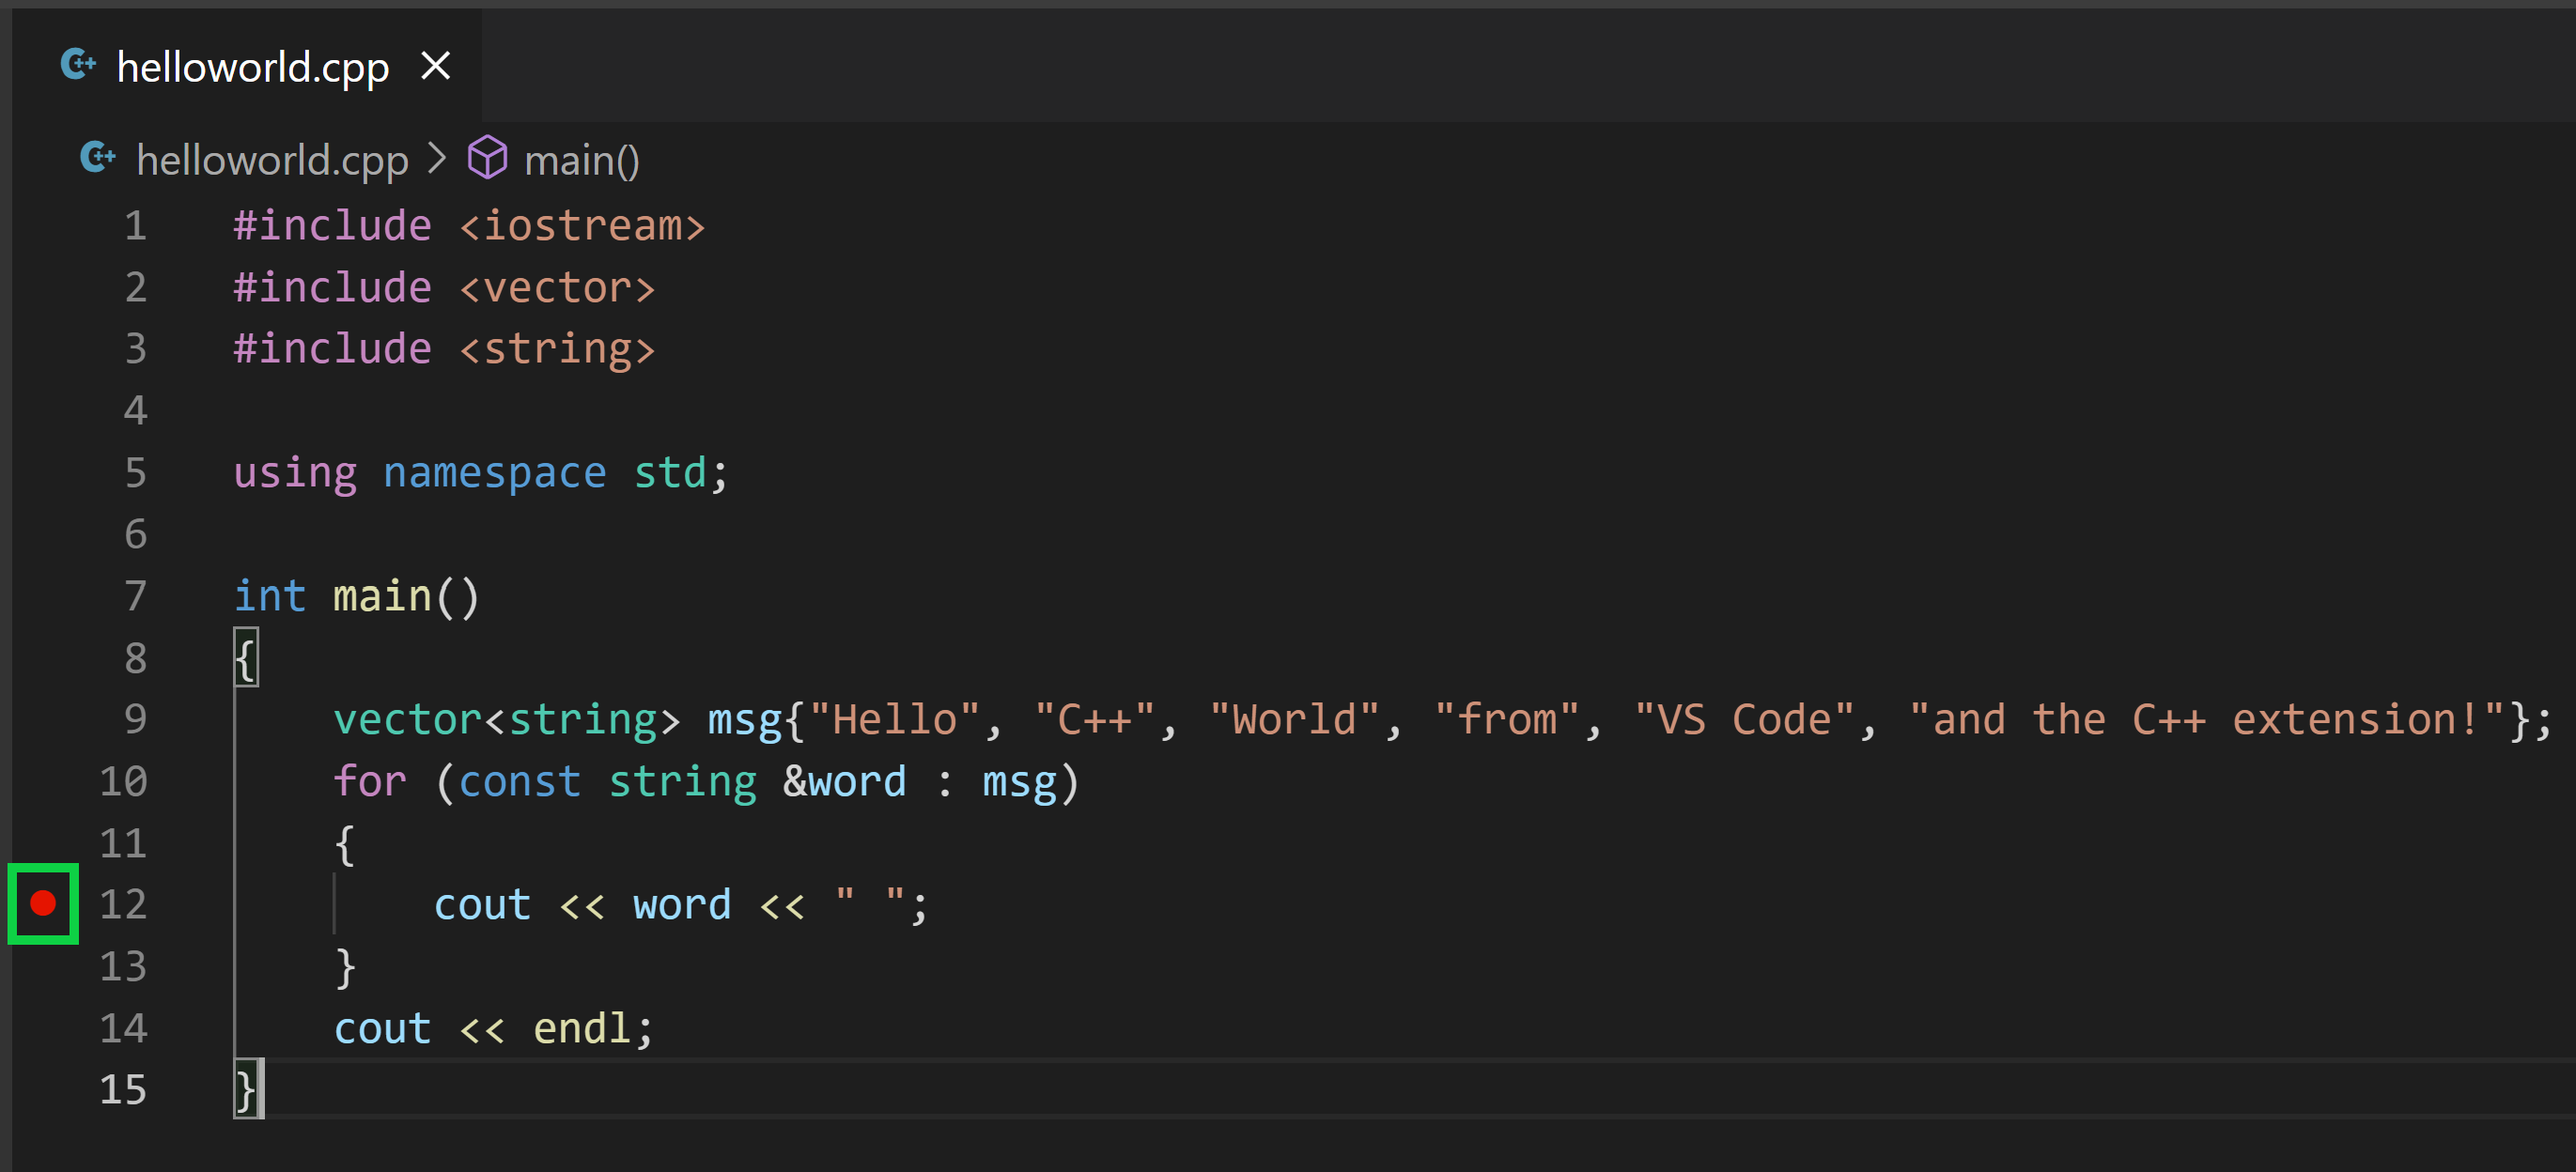
helloworld.cppso that it is the active file. - Set a breakpoint by clicking on the editor margin or using F9 on the current line.
- From the drop-down next to the play button, select Debug C/C++ File.
- Choose C/C++: cl.exe build and debug active file from the list of detected compilers on your system (you’ll only be asked to choose a compiler the first time you run/debug
helloworld.cpp).
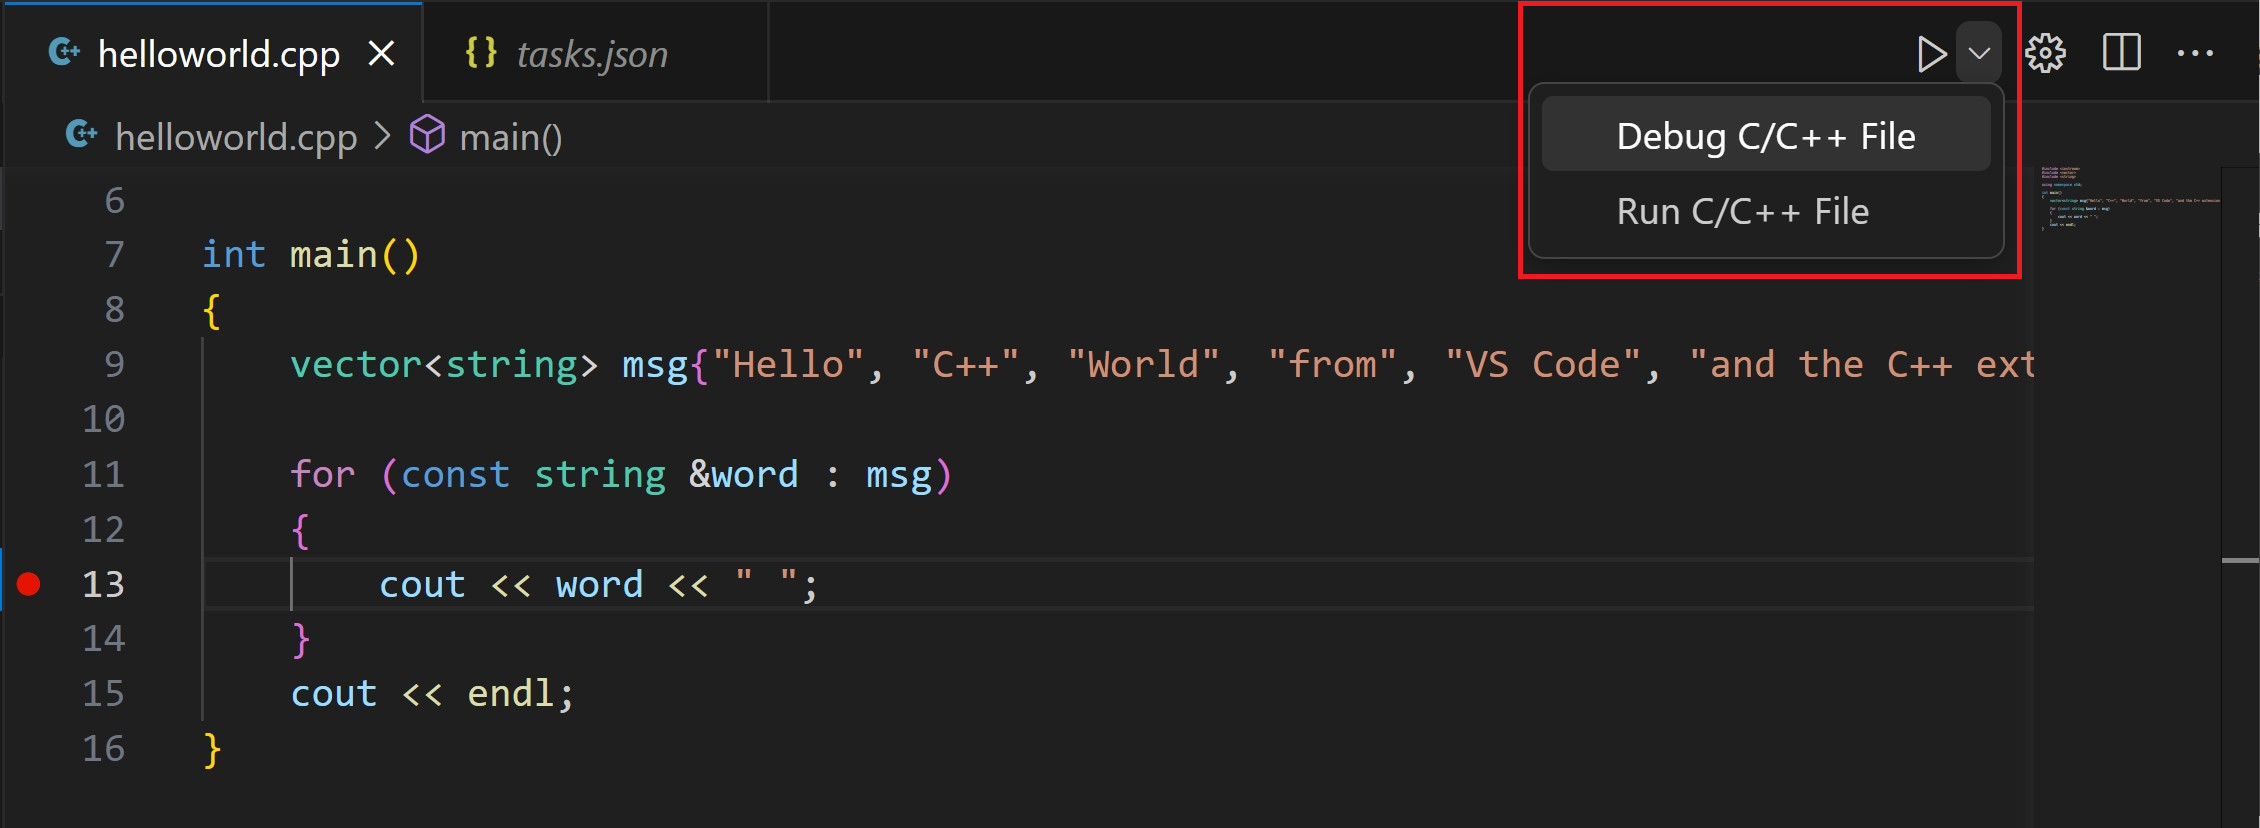
The play button has two modes: Run C/C++ File and Debug C/C++ File. It will default to the last-used mode. If you see the debug icon in the play button, you can just click the play button to debug, instead of selecting the drop-down menu item.

If you get an error trying to build and debug with cl.exe, make sure you have started VS Code from the Developer Command Prompt for Visual Studio using the code . shortcut.
Explore the debugger
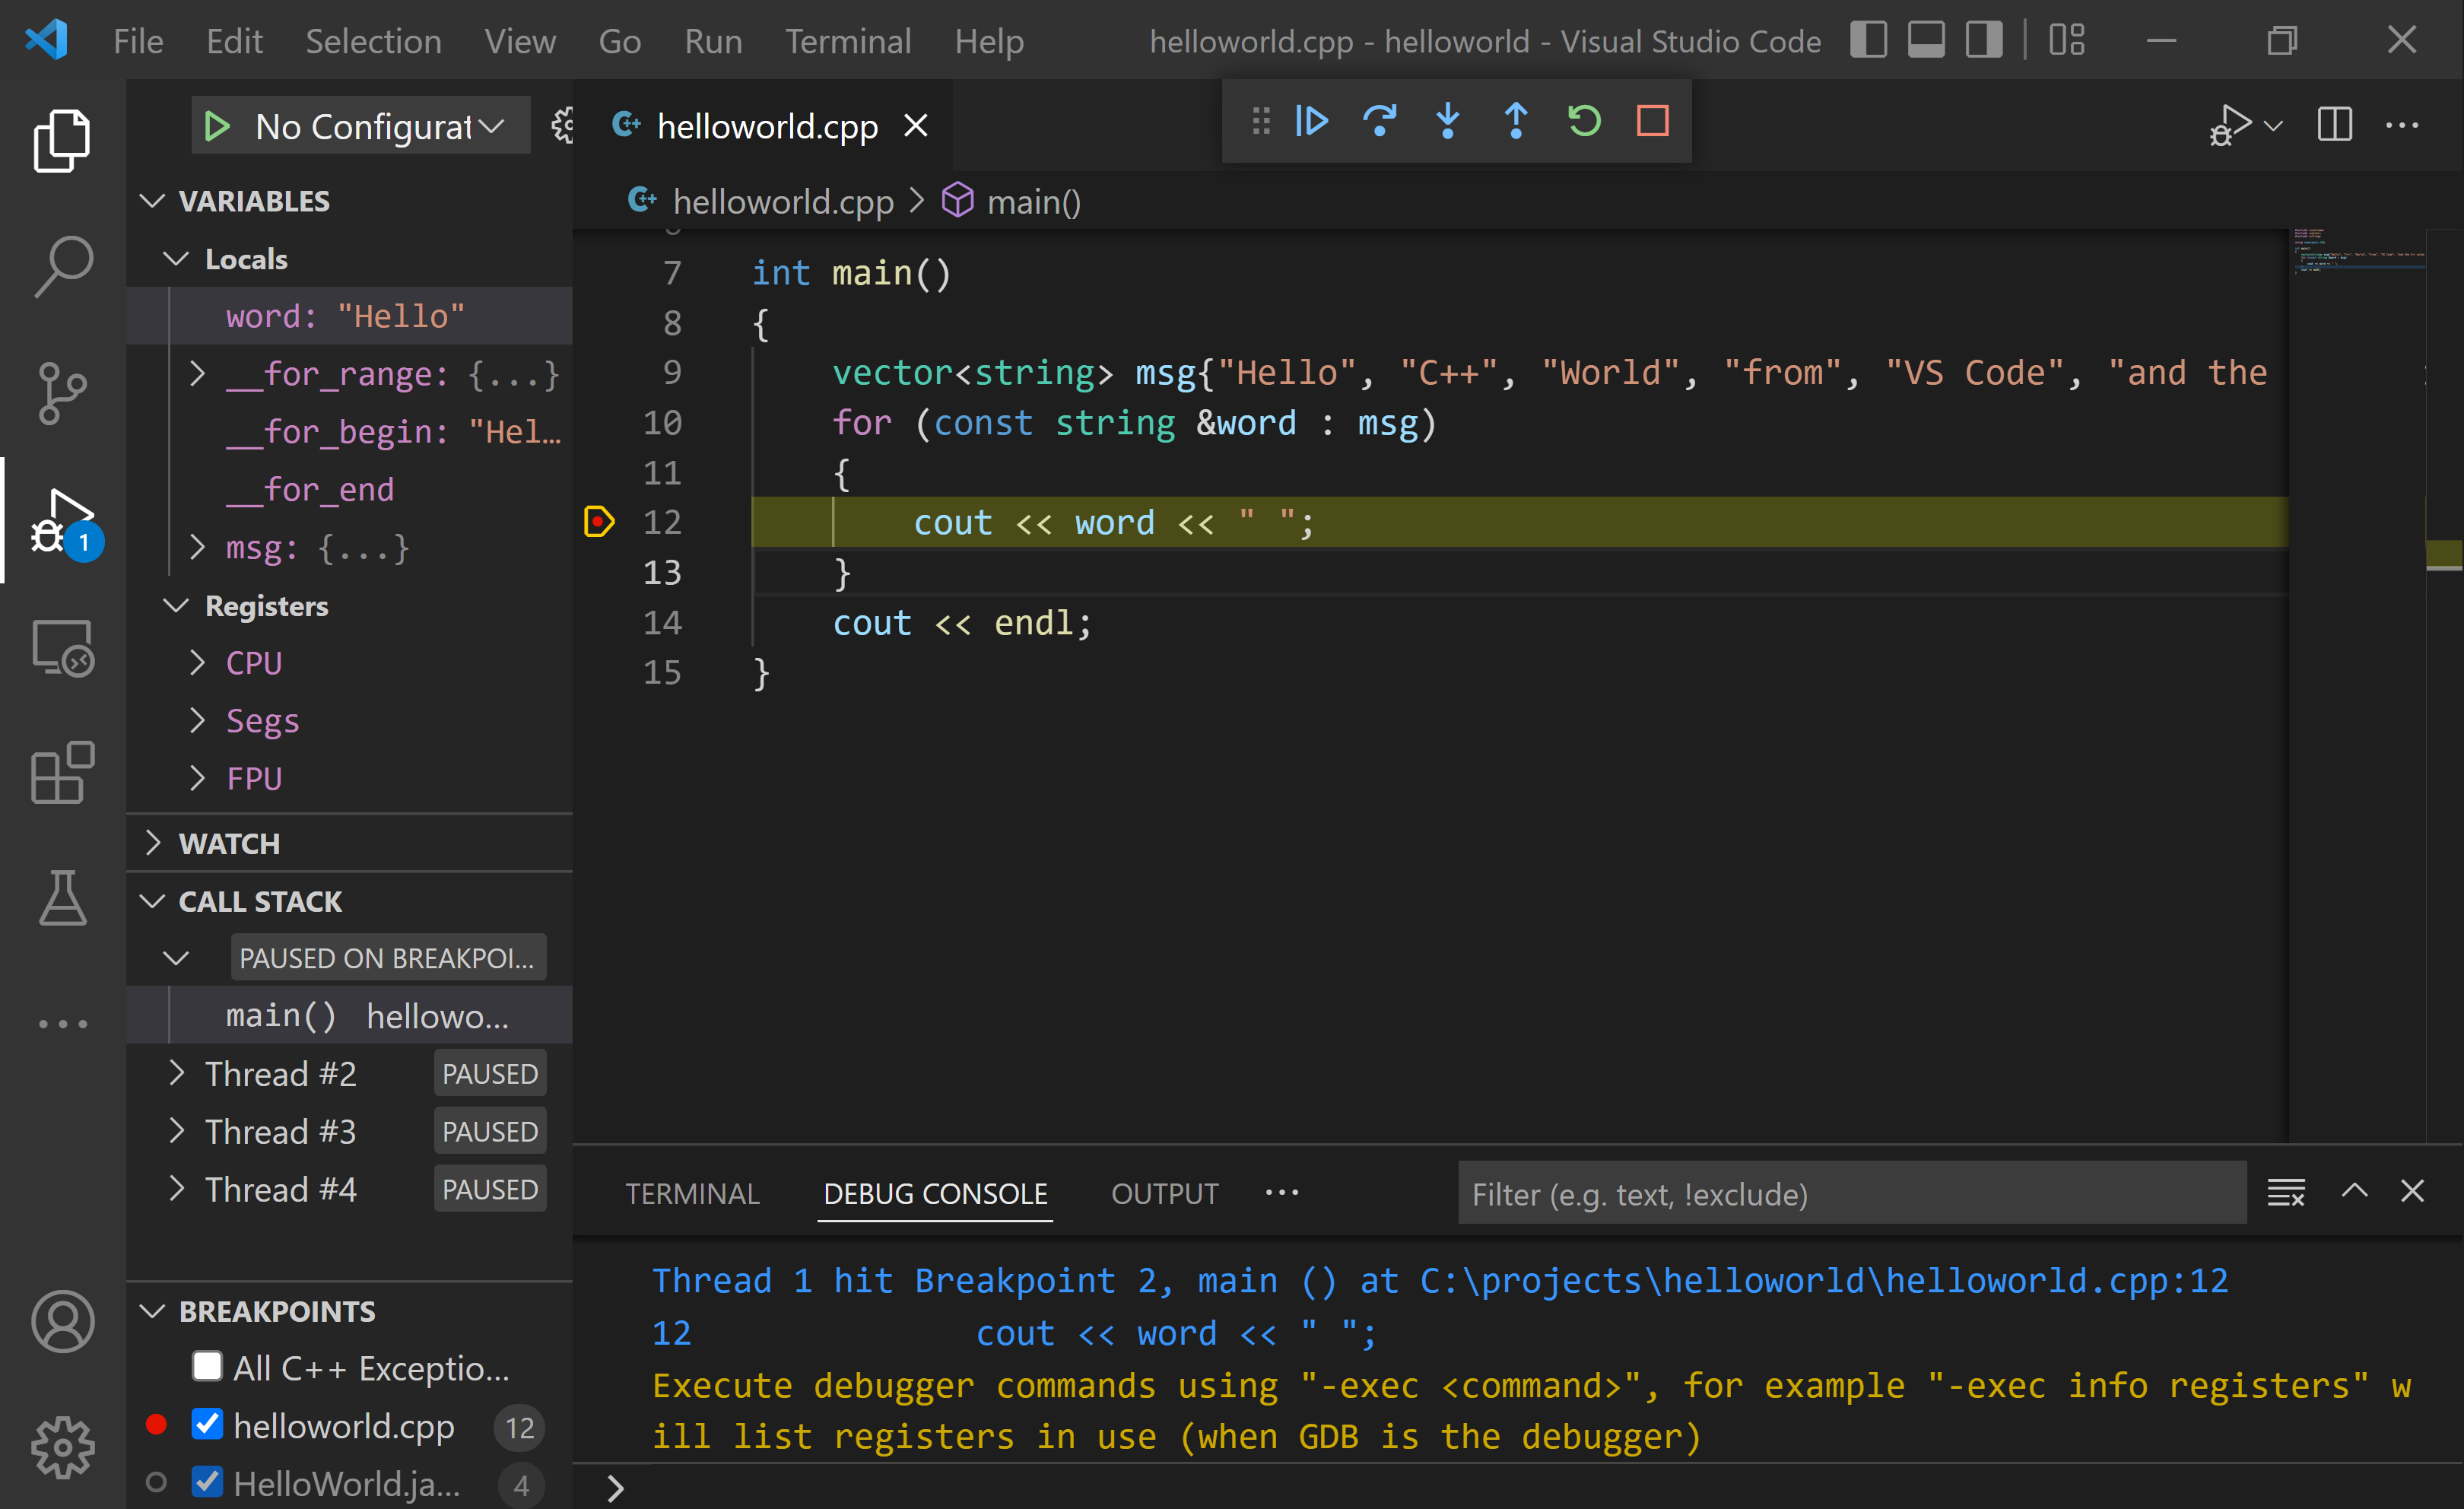
Before you start stepping through the code, let’s take a moment to notice several changes in the user interface:
-
The Integrated Terminal appears at the bottom of the source code editor. In the Debug Output tab, you see output that indicates the debugger is up and running.
-
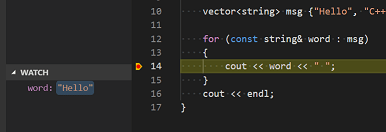
The editor highlights the line where you set a breakpoint before starting the debugger:
-
The Run and Debug view on the left shows debugging information. You’ll see an example later in the tutorial.
-
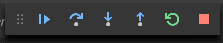
At the top of the code editor, a debugging control panel appears. You can move this around the screen by grabbing the dots on the left side.
Step through the code
Now you’re ready to start stepping through the code.
-
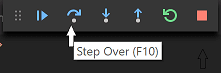
Click or press the Step over icon in the debugging control panel.
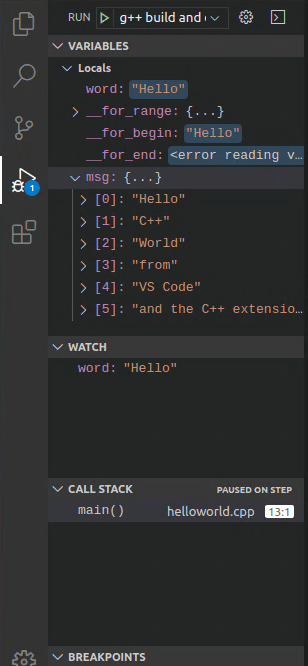
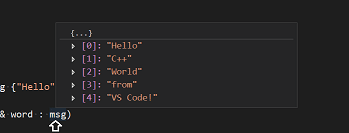
This will advance program execution to the first line of the for loop, and skip over all the internal function calls within the
vectorandstringclasses that are invoked when themsgvariable is created and initialized. Notice the change in the Variables window on the left.In this case, the errors are expected because, although the variable names for the loop are now visible to the debugger, the statement has not executed yet, so there is nothing to read at this point. The contents of
msgare visible, however, because that statement has completed. -
Press Step over again to advance to the next statement in this program (skipping over all the internal code that is executed to initialize the loop). Now, the Variables window shows information about the loop variables.
-
Press Step over again to execute the
coutstatement. (Note that as of the March 2019 release, the C++ extension does not print any output to the Debug Console until the loop exits.) -
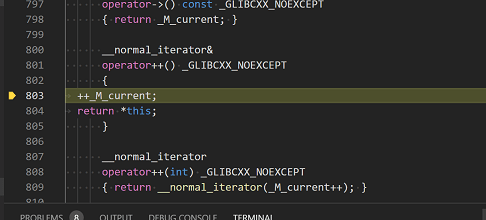
If you like, you can keep pressing Step over until all the words in the vector have been printed to the console. But if you are curious, try pressing the Step Into button to step through source code in the C++ standard library!
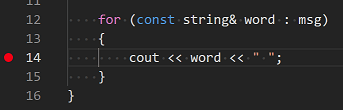
To return to your own code, one way is to keep pressing Step over. Another way is to set a breakpoint in your code by switching to the
helloworld.cpptab in the code editor, putting the insertion point somewhere on thecoutstatement inside the loop, and pressing F9. A red dot appears in the gutter on the left to indicate that a breakpoint has been set on this line.Then press F5 to start execution from the current line in the standard library header. Execution will break on
cout. If you like, you can press F9 again to toggle off the breakpoint.
Set a watch
Sometimes you might want to keep track of the value of a variable as your program executes. You can do this by setting a watch on the variable.
-
Place the insertion point inside the loop. In the Watch window, select the plus sign and in the text box, type
word, which is the name of the loop variable. Now view the Watch window as you step through the loop. -
Add another watch by adding this statement before the loop:
int i = 0;. Then, inside the loop, add this statement:++i;. Now add a watch forias you did in the previous step. -
To quickly view the value of any variable while execution is paused on a breakpoint, you can hover over it with the mouse pointer.
Customize debugging with launch.json
When you debug with the play button or F5, the C++ extension creates a dynamic debug configuration on the fly.
There are cases where you’d want to customize your debug configuration, such as specifying arguments to pass to the program at runtime. You can define custom debug configurations in a launch.json file.
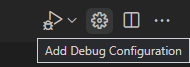
To create launch.json, choose Add Debug Configuration from the play button drop-down menu.
You’ll then see a dropdown for various predefined debugging configurations. Choose C/C++: cl.exe build and debug active file.

VS Code creates a launch.json file, which looks something like this:
{
  "version": "0.2.0",
  "configurations": [
    {
      "name": "C/C++: cl.exe build and debug active file",
      "type": "cppvsdbg",
      "request": "launch",
      "program": "${fileDirname}\${fileBasenameNoExtension}.exe",
      "args": [],
      "stopAtEntry": false,
      "cwd": "${workspaceFolder}",
      "environment": [],
      "externalConsole": false,
      "preLaunchTask": "C/C++: cl.exe build active file"
    }
  ]
}
In the JSON above, program specifies the program you want to debug. Here it is set to the active file folder (${fileDirname}) and active filename with the .exe extension (${fileBasenameNoExtension}.exe), which if helloworld.cpp is the active file will be helloworld.exe. The args property is an array of arguments to pass to the program at runtime.
By default, the C++ extension won’t add any breakpoints to your source code and the stopAtEntry value is set to false.
Change the stopAtEntry value to true to cause the debugger to stop on the main method when you start debugging.
From now on, the play button and F5 will read from your
launch.jsonfile when launching your program for debugging.
C/C++ configurations
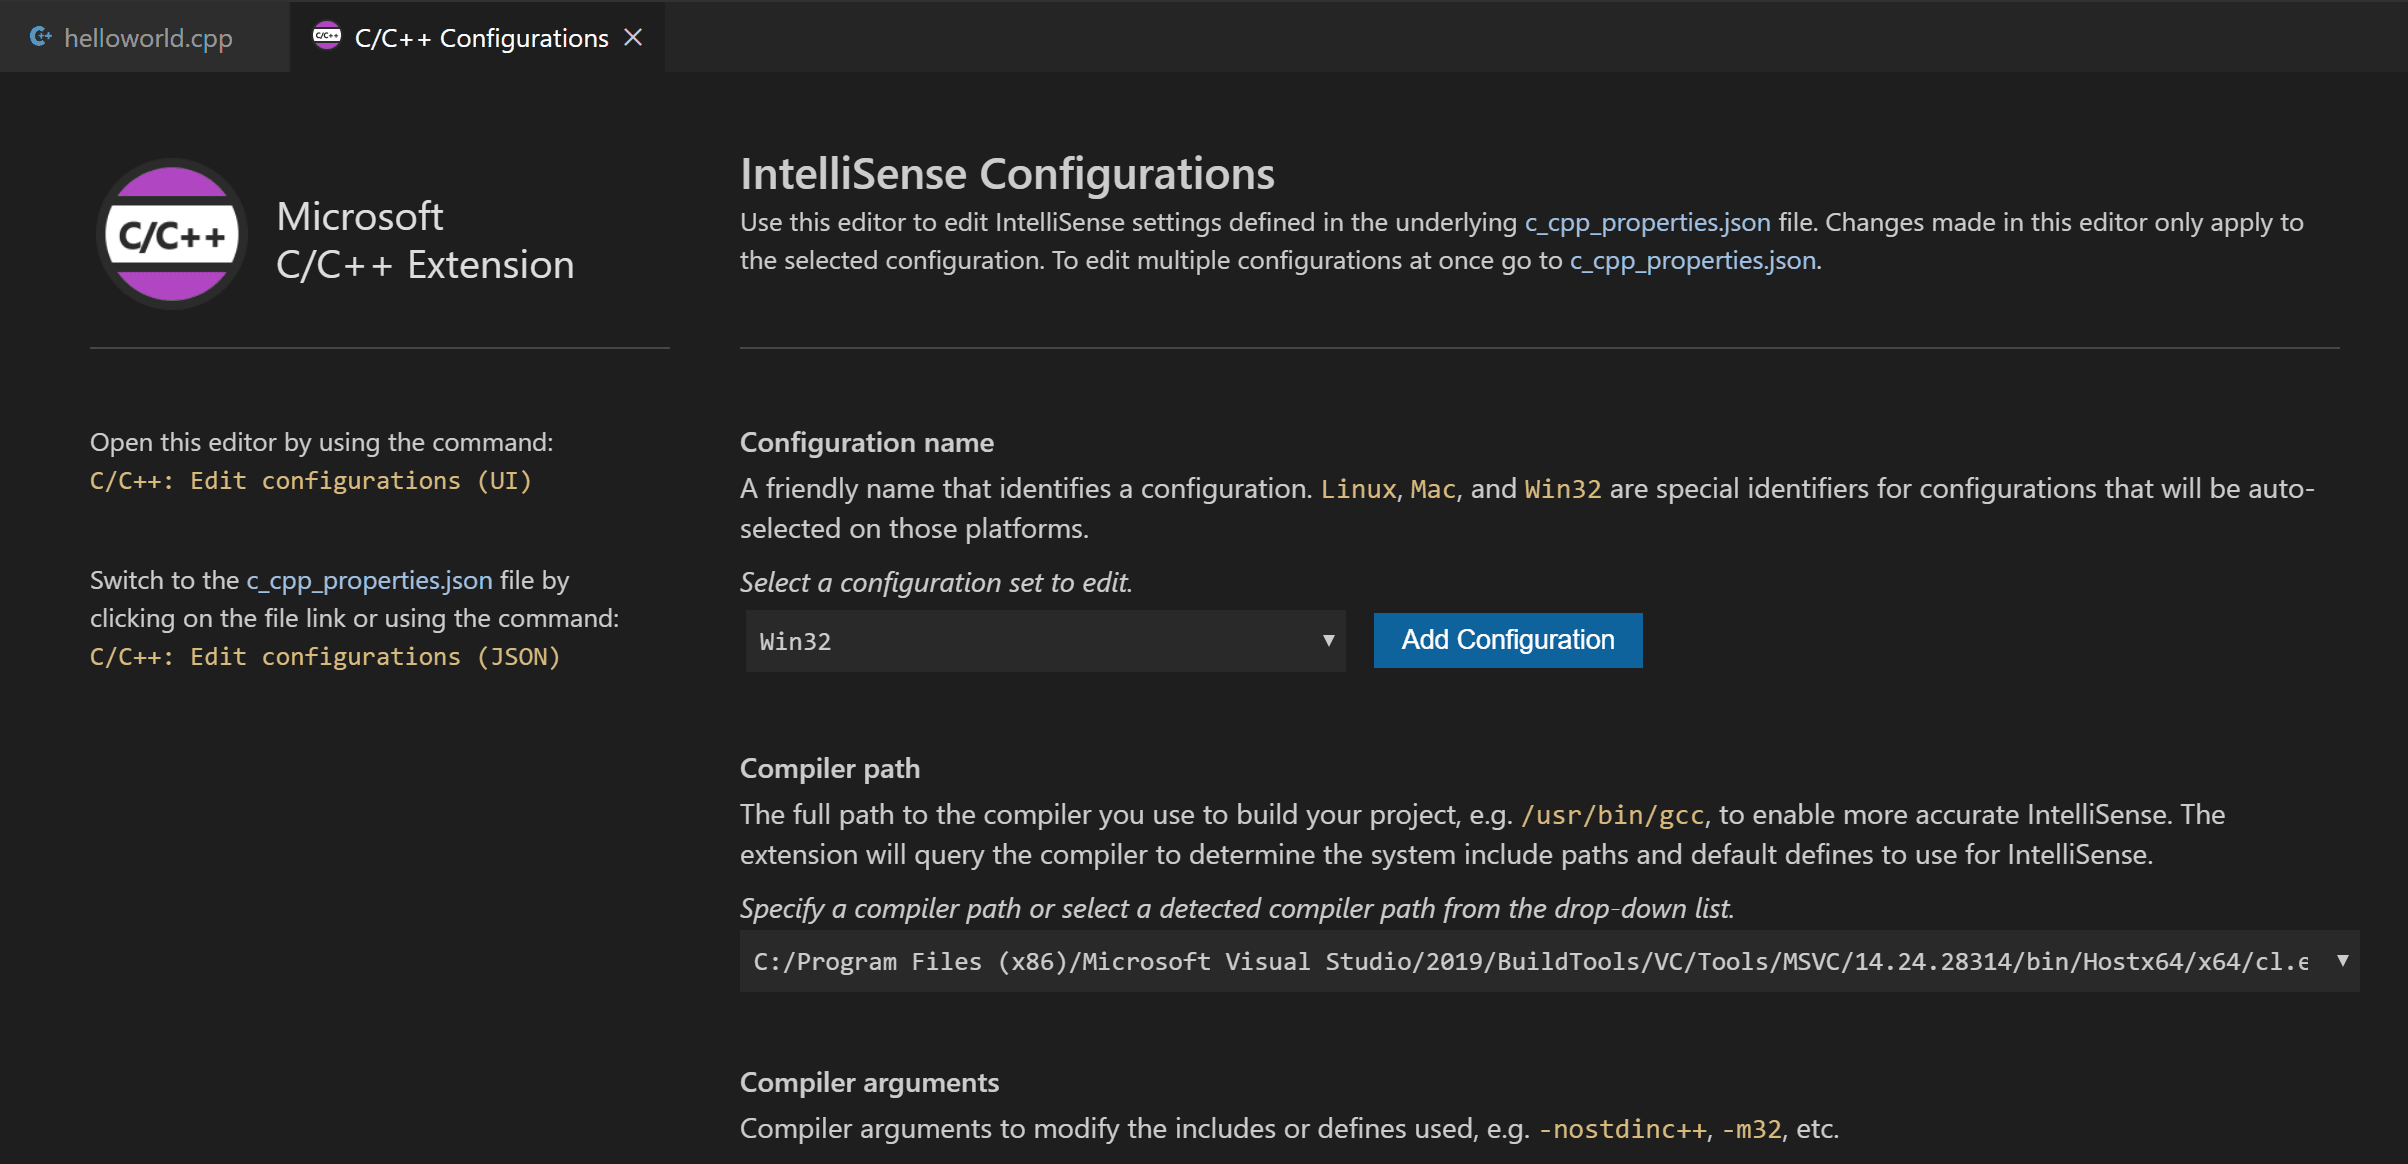
If you want more control over the C/C++ extension, you can create a c_cpp_properties.json file, which will allow you to change settings such as the path to the compiler, include paths, C++ standard (default is C++17), and more.
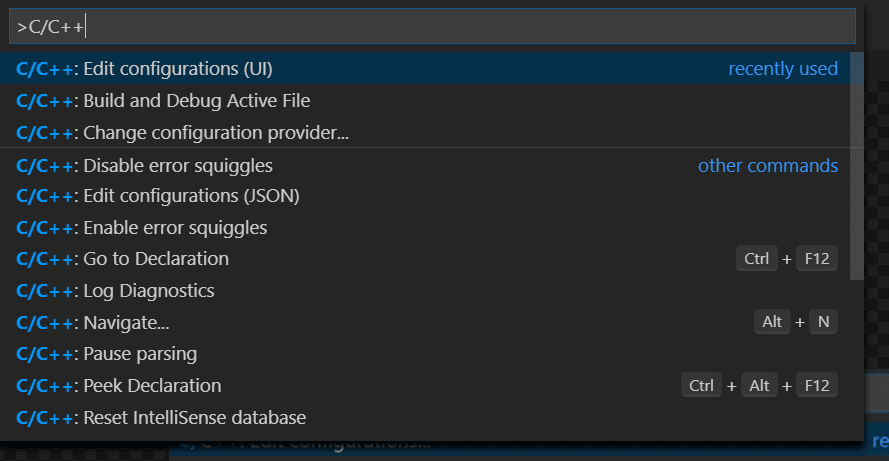
You can view the C/C++ configuration UI by running the command C/C++: Edit Configurations (UI) from the Command Palette (⇧⌘P (Windows, Linux Ctrl+Shift+P)).
This opens the C/C++ Configurations page. When you make changes here, VS Code writes them to a file called c_cpp_properties.json in the .vscode folder.
Visual Studio Code places these settings in .vscodec_cpp_properties.json. If you open that file directly, it should look something like this:
{
  "configurations": [
    {
      "name": "Win32",
      "includePath": ["${workspaceFolder}/**"],
      "defines": ["_DEBUG", "UNICODE", "_UNICODE"],
      "windowsSdkVersion": "10.0.18362.0",
      "compilerPath": "C:/Program Files (x86)/Microsoft Visual Studio/2019/BuildTools/VC/Tools/MSVC/14.24.28314/bin/Hostx64/x64/cl.exe",
      "cStandard": "c11",
      "cppStandard": "c++17",
      "intelliSenseMode": "msvc-x64"
    }
  ],
  "version": 4
}
You only need to add to the Include path array setting if your program includes header files that are not in your workspace or in the standard library path.
Compiler path
The compilerPath setting is an important setting in your configuration. The extension uses it to infer the path to the C++ standard library header files. When the extension knows where to find those files, it can provide useful features like smart completions and Go to Definition navigation.
The C/C++ extension attempts to populate compilerPath with the default compiler location based on what it finds on your system. The extension looks in several common compiler locations.
The compilerPath search order is:
- First check for the Microsoft Visual C++ compilerOpe
- Then look for g++ on Windows Subsystem for Linux (WSL)
- Then g++ for Mingw-w64.
If you have g++ or WSL installed, you might need to change compilerPath to match the preferred compiler for your project. For Microsoft C++, the path should look something like this, depending on which specific version you have installed: «C:/Program Files (x86)/Microsoft Visual Studio/2017/BuildTools/VC/Tools/MSVC/14.16.27023/bin/Hostx64/x64/cl.exe».
Reusing your C++ configuration
VS Code is now configured to use the Microsoft C++ compiler. The configuration applies to the current workspace. To reuse the configuration, just copy the JSON files to a .vscode folder in a new project folder (workspace) and change the names of the source file(s) and executable as needed.
Run VS Code outside the Developer Command Prompt
In certain circumstances, it isn’t possible to run VS Code from Developer Command Prompt for Visual Studio (for example, in Remote Development through SSH scenarios). In that case, you can automate initialization of Developer Command Prompt for Visual Studio during the build using the following tasks.json configuration:
{
  "version": "2.0.0",
  "windows": {
    "options": {
      "shell": {
        "executable": "cmd.exe",
        "args": [
          "/C",
          // The path to VsDevCmd.bat depends on the version of Visual Studio you have installed.
          ""C:/Program Files (x86)/Microsoft Visual Studio/2019/Community/Common7/Tools/VsDevCmd.bat"",
          "&&"
        ]
      }
    }
  },
  "tasks": [
    {
      "type": "shell",
      "label": "cl.exe build active file",
      "command": "cl.exe",
      "args": [
        "/Zi",
        "/EHsc",
        "/Fe:",
        "${fileDirname}\${fileBasenameNoExtension}.exe",
        "${file}"
      ],
      "problemMatcher": ["$msCompile"],
      "group": {
        "kind": "build",
        "isDefault": true
      }
    }
  ]
}
Note: The path to
VsDevCmd.batmight be different depending on the Visual Studio version or installation path. You can find the path toVsDevCmd.batby opening a Command Prompt and runningdir "VsDevCmd*" /s.
Troubleshooting
The term ‘cl.exe’ is not recognized
If you see the error «The term ‘cl.exe’ is not recognized as the name of a cmdlet, function, script file, or operable program.», this usually means you are running VS Code outside of a Developer Command Prompt for Visual Studio and VS Code doesn’t know the path to the cl.exe compiler.
VS Code must either be started from the Developer Command Prompt for Visual Studio, or the task must be configured to run outside a Developer Command Prompt.
You can always check that you are running VS Code in the context of the Developer Command Prompt by opening a new Terminal (⌃⇧` (Windows, Linux Ctrl+Shift+`)) and typing ‘cl’ to verify cl.exe is available to VS Code.
fatal error C1034: assert.h: no include path set
In this case, cl.exe is available to VS Code through the PATH environment variable, but VS Code still needs to either be started from the Developer Command Prompt for Visual Studio, or be configured to run outside the Developer Command Prompt. Otherwise, cl.exe does not have access to important environment variables such as INCLUDE.
Next steps
- Explore the VS Code User Guide.
- Review the Overview of the C++ extension.
- Create a new workspace, copy your
.vscodeJSON files to it, adjust the necessary settings for the new workspace path, program name, and so on, and start coding!
5/13/2022
| Order | Area | TOCTitle | ContentId | PageTitle | DateApproved | MetaDescription |
|---|---|---|---|---|---|---|
|
6 |
cpp |
Microsoft C++ on Windows |
c8b779d6-79e2-49d6-acfc-430d7ac3a299 |
Configure Visual Studio Code for Microsoft C++ |
5/13/2022 |
Configure the C++ extension in Visual Studio Code to target Microsoft C++ on Windows. |
Configure VS Code for Microsoft C++
In this tutorial, you configure Visual Studio Code to use the Microsoft Visual C++ compiler and debugger on Windows.
After configuring VS Code, you will compile and debug a simple Hello World program in VS Code. This tutorial does not teach you details about the Microsoft C++ toolset or the C++ language. For those subjects, there are many good resources available on the Web.
If you have any problems, feel free to file an issue for this tutorial in the VS Code documentation repository.
Prerequisites
To successfully complete this tutorial, you must do the following:
-
Install Visual Studio Code.
-
Install the C/C++ extension for VS Code. You can install the C/C++ extension by searching for ‘c++’ in the Extensions view (
kb(workbench.view.extensions)). -
Install the Microsoft Visual C++ (MSVC) compiler toolset.
If you have a recent version of Visual Studio, open the Visual Studio Installer from the Windows Start menu and verify that the C++ workload is checked. If it’s not installed, then check the box and select the Modify button in the installer.
You can also install the Desktop development with C++ workload without a full Visual Studio IDE installation. From the Visual Studio Downloads page, scroll down until you see Tools for Visual Studio 2022 under the All Downloads section and select the download for Build Tools for Visual Studio 2022.
This will launch the Visual Studio Installer, which will bring up a dialog showing the available Visual Studio Build Tools workloads. Check the Desktop development with C++ workload and select Install.


Note: You can use the C++ toolset from Visual Studio Build Tools along with Visual Studio Code to compile, build, and verify any C++ codebase as long as you also have a valid Visual Studio license (either Community, Pro, or Enterprise) that you are actively using to develop that C++ codebase.
Check your Microsoft Visual C++ installation
To use MSVC from a command line or VS Code, you must run from a Developer Command Prompt for Visual Studio. An ordinary shell such as PowerShell, Bash, or the Windows command prompt does not have the necessary path environment variables set.
To open the Developer Command Prompt for VS, start typing ‘developer’ in the Windows Start menu, and you should see it appear in the list of suggestions. The exact name depends on which version of Visual Studio or the Visual Studio Build Tools you have installed. Select the item to open the prompt.

You can test that you have the C++ compiler, cl.exe, installed correctly by typing ‘cl’ and you should see a copyright message with the version and basic usage description.

If the Developer Command Prompt is using the BuildTools location as the starting directory (you wouldn’t want to put projects there), navigate to your user folder (C:users{your username}) before you start creating new projects.
Note: If for some reason you can’t run VS Code from a Developer Command Prompt, you can find a workaround for building C++ projects with VS Code in Run VS Code outside a Developer Command Prompt.
Create Hello World
From the Developer Command Prompt, create an empty folder called «projects» where you can store all your VS Code projects, then create a subfolder called «helloworld», navigate into it, and open VS Code (code) in that folder (.) by entering the following commands:
mkdir projects
cd projects
mkdir helloworld
cd helloworld
code .
The «code .» command opens VS Code in the current working folder, which becomes your «workspace». As you go through the tutorial, you will see three files created in a .vscode folder in the workspace:
tasks.json(build instructions)launch.json(debugger settings)c_cpp_properties.json(compiler path and IntelliSense settings)
Add a source code file
In the File Explorer title bar, select the New File button and name the file helloworld.cpp.

Add hello world source code
Now paste in this source code:
#include <iostream>
#include <vector>
#include <string>

using namespace std;

int main()
{
    vector<string> msg {"Hello", "C++", "World", "from", "VS Code", "and the C++ extension!"};

    for (const string& word : msg)
    {
        cout << word << " ";
    }
    cout << endl;
}
Now press kb(workbench.action.files.save) to save the file. Notice how the file you just added appears in the File Explorer view (kb(workbench.view.explorer)) in the side bar of VS Code:

You can also enable Auto Save to automatically save your file changes, by checking Auto Save in the main File menu.
The Activity Bar on the far left lets you open different views such as Search, Source Control, and Run. You’ll look at the Run view later in this tutorial. You can find out more about the other views in the VS Code User Interface documentation.
Note: When you save or open a C++ file, you may see a notification from the C/C++ extension about the availability of an Insiders version, which lets you test new features and fixes. You can ignore this notification by selecting the
X(Clear Notification).
Explore IntelliSense
In your new helloworld.cpp file, hover over vector or string to see type information. After the declaration of the msg variable, start typing msg. as you would when calling a member function. You should immediately see a completion list that shows all the member functions, and a window that shows the type information for the msg object:

You can press the kbstyle(Tab) key to insert the selected member; then, when you add the opening parenthesis, you will see information about any arguments that the function requires.
Run helloworld.cpp
Remember, the C++ extension uses the C++ compiler you have installed on your machine to build your program. Make sure you have a C++ compiler installed before attempting to run and debug helloworld.cpp in VS Code.
-
Open
helloworld.cppso that it is the active file. -
Press the play button in the top right corner of the editor.
-
Choose C/C++: cl.exe build and debug active file from the list of detected compilers on your system.

You’ll only be asked to choose a compiler the first time you run helloworld.cpp. This compiler will be set as the «default» compiler in tasks.json file.
-
After the build succeeds, your program’s output will appear in the integrated Terminal.

If you get an error trying to build and debug with cl.exe, make sure you have started VS Code from the Developer Command Prompt for Visual Studio using the code . shortcut.

The first time you run your program, the C++ extension creates tasks.json, which you’ll find in your project’s .vscode folder. tasks.json stores build configurations.
Your new tasks.json file should look similar to the JSON below:
{
"version": "2.0.0",
"tasks": [
    {
        "type": "shell",
        "label": "C/C++: cl.exe build active file",
        "command": "cl.exe",
        "args": [
            "/Zi",
            "/EHsc",
            "/Fe:",
            "${fileDirname}\${fileBasenameNoExtension}.exe",
            "${file}"
        ],
        "problemMatcher": [
            "$msCompile"
        ],
        "group": {
            "kind": "build",
            "isDefault": true
        },
        "detail": "Task generated by Debugger."
    }
]
}
Note: You can learn more about
tasks.jsonvariables in the variables reference.
The command setting specifies the program to run; in this case that is «cl.exe». The args array specifies the command-line arguments that will be passed to cl.exe. These arguments must be specified in the order expected by the compiler.
This task tells the C++ compiler to take the active file (${file}), compile it, and create an executable file (/Fe: switch) in the current directory (${fileDirname}) with the same name as the active file but with the .exe extension (${fileBasenameNoExtension}.exe), resulting in helloworld.exe for our example.
The label value is what you will see in the tasks list; you can name this whatever you like.
The detail value is what you will as the description of the task in the tasks list. It’s highly recommended to rename this value to differentiate it from similar tasks.
The problemMatcher value selects the output parser to use for finding errors and warnings in the compiler output. For cl.exe, you’ll get the best results if you use the $msCompile problem matcher.
From now on, the play button will read from tasks.json to figure out how to build and run your program. You can define multiple build tasks in tasks.json, and whichever task is marked as the default will be used by the play button. In case you need to change the default compiler, you can run Tasks: Configure default build task. Alternatively you can modify the tasks.json file and remove the default by replacing this segment:
    "group": {
        "kind": "build",
        "isDefault": true
    },
with this:
Modifying tasks.json
You can modify your tasks.json to build multiple C++ files by using an argument like "${workspaceFolder}/*.cpp" instead of ${file}.This will build all .cpp files in your current folder. You can also modify the output filename by replacing "${fileDirname}\${fileBasenameNoExtension}.exe" with a hard-coded filename (for example "${workspaceFolder}\myProgram.exe").
Debug helloworld.cpp
- Go back to
helloworld.cppso that it is the active file. - Set a breakpoint by clicking on the editor margin or using F9 on the current line.
- From the drop-down next to the play button, select Debug C/C++ File.
- Choose C/C++: cl.exe build and debug active file from the list of detected compilers on your system (you’ll only be asked to choose a compiler the first time you run/debug
helloworld.cpp).


The play button has two modes: Run C/C++ File and Debug C/C++ File. It will default to the last-used mode. If you see the debug icon in the play button, you can just click the play button to debug, instead of selecting the drop-down menu item.

If you get an error trying to build and debug with cl.exe, make sure you have started VS Code from the Developer Command Prompt for Visual Studio using the code . shortcut.
Explore the debugger
Before you start stepping through the code, let’s take a moment to notice several changes in the user interface:
-
The Integrated Terminal appears at the bottom of the source code editor. In the Debug Output tab, you see output that indicates the debugger is up and running.
-
The editor highlights the line where you set a breakpoint before starting the debugger:
-
The Run and Debug view on the left shows debugging information. You’ll see an example later in the tutorial.
-
At the top of the code editor, a debugging control panel appears. You can move this around the screen by grabbing the dots on the left side.


Step through the code
Now you’re ready to start stepping through the code.
-
Click or press the Step over icon in the debugging control panel.
This will advance program execution to the first line of the for loop, and skip over all the internal function calls within the
vectorandstringclasses that are invoked when themsgvariable is created and initialized. Notice the change in the Variables window on the left.In this case, the errors are expected because, although the variable names for the loop are now visible to the debugger, the statement has not executed yet, so there is nothing to read at this point. The contents of
msgare visible, however, because that statement has completed. -
Press Step over again to advance to the next statement in this program (skipping over all the internal code that is executed to initialize the loop). Now, the Variables window shows information about the loop variables.
-
Press Step over again to execute the
coutstatement. (Note that as of the March 2019 release, the C++ extension does not print any output to the Debug Console until the loop exits.) -
If you like, you can keep pressing Step over until all the words in the vector have been printed to the console. But if you are curious, try pressing the Step Into button to step through source code in the C++ standard library!
To return to your own code, one way is to keep pressing Step over. Another way is to set a breakpoint in your code by switching to the
helloworld.cpptab in the code editor, putting the insertion point somewhere on thecoutstatement inside the loop, and pressingkb(editor.debug.action.toggleBreakpoint). A red dot appears in the gutter on the left to indicate that a breakpoint has been set on this line.Then press
kb(workbench.action.debug.start)to start execution from the current line in the standard library header. Execution will break oncout. If you like, you can presskb(editor.debug.action.toggleBreakpoint)again to toggle off the breakpoint.


Set a watch
Sometimes you might want to keep track of the value of a variable as your program executes. You can do this by setting a watch on the variable.
-
Place the insertion point inside the loop. In the Watch window, select the plus sign and in the text box, type
word, which is the name of the loop variable. Now view the Watch window as you step through the loop. -
Add another watch by adding this statement before the loop:
int i = 0;. Then, inside the loop, add this statement:++i;. Now add a watch forias you did in the previous step. -
To quickly view the value of any variable while execution is paused on a breakpoint, you can hover over it with the mouse pointer.


Customize debugging with launch.json
When you debug with the play button or kb(workbench.action.debug.start), the C++ extension creates a dynamic debug configuration on the fly.
There are cases where you’d want to customize your debug configuration, such as specifying arguments to pass to the program at runtime. You can define custom debug configurations in a launch.json file.
To create launch.json, choose Add Debug Configuration from the play button drop-down menu.

You’ll then see a dropdown for various predefined debugging configurations. Choose C/C++: cl.exe build and debug active file.

VS Code creates a launch.json file, which looks something like this:
{
"version": "0.2.0",
"configurations": [
    {
        "name": "C/C++: cl.exe build and debug active file",
        "type": "cppvsdbg",
        "request": "launch",
        "program": "${fileDirname}\${fileBasenameNoExtension}.exe",
        "args": [],
        "stopAtEntry": false,
        "cwd": "${workspaceFolder}",
        "environment": [],
        "externalConsole": false,
        "preLaunchTask": "C/C++: cl.exe build active file"
    }
]
}
In the JSON above, program specifies the program you want to debug. Here it is set to the active file folder (${fileDirname}) and active filename with the .exe extension (${fileBasenameNoExtension}.exe), which if helloworld.cpp is the active file will be helloworld.exe. The args property is an array of arguments to pass to the program at runtime.
By default, the C++ extension won’t add any breakpoints to your source code and the stopAtEntry value is set to false.
Change the stopAtEntry value to true to cause the debugger to stop on the main method when you start debugging.
From now on, the play button and
kb(workbench.action.debug.start)will read from yourlaunch.jsonfile when launching your program for debugging.
C/C++ configurations
If you want more control over the C/C++ extension, you can create a c_cpp_properties.json file, which will allow you to change settings such as the path to the compiler, include paths, C++ standard (default is C++17), and more.
You can view the C/C++ configuration UI by running the command C/C++: Edit Configurations (UI) from the Command Palette (kb(workbench.action.showCommands)).

This opens the C/C++ Configurations page. When you make changes here, VS Code writes them to a file called c_cpp_properties.json in the .vscode folder.

Visual Studio Code places these settings in .vscodec_cpp_properties.json. If you open that file directly, it should look something like this:
{
"configurations": [
    {
        "name": "Win32",
        "includePath": [
            "${workspaceFolder}/**"
        ],
        "defines": [
            "_DEBUG",
            "UNICODE",
            "_UNICODE"
        ],
        "windowsSdkVersion": "10.0.18362.0",
        "compilerPath": "C:/Program Files (x86)/Microsoft Visual Studio/2019/BuildTools/VC/Tools/MSVC/14.24.28314/bin/Hostx64/x64/cl.exe",
        "cStandard": "c11",
        "cppStandard": "c++17",
        "intelliSenseMode": "msvc-x64"
    }
],
"version": 4
}
You only need to add to the Include path array setting if your program includes header files that are not in your workspace or in the standard library path.
Compiler path
The compilerPath setting is an important setting in your configuration. The extension uses it to infer the path to the C++ standard library header files. When the extension knows where to find those files, it can provide useful features like smart completions and Go to Definition navigation.
The C/C++ extension attempts to populate compilerPath with the default compiler location based on what it finds on your system. The extension looks in several common compiler locations.
The compilerPath search order is:
- First check for the Microsoft Visual C++ compilerOpe
- Then look for g++ on Windows Subsystem for Linux (WSL)
- Then g++ for Mingw-w64.
If you have g++ or WSL installed, you might need to change compilerPath to match the preferred compiler for your project. For Microsoft C++, the path should look something like this, depending on which specific version you have installed: «C:/Program Files (x86)/Microsoft Visual Studio/2017/BuildTools/VC/Tools/MSVC/14.16.27023/bin/Hostx64/x64/cl.exe».
Reusing your C++ configuration
VS Code is now configured to use the Microsoft C++ compiler. The configuration applies to the current workspace. To reuse the configuration, just copy the JSON files to a .vscode folder in a new project folder (workspace) and change the names of the source file(s) and executable as needed.
Run VS Code outside the Developer Command Prompt
In certain circumstances, it isn’t possible to run VS Code from Developer Command Prompt for Visual Studio (for example, in Remote Development through SSH scenarios). In that case, you can automate initialization of Developer Command Prompt for Visual Studio during the build using the following tasks.json configuration:
{
    "version": "2.0.0",
    "windows": {
        "options": {
            "shell": {
                "executable": "cmd.exe",
                "args": [
                    "/C",
                    // The path to VsDevCmd.bat depends on the version of Visual Studio you have installed.
                    ""C:/Program Files (x86)/Microsoft Visual Studio/2019/Community/Common7/Tools/VsDevCmd.bat"",
                    "&&"
                ]
            }
        }
    },
    "tasks": [
        {
            "type": "shell",
            "label": "cl.exe build active file",
            "command": "cl.exe",
            "args": [
                "/Zi",
                "/EHsc",
                "/Fe:",
                "${fileDirname}\${fileBasenameNoExtension}.exe",
                "${file}"
            ],
            "problemMatcher": [
                "$msCompile"
            ],
            "group": {
                "kind": "build",
                "isDefault": true
            }
        }
    ]
}
Note: The path to
VsDevCmd.batmight be different depending on the Visual Studio version or installation path. You can find the path toVsDevCmd.batby opening a Command Prompt and runningdir "VsDevCmd*" /s.
Troubleshooting
The term ‘cl.exe’ is not recognized
If you see the error «The term ‘cl.exe’ is not recognized as the name of a cmdlet, function, script file, or operable program.», this usually means you are running VS Code outside of a Developer Command Prompt for Visual Studio and VS Code doesn’t know the path to the cl.exe compiler.
VS Code must either be started from the Developer Command Prompt for Visual Studio, or the task must be configured to run outside a Developer Command Prompt.
You can always check that you are running VS Code in the context of the Developer Command Prompt by opening a new Terminal (kb(workbench.action.terminal.new)) and typing ‘cl’ to verify cl.exe is available to VS Code.
fatal error C1034: assert.h: no include path set
In this case, cl.exe is available to VS Code through the PATH environment variable, but VS Code still needs to either be started from the Developer Command Prompt for Visual Studio, or be configured to run outside the Developer Command Prompt. Otherwise, cl.exe does not have access to important environment variables such as INCLUDE.
Next steps
- Explore the VS Code User Guide.
- Review the Overview of the C++ extension.
- Create a new workspace, copy your
.vscodeJSON files to it, adjust the necessary settings for the new workspace path, program name, and so on, and start coding!
Improve Article
Save Article
Improve Article
Save Article
In this article, we will learn how to compile and run C++ program in VS Code. There are two ways of doing that you can use any one of them as per your convenience. It is to be noted that a majority of competitive programmers use C++, therefore the compilation and execution of the program needs to be done quickly. Some methods which are discussed in this article almost automate the process of compilation and execution.
Program:
Let below be the code to demonstrate compilation and execution:
C++
#include <bits/stdc++.h>
using namespace std;
int main()
{
int a, b;
cin >> a >> b;
int sum = a + b;
cout << sum;
return 0;
}
Using Integrated Command Line:
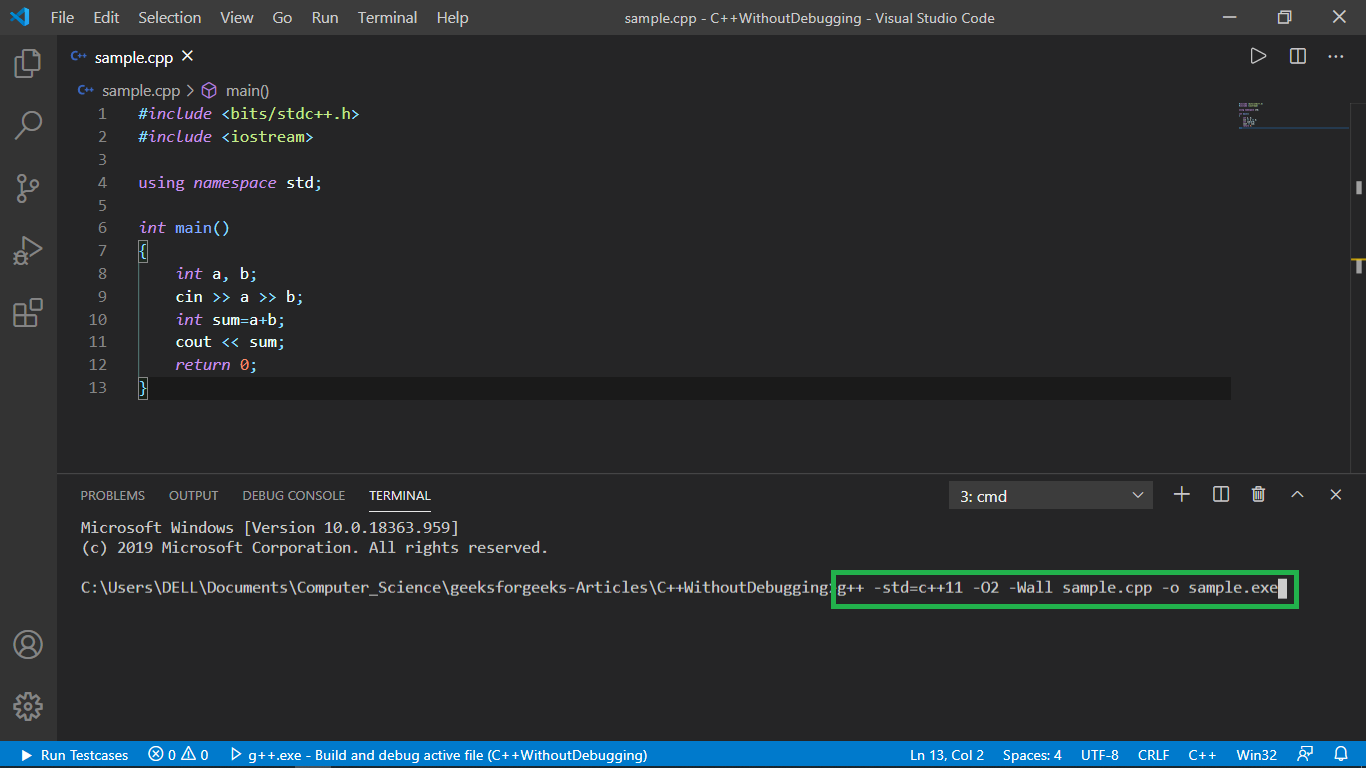
For compilation and creation of executable file run the below command:
g++ -std = c++11 -O2 -Wall programName.cpp -o programName.exe
Understanding different terms in above command:
- g++: tells the computer the given command is for g++ compiler.
- -std = c++11: the compiler follows C++11 standard, you can set it to -std = c++14 or -std=c++17 based on what you want to use.
- -O2: Optimizes the code
- -Wall: shows warnings about possible errors
- programName.cpp: refers to the c++ file to be compiled
- -o programName.exe: creates a executable file of the suggested name( here programName.exe).
Note: The name of cpp file and executable file need not be same.
Steps:
- Hover over terminal tab and select New Terminal.

- Command prompt will open with current directory.
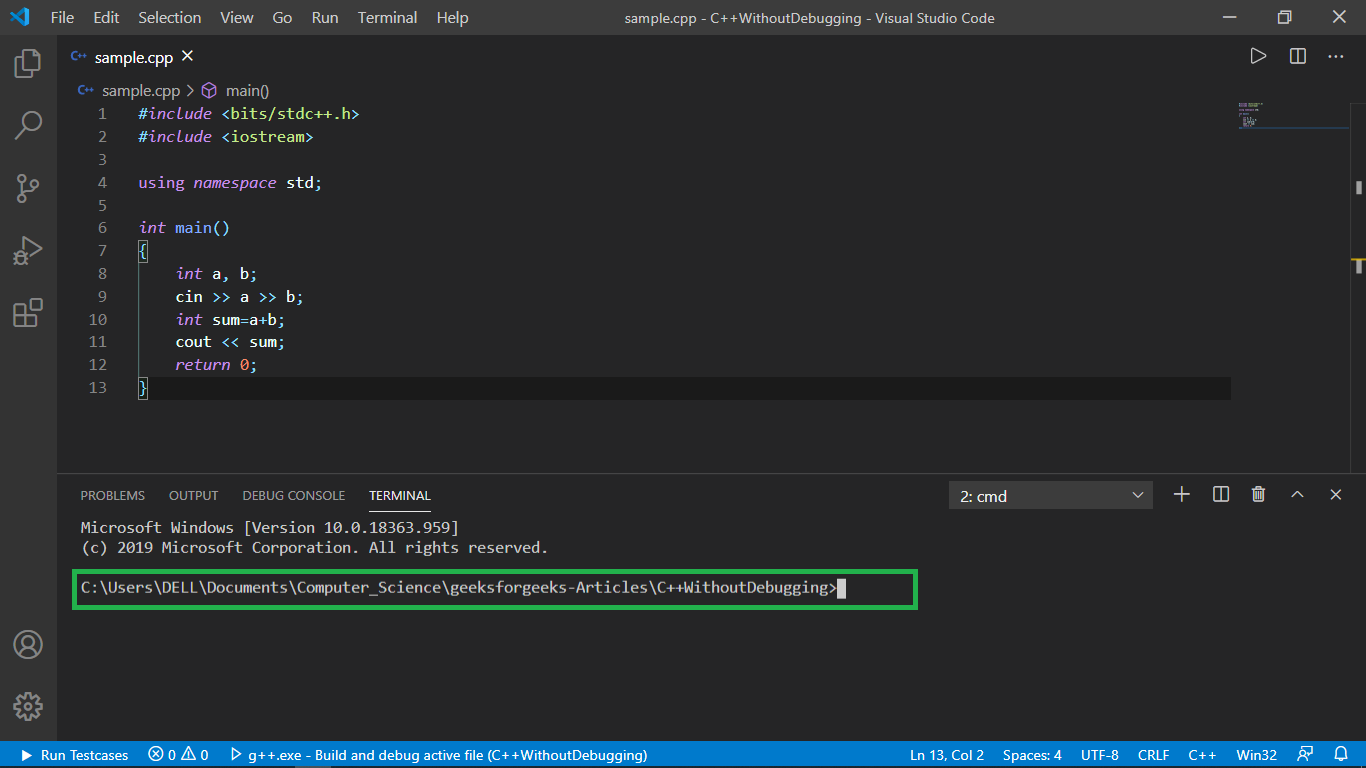
- Type the syntax given above with suitable program-name and executable file name.
- Press Enter and
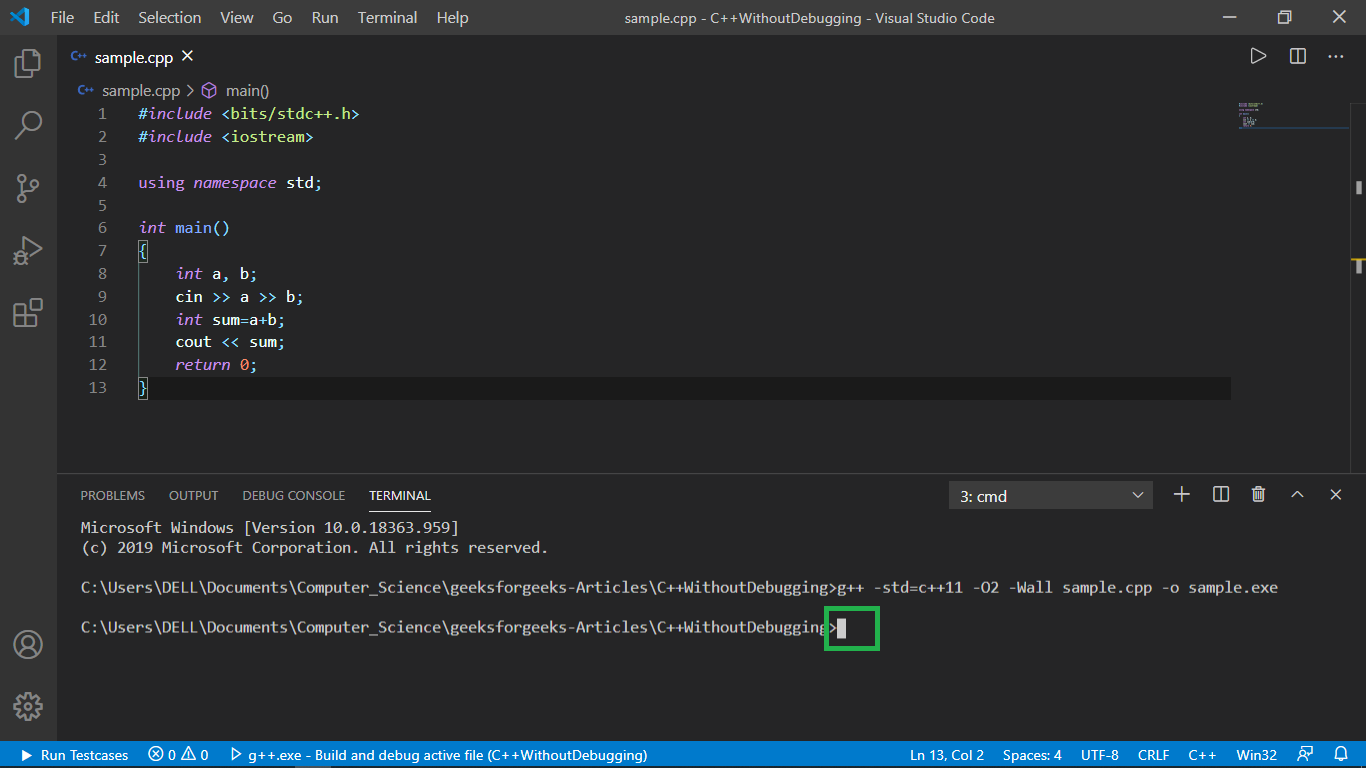
Method 1 – Calling Executable File and Managing Input/Output
Input/Output in command line itself:
- Pass the executable file to be run and press enter.
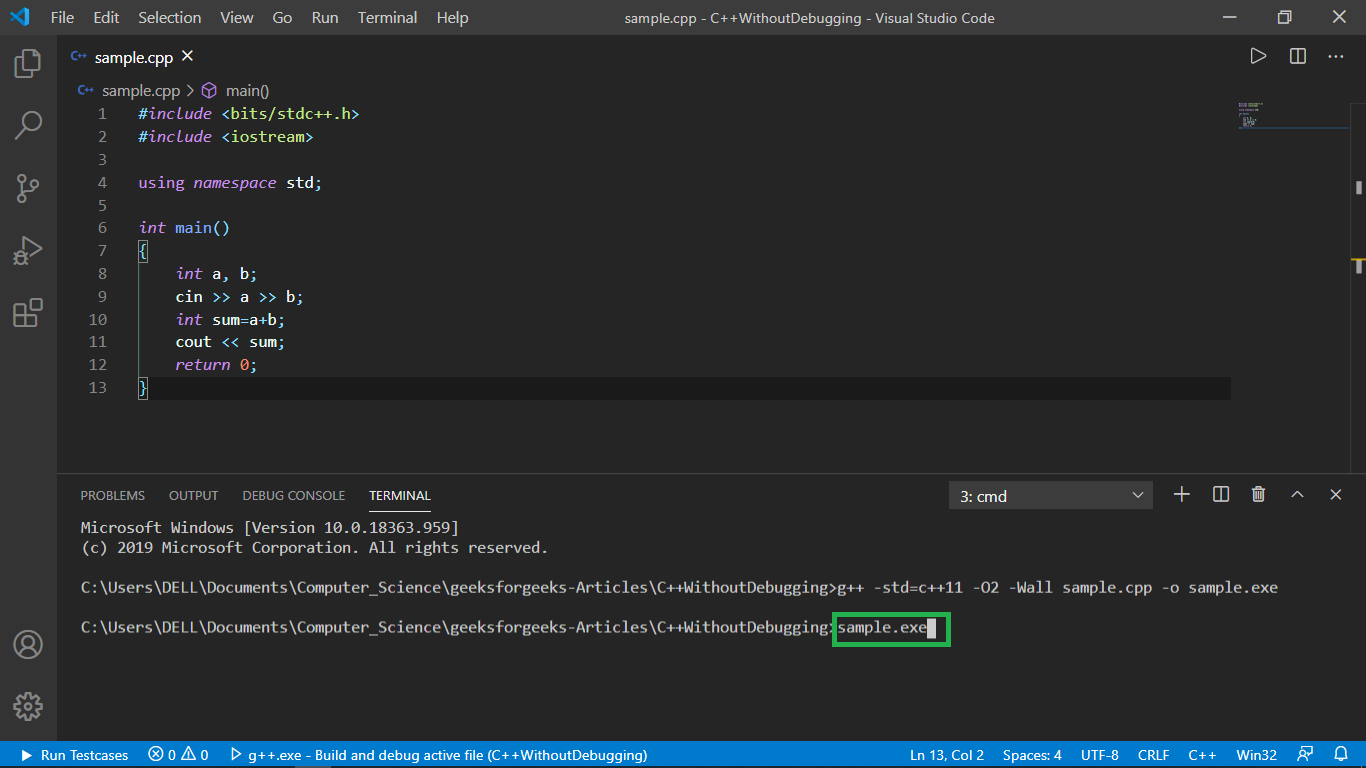
- Type the required input, each separated by space and press enter.
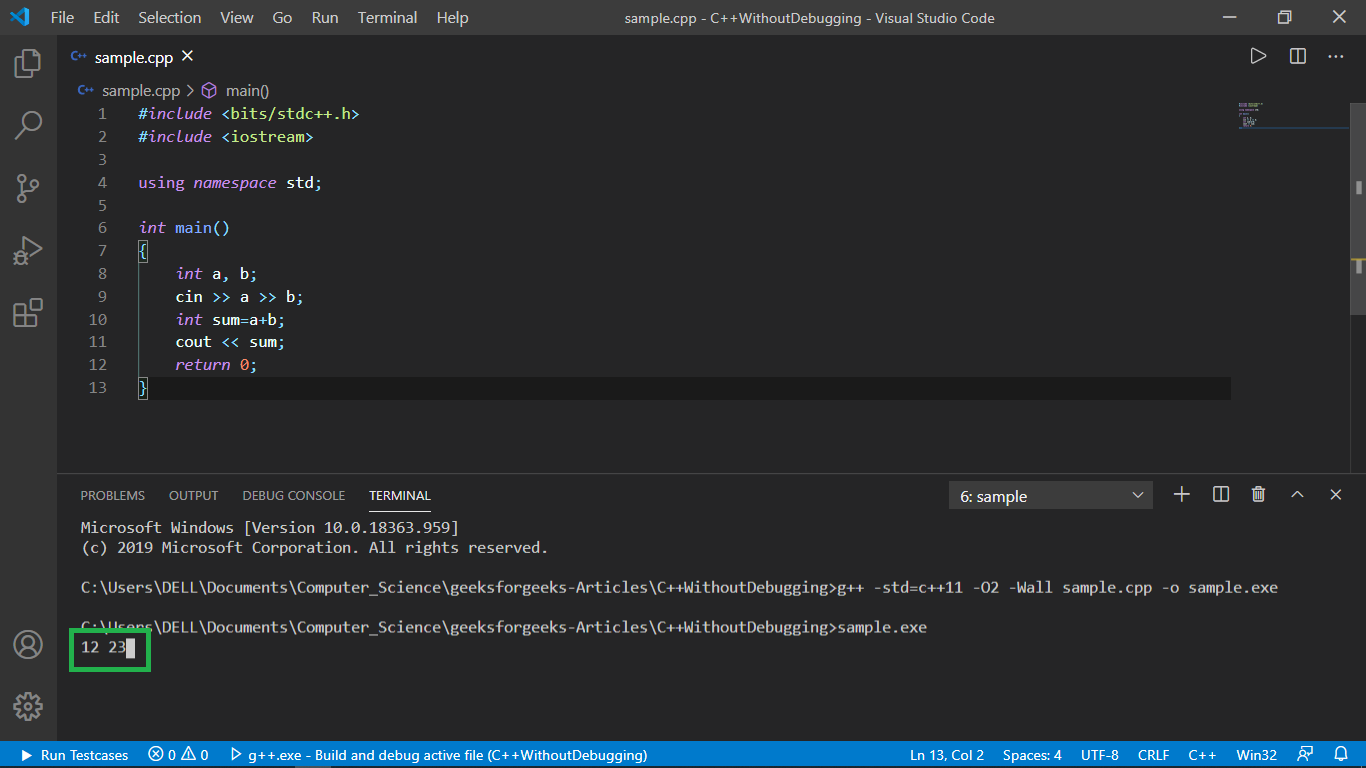
- The required output shall be displayed in a new-line of the command line as shown below.

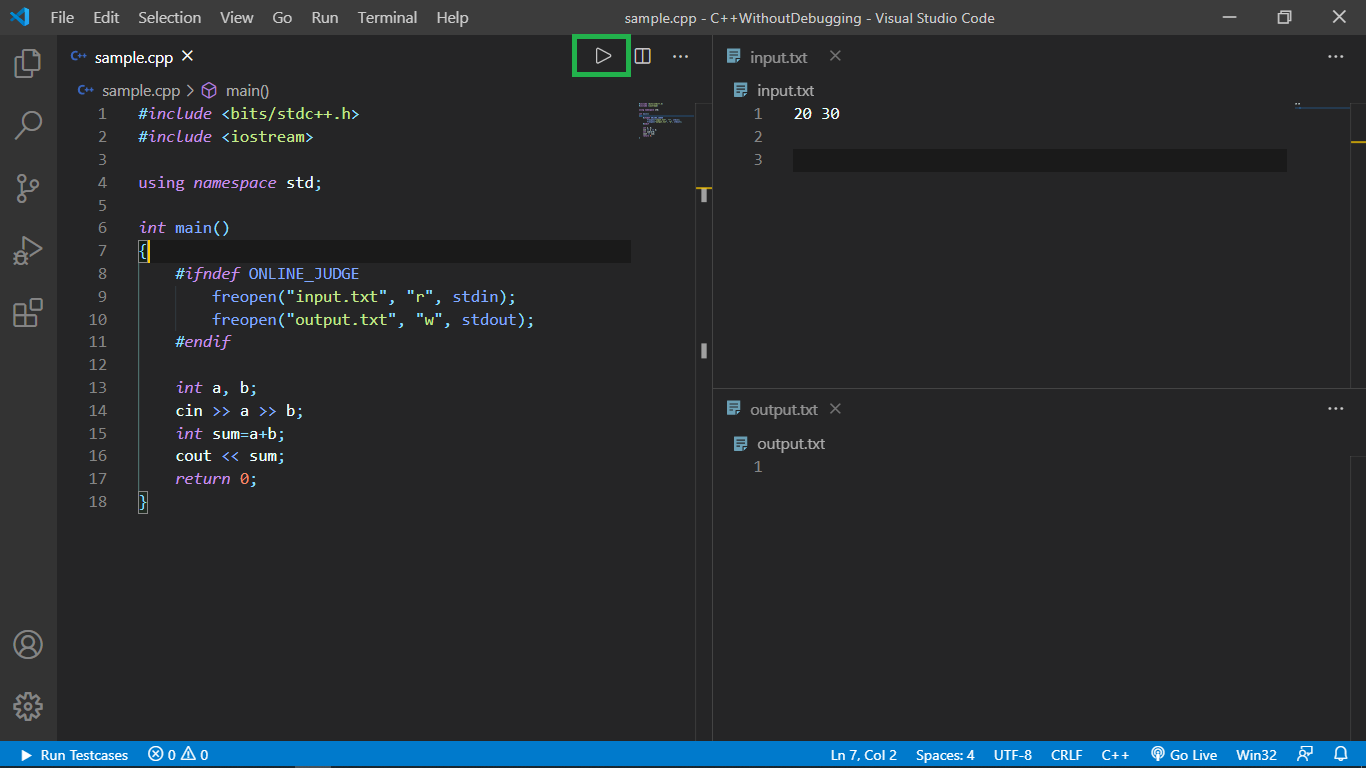
Input/Output through text files:
- Create two text files input.txt and output.txt. Make sure input.txt contains the required to be input.

- Paste the following code just inside your main() function.
C++
#ifndef ONLINE_JUDGE
freopen("input.txt", "r", stdin);
freopen("output.txt", "w", stdout);
#endif
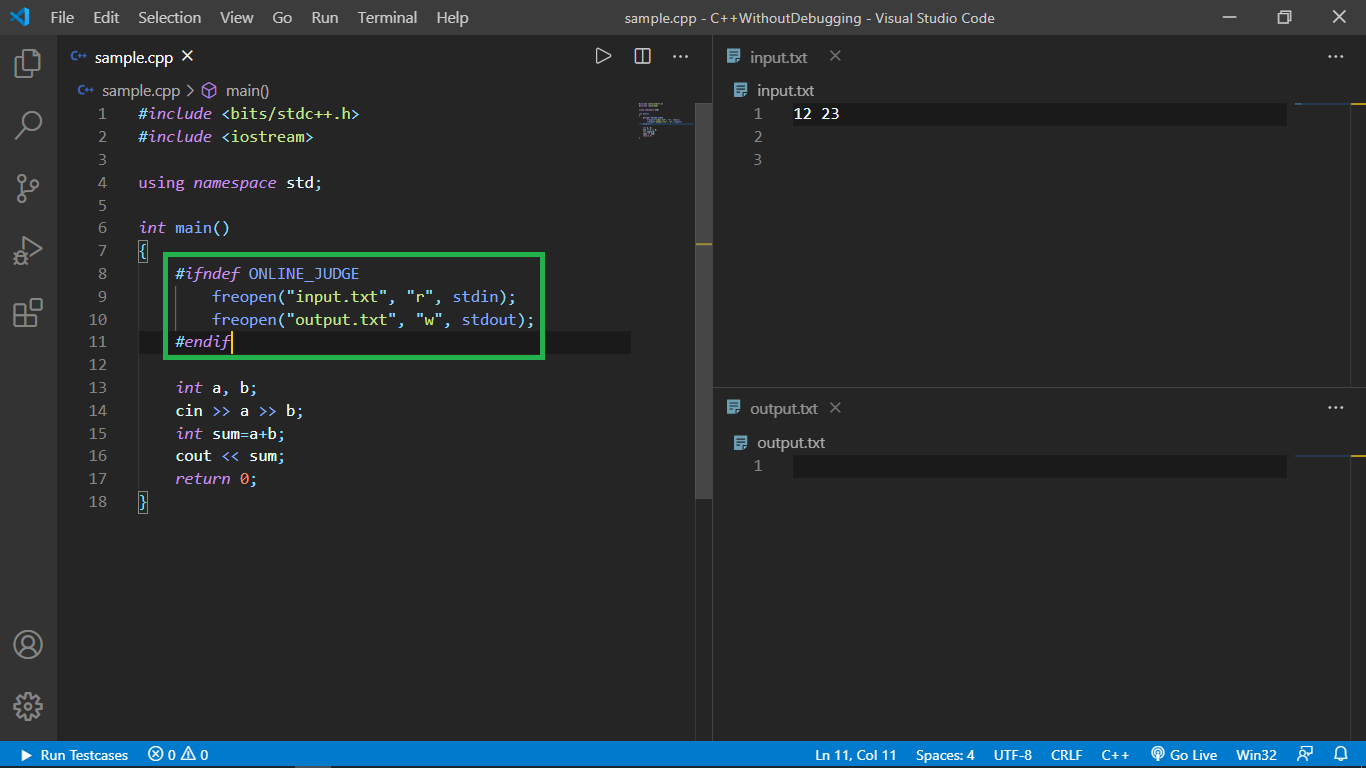
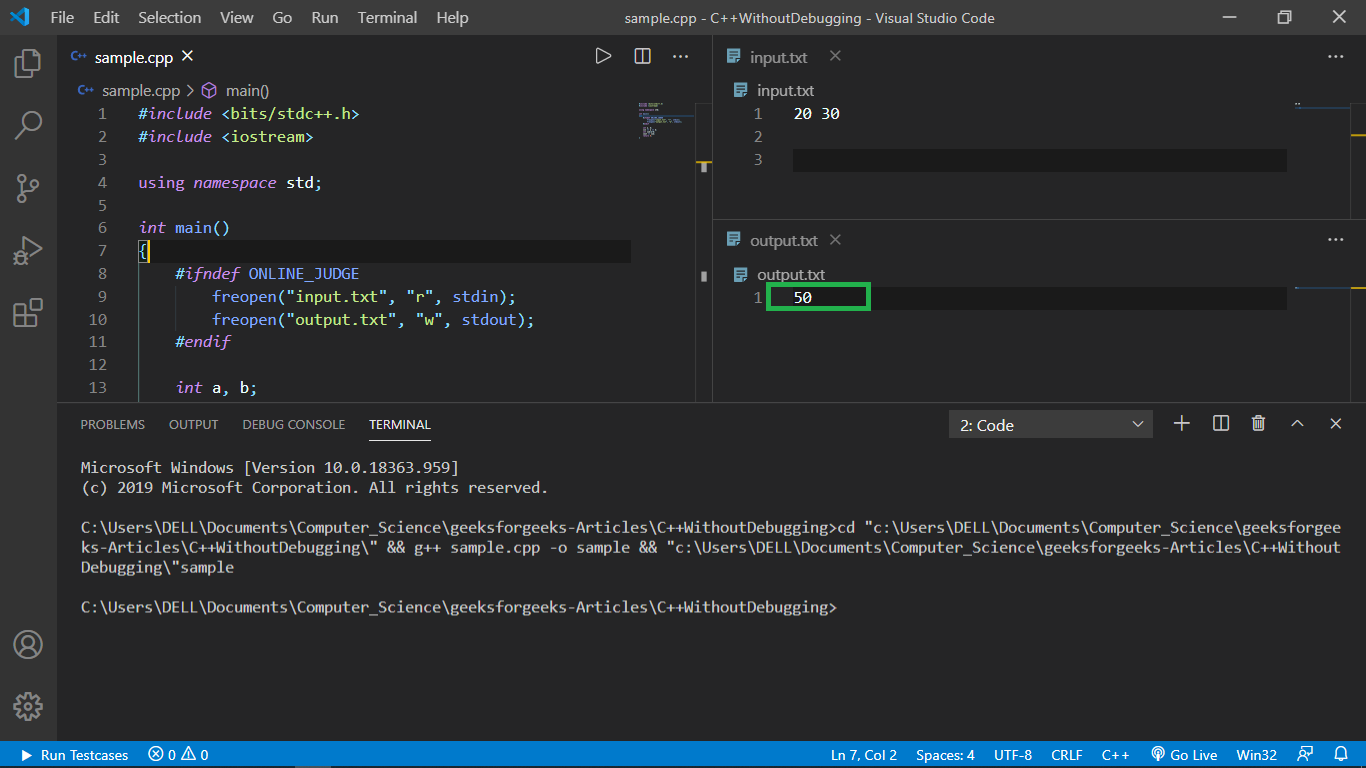
- Compile the new code again with preferably the same name for executable file.

- Pass the executable file to be run in the command line and press enter

- You would notice the output in output.txt file.

Method 2 – Using Code-Runner Extension:
Using the template created so far, we can easily upgrade to code runner. Below are the steps:
- Install the code runner extension as shown below:
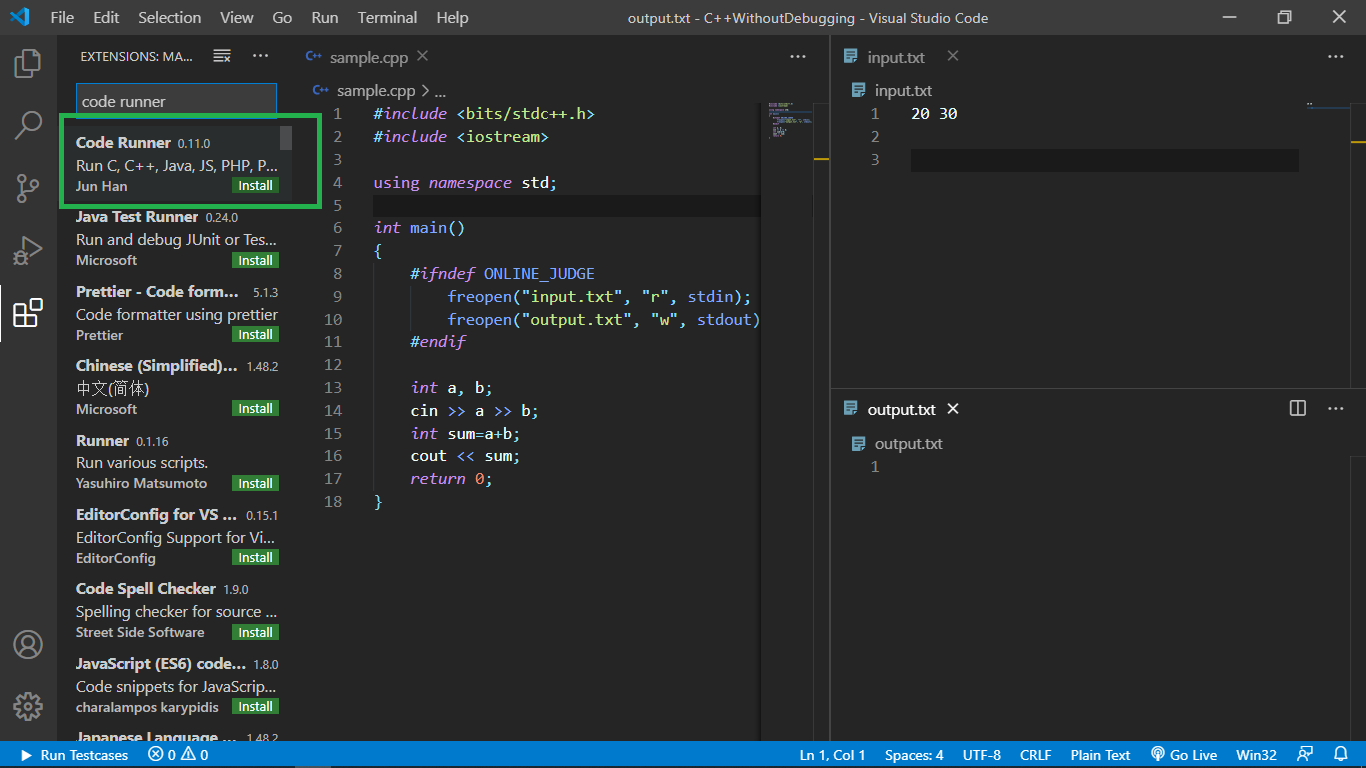
- Click on the play button on the top-right of the window as shown below:
- The output of the program is displayed automatically in output.txt file.
Input/Output using Competitive Programming Helper (cph) extension:
- Firstly search and install cph by Divyanshu Agrawal

- Now, we are going to run a simple program and try to show learn how to use this ext.

- Using +New Testcase, we different test cases and their expected outputs respectively.

- Using Run All , we run all test cases

Improve Article
Save Article
Improve Article
Save Article
In this article, we will learn how to compile and run C++ program in VS Code. There are two ways of doing that you can use any one of them as per your convenience. It is to be noted that a majority of competitive programmers use C++, therefore the compilation and execution of the program needs to be done quickly. Some methods which are discussed in this article almost automate the process of compilation and execution.
Program:
Let below be the code to demonstrate compilation and execution:
C++
#include <bits/stdc++.h>
using namespace std;
int main()
{
int a, b;
cin >> a >> b;
int sum = a + b;
cout << sum;
return 0;
}
Using Integrated Command Line:
For compilation and creation of executable file run the below command:
g++ -std = c++11 -O2 -Wall programName.cpp -o programName.exe
Understanding different terms in above command:
- g++: tells the computer the given command is for g++ compiler.
- -std = c++11: the compiler follows C++11 standard, you can set it to -std = c++14 or -std=c++17 based on what you want to use.
- -O2: Optimizes the code
- -Wall: shows warnings about possible errors
- programName.cpp: refers to the c++ file to be compiled
- -o programName.exe: creates a executable file of the suggested name( here programName.exe).
Note: The name of cpp file and executable file need not be same.
Steps:
- Hover over terminal tab and select New Terminal.
- Command prompt will open with current directory.
- Type the syntax given above with suitable program-name and executable file name.
- Press Enter and
Method 1 – Calling Executable File and Managing Input/Output
Input/Output in command line itself:
- Pass the executable file to be run and press enter.
- Type the required input, each separated by space and press enter.
- The required output shall be displayed in a new-line of the command line as shown below.
Input/Output through text files:
- Create two text files input.txt and output.txt. Make sure input.txt contains the required to be input.
- Paste the following code just inside your main() function.
C++
#ifndef ONLINE_JUDGE
freopen("input.txt", "r", stdin);
freopen("output.txt", "w", stdout);
#endif
- Compile the new code again with preferably the same name for executable file.
- Pass the executable file to be run in the command line and press enter
- You would notice the output in output.txt file.
Method 2 – Using Code-Runner Extension:
Using the template created so far, we can easily upgrade to code runner. Below are the steps:
- Install the code runner extension as shown below:
- Click on the play button on the top-right of the window as shown below:
- The output of the program is displayed automatically in output.txt file.
Input/Output using Competitive Programming Helper (cph) extension:
- Firstly search and install cph by Divyanshu Agrawal
- Now, we are going to run a simple program and try to show learn how to use this ext.
- Using +New Testcase, we different test cases and their expected outputs respectively.
- Using Run All , we run all test cases
The basic problem here is that building and linking a C++ program depends heavily on the build system in use. You will need to support the following distinct tasks, using some combination of plugins and custom code:
-
General C++ language support for the editor. This is usually done using ms-vscode.cpptools, which most people expect to also handle a lot of other stuff, like build support. Let me save you some time: it doesn’t. However, you will probably want it anyway.
-
Build, clean, and rebuild tasks. This is where your choice of build system becomes a huge deal. You will find plugins for things like CMake and Autoconf (god help you), but if you’re using something like Meson and Ninja, you are going to have to write some helper scripts, and configure a custom «tasks.json» file to handle these. Microsoft has totally changed everything about that file over the last few versions, right down to what it is supposed to be called and the places (yes, placeS) it can go, to say nothing of completely changing the format. Worse, they’ve SORT OF kept backward compatibility, to be sure to use the «version» key to specify which variant you want. See details here:
https://code.visualstudio.com/docs/editor/tasks
…but note conflicts with:
https://code.visualstudio.com/docs/languages/cpp
WARNING: IN ALL OF THE ANSWERS BELOW, ANYTHING THAT BEGINS WITH A «VERSION» TAG BELOW 2.0.0 IS OBSOLETE.
Here’s the closest thing I’ve got at the moment. Note that I kick most of the heavy lifting off to scripts, this doesn’t really give me any menu entries I can live with, and there isn’t any good way to select between debug and release without just making another three explicit entries in here. With all that said, here is what I can tolerate as my .vscode/tasks.json file at the moment:
{
    // See https://go.microsoft.com/fwlink/?LinkId=733558
    // for the documentation about the tasks.json format
    "version": "2.0.0",
    "tasks": [
        {
            "label": "build project",
            "type": "shell",
            "command": "buildscripts/build-debug.sh",
            "args": [],

            "group": {
                "kind": "build",
                "isDefault": true
            },
            "presentation": {
                // Reveal the output only if unrecognized errors occur.
                "echo": true,
                "focus": false,
                "reveal": "always",
                "panel": "shared"
            },

            // Use the standard MS compiler pattern to detect errors, warnings and infos
            "options": {
                "cwd": "${workspaceRoot}"
            },
            "problemMatcher": {
                "owner": "cpp",
                "fileLocation": ["relative", "${workspaceRoot}/DEBUG"],
                "pattern": {
                    "regexp": "^(.*):(\d+):(\d+):\s+(warning|error):\s+(.*)$",
                    "file": 1,
                    "line": 2,
                    "column": 3,
                    "severity": 4,
                    "message": 5
                }
            }
        },
        {
            "label": "rebuild project",
            "type": "shell",
            "command": "buildscripts/rebuild-debug.sh",
            "args": [],
            "group": {
                "kind": "build",
                "isDefault": true
            },
            "presentation": {
                // Reveal the output only if unrecognized errors occur.
                "echo": true,
                "focus": false,
                "reveal": "always",
                "panel": "shared"
            },

            // Use the standard MS compiler pattern to detect errors, warnings and infos
            "options": {
                "cwd": "${workspaceRoot}"
            },
            "problemMatcher": {
                "owner": "cpp",
                "fileLocation": ["relative", "${workspaceRoot}/DEBUG"],
                "pattern": {
                    "regexp": "^(.*):(\d+):(\d+):\s+(warning|error):\s+(.*)$",
                    "file": 1,
                    "line": 2,
                    "column": 3,
                    "severity": 4,
                    "message": 5
                }
            }
        },
        {
            "label": "clean project",
            "type": "shell",
            "command": "buildscripts/clean-debug.sh",
            "args": [],

            "group": {
                "kind": "build",
                "isDefault": true
            },
            "presentation": {
                // Reveal the output only if unrecognized errors occur.
                "echo": true,
                "focus": false,
                "reveal": "always",
                "panel": "shared"
            },

            // Use the standard MS compiler pattern to detect errors, warnings and infos
            "options": {
                "cwd": "${workspaceRoot}"
            },
            "problemMatcher": {
                "owner": "cpp",
                "fileLocation": ["relative", "${workspaceRoot}/DEBUG"],
                "pattern": {
                    "regexp": "^(.*):(\d+):(\d+):\s+(warning|error):\s+(.*)$",
                    "file": 1,
                    "line": 2,
                    "column": 3,
                    "severity": 4,
                    "message": 5
                }
            }
        }
    ]
}
Note that, in theory, this file is supposed to work if you put it in the workspace root, so that you aren’t stuck checking files in hidden directories (.vscode) into your revision control system. I have yet to see that actually work; test it, but if it fails, put it in .vscode. Either way, the IDE will bitch if it isn’t there anyway. (Yes, at the moment, this means I have been forced to check .vscode into subversion, which I’m not happy about.) Note that my build scripts (not shown) simply create (or recreate) a DEBUG directory using, in my case, meson, and build inside it (using, in my case, ninja).
- Run, debug, attach, halt. These are another set of tasks, defined in «launch.json». Or at least they used to be. Microsoft has made such a hash of the documentation, I’m not even sure anymore.
Поскольку мне всё равно пришлось ставить Visual Studio Community для того, чтобы установить Windows Kits для работы с WinAPI, то я решил не использовать MingW, а доустановить C++ build tools и использовать их для компиляции. В этом случае придётся переделать задачи (tasks) и настройки VSCode.
Хорошее описание нашёл здесь, его и буду использовать в данной заметке.
Нам потребуется
1. Естественно нам потребуется сама программа VSCode.
2. В Visual Studio Community должен быть установлен компонент Desktop development with C++:
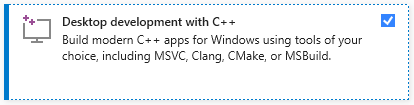
Чтобы проверить успешную установку, достаточно вызвать Developer Command Prompt for VS 2019 (файл VsDevCmd.bat) из Пуска. Там нужно запустить файл cl.exe. Вывод консоли должен быть без ошибок:
**********************************************************************
** Visual Studio 2019 Developer Command Prompt v16.9.2
** Copyright (c) 2021 Microsoft Corporation
**********************************************************************

C:Program Files (x86)Microsoft Visual Studio2019Community>cl.exe
Microsoft (R) C/C++ Optimizing Compiler Version 19.28.29913 for x86
Copyright (C) Microsoft Corporation.  All rights reserved.

usage: cl [ option... ] filename... [ /link linkoption... ]
3. Для VSCode должно быть установлено дополнение (расширение) Microsoft C/C++
Настройка
4. В Проводнике открываем рабочую папку проекта и, удерживая Shift , нажимаем правую кнопку мыши, после чего выбираем
5. В открывшемся окошке PowerShell запускаем VSCode, для этого нужно набрать code . и нажать Enter :
PS C:UsersDenissourcereposSampleVSCode> code .
6. В запущенном редакторе создадим новый файл:
▶
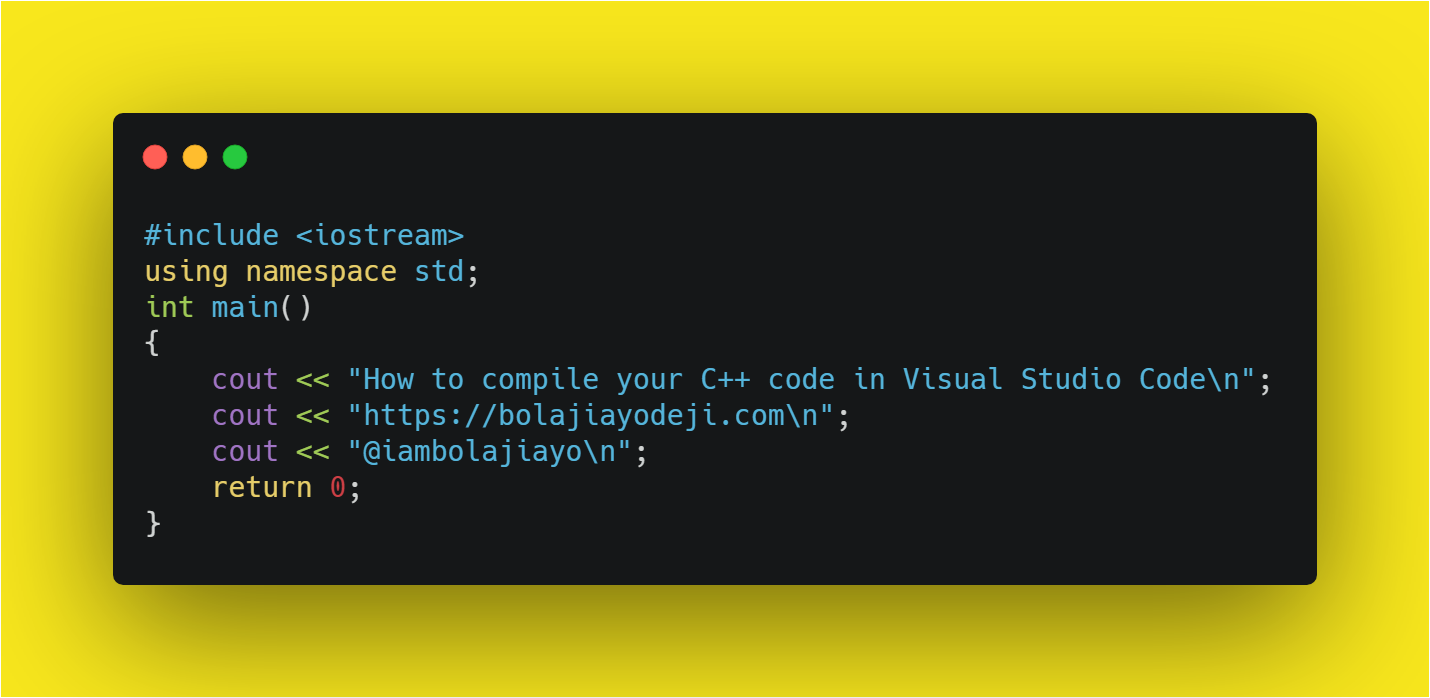
7. Это просто тест, поэтому код будет простейшим:
#include <iostream>
using namespace std;

int main()
{
    cout << "It Works!" << endl;
    cin.get();
}
8. Сохраним файл под именем main.cpp:
▶
Шаги 9-11 скорее всего не нужны. В статье они есть, но без них у меня всё тоже прекрасно компилируется.
9. Открываем палитру команд с помощью комбинации клавиш Ctrl+Shift+P
10. Список большой, поэтому проще ввести часть слова и выбрать нужную команду из списка:
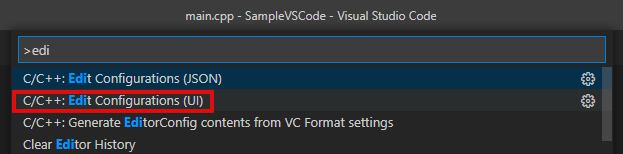
11. В конфигурации необходимо проверить, а, при необходимости, установить путь для компилятора:
C:/Program Files (x86)/Microsoft Visual Studio/2019/Community/VC/Tools/MSVC/14.28.29910/bin/Hostx64/x64/cl.exe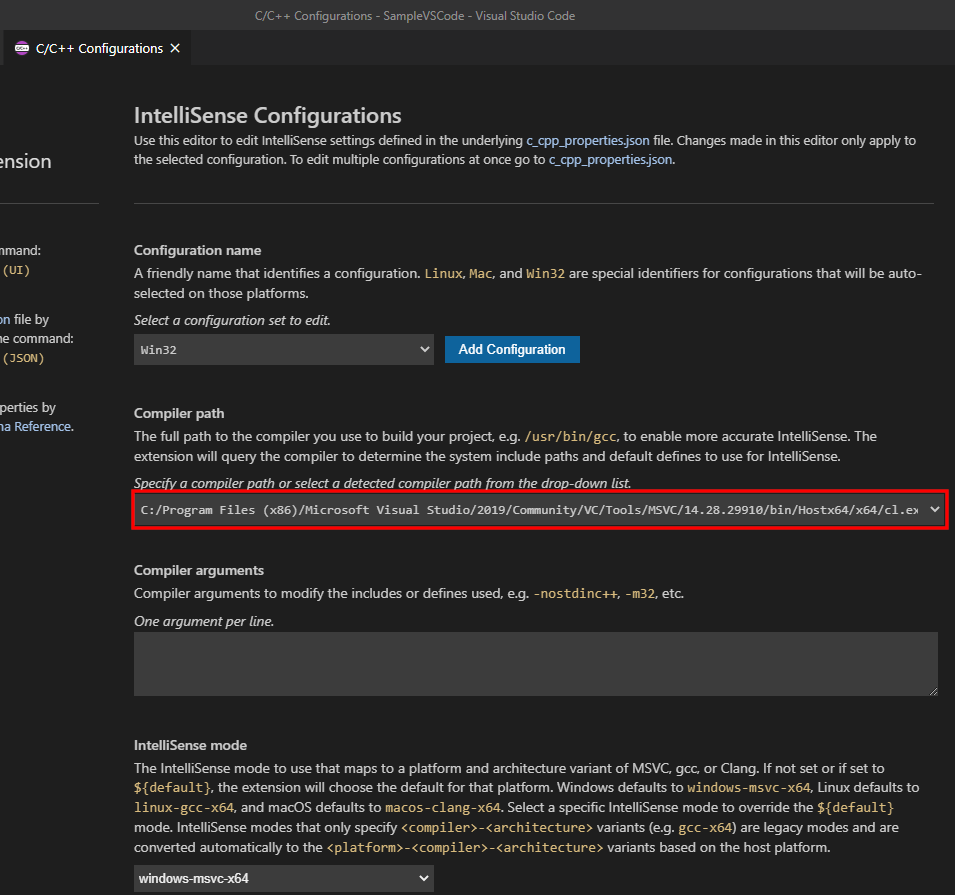
12. Внесём изменения в файл settings.json:
У меня глобальный файл настроек, а не только для проекта, поэтому я добавляю строчки в начало файла C:UsersDenisAppDataRoamingCodeUsersettings.json
"buildDir": "${workspaceRoot}\build",
"buildCommand": "C:\Program^ Files^ ^(x86^)\Microsoft^ Visual^ Studio\2019\Community\Common7\Tools\VsDevCmd.bat && cl",
13. Ранее я уже создавал файл Задач tasks.json, поэтому сейчас я добавлю к нему новые строчки:
{
      "type": "shell",
      "label": "Set dependencies for build",
      "command": "if not exist ${config:buildDir} mkdir ${config:buildDir}"
    },
    {
      "label": "C/C++: cl.exe build active file",
      "detail": "Compile and build selected C++ project with Visual Studio cl.exe",
      "type": "shell",
      "command": "${config:buildCommand}",
      "args": [
        "/Zi",
        "/EHsc",
        "/Fe:",
        "${config:buildDir}\${fileBasenameNoExtension}.exe",
        "/Fo${config:buildDir}\",
        "/Fd${config:buildDir}\",
        "${file}"
      ],
      "options": {
        "cwd": "${workspaceFolder}"
      },
      "problemMatcher": ["$msCompile"],
      "group": {
        "kind": "build",
        "isDefault": true
      },
      "dependsOn": [
        "Set dependencies for build"
      ]
    },
Спасибо Владимиру, который указал в комментарии, что может возникнуть такая ошибка:
~ Missing '(' after 'if' in if statement.
    CategoryInfo : ParserError: (:) [], ParentContainsErrorRecordException

    FullyQualifiedErrorId : MissingOpenParenthesisInIfStatement
В этом случае фрагмент кода с проверкой пути должен быть таким:
{
      "type": "shell",
      "label": "Set dependencies for build",
      "command": "cmd",
      "args": [
        "/C",
        "if not exist ${config:buildDir} mkdir ${config:buildDir}"
      ]
    },
Хотя, если у вас VSCode настроен для работы с CMD, а не PowerShell, то ошибки быть не должно!
14. Чтобы у нас была возможность запустить проект на отладку, можно использовать файл launch.json. Но я не хочу создавать такой файл для каждого проекта каждый раз, поэтому сделаю глобальную конфигурацию. Для этого я добавлю строчки в файл settings.json:
"launch": {
  "version": "0.2.0",
  "configurations":
  [{
    "name": "cl.exe - Build and debug active file",
    "type": "cppvsdbg",
    "request": "launch",
    "program": "${config:buildDir}\${fileBasenameNoExtension}.exe",
    "args": [],
    "stopAtEntry": false,
    "cwd": "${env:buildDir}",
    "environment": [],
    "console": "externalTerminal",
    "preLaunchTask": "C/C++: cl.exe build active file"
  }]
},
Благодаря этому, при нажатии F5 , проект будет откомпилирован, а потом запущен сразу после этого. Просто запустить, без отладки, можно комбинацией Ctrl+F5
- Об авторе
- Недавние публикации

PS: This was published on my Blog here.
C++ is a statically-typed, free-form, (usually) compiled, multi-paradigm, intermediate-level general-purpose middle-level programming language.
In simple terms, C++ is a sophisticated, efficient, general-purpose programming language based on C.
It was developed by Bjarne Stroustrup in 1979.
One of C++’s main features is the compiler. This is used to compile and run C++ code.
A compiler is a special program that processes statements written in a particular programming language like C++ and turns them into machine language or «code» that a computer’s processor uses. (Source)
I actually wrote this article because I had a C++ assignment which required using a compiler. As usual, everyone was using the CodeBlocks IDE and Visual Studio IDE. But I was already used to Visual Studio Code for all my programming stuff.
I then set out to find a way of compiling C++ directly inside my own VsCode Editor, hence this article :).
In this article, I’ll show you how to set up your compiler in VsCode and give you some links to some of the best C++ resources.

Prerequisites
- Prior knowledge of C++
(I assume you’re learning C++, about to start learning, or just reading this for fun. This article is not a C++ 101 tutorial – some understanding of C++ is needed.) - Visual Studio Code Editor
Download here and read the setup docs for Windows, Linux and Mac - Internet connection (!important)
Disclaimer!
I will be using a Windows OS throughout this article, but I’ll provide links to resources that will help those using other operating systems.
Now let’s get started!
Download and install a C++ compiler
- Head to www.mingw.org and click the “Download/Installer” link to download the MinGW setup file, or click here for Windows, here for Linux, and here for Mac
MinGW, a contraction of «Minimalist GNU for Windows», is a minimalist development environment for native Microsoft Windows applications. (Source)
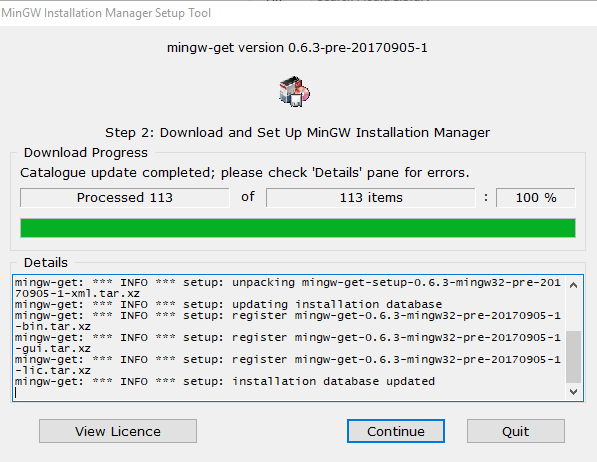
- After downloading, install MinGW and wait for the “MinGW Installation Manager” to show up.
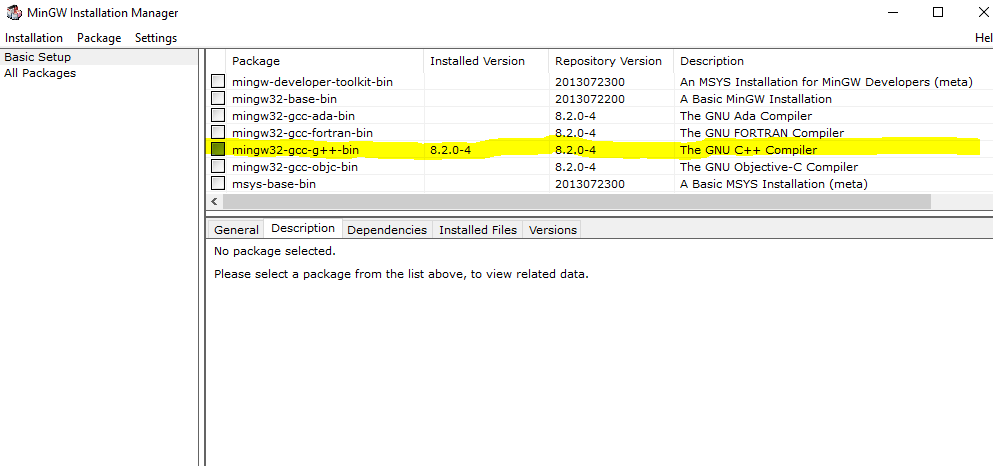
- When the “MinGW Installation Manager” shows up, click on
mingw32-gcc-g++then select “Mark for Installation”
- In the menu at the top left corner, click on “Installation > Apply Changes”
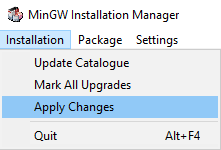
- Wait and allow to install completely. Ensure you have a stable internet connection during this process.
Edit your PATH environment variable to include the directory where the C++ compiler is located
PATH is an environment variable on Unix-like operating systems, DOS, OS/2, and Microsoft Windows, specifying a set of directories where executable programs are located. In general, each executing process or user session has its own PATH setting. — Wikipedia
After installing MinGW, it can be found in C:MinGWbin. Now you have to include this directory in your environment variable PATH. If you’ve been using computers for a while now you should know how to do this already, but if you don’t, here are a few resources:
- Click here for a Windows OS guide
- Click here for Linux
- Click here for a Mac OS guide
Install Code Runner extension in VS Code
Now we have our compiler set up, let’s install Code Runner
Code Runner allows you to Run code snippet or code file for multiple languages:
C, C++, Java, JavaScript, PHP, Python, Perl, Perl 6, Ruby, Go, Lua, Groovy, PowerShell, BAT/CMD, BASH/SH, F# Script, F# (.NET Core), C# Script, C# (.NET Core), VBScript, TypeScript, CoffeeScript, Scala, Swift, Julia, Crystal, OCaml Script, R, AppleScript, Elixir, Visual Basic .NET, Clojure, Haxe, Objective-C, Rust, Racket, AutoHotkey, AutoIt, Kotlin, Dart, Free Pascal, Haskell, Nim, D, Lisp, Kit, and custom command.
- Click here to download
- Or search in VsCode marketplace tab
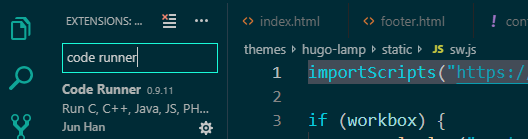
- After installing restart VsCode
- Open your C++ file in Vscode. Here’s a basic hello world program below:
#include <iostream>
using namespace std;
int main()
{
    cout << "Hello world!";
    return 0;
}
Save this file as test.cpp
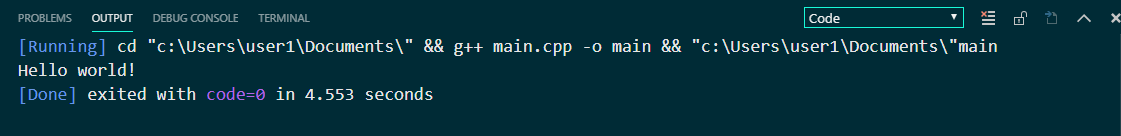
Run your code using Code Runner
- Use the shortcut
Ctrl+Alt+N - Or press F1 and then select/type Run Code
- Or right-click the Text Editor and then click Run Code in the editor context menu
The code will run and the output will be shown in the Output Window. Open the output window with `Ctrl+ shortcut.
To stop the running code
- Use the shortcut
Ctrl+Alt+M - Or press F1 and then select/type Stop Code Run
- Or right-click the Output Channel and then click Stop Code Run in the context menu
Hurray, you just successfully set up your C++ environment in VsCode!
Conclusion
Here’s a quick hint: By default, VsCode’s output terminal is read-only. If you’re running code that requires user input like:
#include <iostream>
using namespace std;

const double pi = 3.14159;

void calculate()
{
  double area;
  double radius;

  cout<<"Enter Radius: "<<endl;
  cin>>radius;

  area = pi * radius * radius;

  cout<<"area is: "<<area<<endl;
 }

int main()
{
  calculate();
  return 0;
}
you won’t be able to type into the terminal, Cannot edit in read-only terminal.
To fix this, you need to manually enable read-write.
- In VsCode, Go to File > Preference > Setting.
- In the User tab on the left panel, find the extensions section
- Scroll and find ‘Run Code Configuration’
- Scroll and find a checkbox
Run in Terminal(Whether to run code in Integrated Terminal) Check the box.
OR
- In your
setting.jsonfile, add:
"code-runner.runInTerminal": true
Hurray, you’re done and ready to roll :).
C++ resources
Here are some C++ resources you can use to get started with learning C++
- https://www.learncpp.com/
- https://www.codecademy.com/learn/learn-c-plus-plus
- https://www.udemy.com/free-learn-c-tutorial-beginners/
- https://www.sololearn.com/Course/CPlusPlus/
- https://www.youtube.com/watch?v=vLnPwxZdW4Y
- https://www.tutorialspoint.com/cplusplus/cpp_useful_resources.htm
- https://makeawebsitehub.com/learning-c/
Credits
- MinGW Project
- Code Runner by Jun Han
Thank you for reading!
Learn to code for free. freeCodeCamp’s open source curriculum has helped more than 40,000 people get jobs as developers. Get started