Windows by Zabbix agent active
Overview
New official Windows template. Requires agent of Zabbix 4.4 and newer.
This template has been tested on:
- Windows, version 7 and newer.
- Windows Server, version 2008 R2 and newer.
Requirements
For Zabbix version: 6.4 and higher.
Setup
Install Zabbix agent on Windows OS according to Zabbix documentation.
Configuration
No specific Zabbix configuration is required.
Macros used
| Name | Description | Default |
|---|---|---|
| {$AGENT.NODATA_TIMEOUT} |
No data timeout for active agents. Consider to keep it relatively high. |
30m |
| {$AGENT.TIMEOUT} |
Timeout after which agent is considered unavailable. |
5m |
| {$CPU.INTERRUPT.CRIT.MAX} |
The critical threshold of the % Interrupt Time counter. |
50 |
| {$CPU.PRIV.CRIT.MAX} |
The threshold of the % Privileged Time counter. |
30 |
| {$CPU.QUEUE.CRIT.MAX} |
The threshold of the Processor Queue Length counter. |
3 |
| {$CPU.UTIL.CRIT} |
The critical threshold of the CPU utilization in %. |
90 |
| {$IF.ERRORS.WARN} |
— |
2 |
| {$IF.UTIL.MAX} |
— |
90 |
| {$IFCONTROL} |
— |
1 |
| {$MEM.PAGE_SEC.CRIT.MAX} |
The warning threshold of the Memory Pages/sec counter. |
1000 |
| {$MEM.PAGE_TABLE_CRIT.MIN} |
The warning threshold of the Free System Page Table Entries counter. |
5000 |
| {$MEMORY.UTIL.MAX} |
The warning threshold of the Memory util item. |
90 |
| {$NET.IF.IFALIAS.MATCHES} |
This macro is used in Network interface discovery. Can be overridden on the host or linked template level. |
.* |
| {$NET.IF.IFALIAS.NOT_MATCHES} |
This macro is used in Network interface discovery. Can be overridden on the host or linked template level. |
CHANGE_THIS |
| {$NET.IF.IFDESCR.MATCHES} |
This macro is used in Network interface discovery. Can be overridden on the host or linked template level. |
.* |
| {$NET.IF.IFDESCR.NOT_MATCHES} |
This macro is used in Network interface discovery. Can be overridden on the host or linked template level. |
CHANGE_THIS |
| {$NET.IF.IFNAME.MATCHES} |
This macro is used in Network interface discovery. Can be overridden on the host or linked template level. |
.* |
| {$NET.IF.IFNAME.NOT_MATCHES} |
This macro is used in Network interface discovery. Can be overridden on the host or linked template level. |
`Miniport |
| {$SERVICE.NAME.MATCHES} |
This macro is used in Service discovery. Can be overridden on the host or linked template level. |
^.*$ |
| {$SERVICE.NAME.NOT_MATCHES} |
This macro is used in Service discovery. Can be overridden on the host or linked template level. |
`^(?:RemoteRegistry |
| {$SERVICE.STARTUPNAME.MATCHES} |
This macro is used in Service discovery. Can be overridden on the host or linked template level. |
`^(?:automatic |
| {$SERVICE.STARTUPNAME.NOT_MATCHES} |
This macro is used in Service discovery. Can be overridden on the host or linked template level. |
`^(?:manual |
| {$SWAP.PFREE.MIN.WARN} |
The warning threshold of the minimum free swap. |
20 |
| {$SYSTEM.FUZZYTIME.MAX} |
The threshold for difference of system time in seconds. |
60 |
| {$VFS.DEV.DEVNAME.MATCHES} |
This macro is used in physical disks discovery. Can be overridden on the host or linked template level. |
.* |
| {$VFS.DEV.DEVNAME.NOT_MATCHES} |
This macro is used in physical disks discovery. Can be overridden on the host or linked template level. |
_Total |
| {$VFS.DEV.READ.AWAIT.WARN} |
Disk read average response time (in s) before the trigger would fire. |
0.02 |
| {$VFS.DEV.UTIL.MAX.WARN} |
The warning threshold of disk time utilization in percent. |
95 |
| {$VFS.DEV.WRITE.AWAIT.WARN} |
Disk write average response time (in s) before the trigger would fire. |
0.02 |
| {$VFS.FS.FREE.MIN.CRIT} |
The critical threshold of the filesystem utilization. |
5G |
| {$VFS.FS.FREE.MIN.WARN} |
The warning threshold of the filesystem utilization. |
10G |
| {$VFS.FS.FSDRIVETYPE.MATCHES} |
This macro is used in filesystems discovery. Can be overridden on the host or linked template level. |
fixed |
| {$VFS.FS.FSDRIVETYPE.NOT_MATCHES} |
This macro is used in filesystems discovery. Can be overridden on the host or linked template level. |
^s$ |
| {$VFS.FS.FSNAME.MATCHES} |
This macro is used in filesystems discovery. Can be overridden on the host or linked template level. |
.* |
| {$VFS.FS.FSNAME.NOT_MATCHES} |
This macro is used in filesystems discovery. Can be overridden on the host or linked template level. |
`^(?:/dev |
| {$VFS.FS.FSTYPE.MATCHES} |
This macro is used in filesystems discovery. Can be overridden on the host or linked template level. |
.* |
| {$VFS.FS.FSTYPE.NOT_MATCHES} |
This macro is used in filesystems discovery. Can be overridden on the host or linked template level. |
^s$ |
| {$VFS.FS.PUSED.MAX.CRIT} |
The critical threshold of the filesystem utilization in percent. |
90 |
| {$VFS.FS.PUSED.MAX.WARN} |
The warning threshold of the filesystem utilization in percent. |
80 |
Template links
There are no template links in this template.
Discovery rules
| Name | Description | Type | Key and additional info |
|---|---|---|---|
| Mounted filesystem discovery |
Discovery of file systems of different types. |
DEPENDENT | vfs.fs.dependent.discovery
Filter: AND — {#FSTYPE} MATCHES_REGEX — {#FSTYPE} NOT_MATCHES_REGEX — {#FSNAME} MATCHES_REGEX — {#FSNAME} NOT_MATCHES_REGEX — {#FSDRIVETYPE} MATCHES_REGEX — {#FSDRIVETYPE} NOT_MATCHES_REGEX |
| Network interfaces discovery |
Discovery of installed network interfaces. |
DEPENDENT | net.if.discovery
Preprocessing: — JAVASCRIPT: — DISCARD_UNCHANGED_HEARTBEAT: Filter: AND — {#IFNAME} MATCHES_REGEX — {#IFNAME} NOT_MATCHES_REGEX — {#IFDESCR} MATCHES_REGEX — {#IFDESCR} NOT_MATCHES_REGEX — {#IFALIAS} MATCHES_REGEX — {#IFALIAS} NOT_MATCHES_REGEX |
| Physical disks discovery |
Discovery of installed physical disks. |
ZABBIX_ACTIVE | perf_instance_en.discovery[PhysicalDisk]
Preprocessing: — STR_REPLACE: Filter: AND — {#DEVNAME} MATCHES_REGEX — {#DEVNAME} NOT_MATCHES_REGEX |
| Windows services discovery |
Discovery of Windows services of different types as defined in template’s macros. |
ZABBIX_ACTIVE | service.discovery
Filter: AND — {#SERVICE.NAME} MATCHES_REGEX — {#SERVICE.NAME} NOT_MATCHES_REGEX — {#SERVICE.STARTUPNAME} MATCHES_REGEX — {#SERVICE.STARTUPNAME} NOT_MATCHES_REGEX |
Items collected
| Group | Name | Description | Type | Key and additional info |
|---|---|---|---|---|
| CPU | CPU utilization |
The CPU utilization expressed in %. |
ZABBIX_ACTIVE | system.cpu.util |
| CPU | CPU interrupt time |
The Processor Information% Interrupt Time is the time the processor spends receiving and servicing hardware interrupts during sample intervals. This value is an indirect indicator of the activity of devices that generate interrupts, such as the system clock, the mouse, disk drivers, data communication lines, network interface cards and other peripheral devices. This is an easy way to identify a potential hardware failure. This should never be higher than 20%. |
ZABBIX_ACTIVE | perf_counter_en[«Processor Information(_total)% Interrupt Time»] |
| CPU | Context switches per second |
Context Switches/sec is the combined rate at which all processors on the computer are switched from one thread to another. Context switches occur when a running thread voluntarily relinquishes the processor, is preempted by a higher priority ready thread, or switches between user-mode and privileged (kernel) mode to use an Executive or subsystem service. It is the sum of ThreadContext Switches/sec for all threads running on all processors in the computer and is measured in numbers of switches. There are context switch counters on the System and Thread objects. This counter displays the difference between the values observed in the last two samples, divided by the duration of the sample interval. |
ZABBIX_ACTIVE | perf_counter_en[«SystemContext Switches/sec»] |
| CPU | CPU privileged time |
The Processor Information% Privileged Time counter shows the percent of time that the processor is spent executing in Kernel (or Privileged) mode. Privileged mode includes services interrupts inside Interrupt Service Routines (ISRs), executing Deferred Procedure Calls (DPCs), Device Driver calls and other kernel-mode functions of the Windows® Operating System. |
ZABBIX_ACTIVE | perf_counter_en[«Processor Information(_total)% Privileged Time»] |
| CPU | CPU DPC time |
Processor DPC time is the time that a single processor spent receiving and servicing deferred procedure calls (DPCs). DPCs are interrupts that run at a lower priority than standard interrupts. % DPC Time is a component of % Privileged Time because DPCs are executed in privileged mode. If a high % DPC Time is sustained, there may be a processor bottleneck or an application or hardware related issue that can significantly diminish overall system performance. |
ZABBIX_ACTIVE | perf_counter_en[«Processor Information(_total)% DPC Time»] |
| CPU | CPU user time |
The Processor Information% User Time counter shows the percent of time that the processor(s) is spent executing in User mode. |
ZABBIX_ACTIVE | perf_counter_en[«Processor Information(_total)% User Time»] |
| CPU | Number of cores |
The number of logical processors available on the computer. |
ZABBIX_ACTIVE | wmi.get[root/cimv2,»Select NumberOfLogicalProcessors from Win32_ComputerSystem»] |
| CPU | CPU queue length |
The Processor Queue Length shows the number of threads that are observed as delayed in the processor Ready Queue and are waiting to be executed. |
ZABBIX_ACTIVE | perf_counter_en[«SystemProcessor Queue Length»] |
| Filesystems | {#FSLABEL}({#FSNAME}): Used space |
Used storage expressed in Bytes. |
DEPENDENT | vfs.fs.dependent.size[{#FSNAME},used]
Preprocessing: — JSONPATH: |
| Filesystems | {#FSLABEL}({#FSNAME}): Total space |
The total space expressed in Bytes. |
DEPENDENT | vfs.fs.dependent.size[{#FSNAME},total]
Preprocessing: — JSONPATH: |
| Filesystems | {#FSLABEL}({#FSNAME}): Space utilization |
Space utilization in % for {#FSNAME} |
DEPENDENT | vfs.fs.dependent.size[{#FSNAME},pused]
Preprocessing: — JSONPATH: |
| General | System local time |
The local system time of the host. |
ZABBIX_ACTIVE | system.localtime |
| General | System name |
The host name of the system. |
ZABBIX_ACTIVE | system.hostname
Preprocessing: — DISCARD_UNCHANGED_HEARTBEAT: |
| General | System description |
System description of the host. |
ZABBIX_ACTIVE | system.uname
Preprocessing: — DISCARD_UNCHANGED_HEARTBEAT: |
| General | Number of processes |
The number of processes. |
ZABBIX_ACTIVE | proc.num[] |
| General | Number of threads |
The number of threads used by all running processes. |
ZABBIX_ACTIVE | perf_counter_en[«SystemThreads»] |
| Inventory | Operating system |
— |
ZABBIX_ACTIVE | system.sw.os
Preprocessing: — DISCARD_UNCHANGED_HEARTBEAT: |
| Inventory | Operating system architecture |
The architecture of the operating system. |
ZABBIX_ACTIVE | system.sw.arch
Preprocessing: — DISCARD_UNCHANGED_HEARTBEAT: |
| Memory | Used memory |
Used memory in Bytes. |
ZABBIX_ACTIVE | vm.memory.size[used] |
| Memory | Total memory |
The total memory expressed in Bytes. |
ZABBIX_ACTIVE | vm.memory.size[total] |
| Memory | Memory utilization |
Memory utilization in %. |
CALCULATED | vm.memory.util
Expression:
|
| Memory | Cache bytes |
Cache Bytes is the sum of the MemorySystem Cache Resident Bytes, MemorySystem Driver Resident Bytes, MemorySystem Code Resident Bytes, and MemoryPool Paged Resident Bytes counters. This counter displays the last observed value only; it is not an average. |
ZABBIX_ACTIVE | perf_counter_en[«MemoryCache Bytes»] |
| Memory | Free swap space |
The free space of the swap volume/file expressed in bytes. |
CALCULATED | system.swap.free
Expression:
|
| Memory | Free swap space in % |
The free space of the swap volume/file expressed in %. |
DEPENDENT | system.swap.pfree
Preprocessing: — JAVASCRIPT: |
| Memory | Used swap space in % |
The used space of swap volume/file in percent. |
ZABBIX_ACTIVE | perf_counter_en[«Paging file(_Total)% Usage»] |
| Memory | Total swap space |
The total space of the swap volume/file expressed in bytes. |
ZABBIX_ACTIVE | system.swap.size[,total] |
| Memory | Free system page table entries |
This indicates the number of page table entries not currently in use by the system. If the number is less than 5,000, there may well be a memory leak or you running out of memory. |
ZABBIX_ACTIVE | perf_counter_en[«MemoryFree System Page Table Entries»] |
| Memory | Memory page faults per second |
Page Faults/sec is the average number of pages faulted per second. It is measured in number of pages faulted per second because only one page is faulted in each fault operation, hence this is also equal to the number of page fault operations. This counter includes both hard faults (those that require disk access) and soft faults (where the faulted page is found elsewhere in physical memory.) Most processors can handle large numbers of soft faults without significant consequence. However, hard faults, which require disk access, can cause significant delays. |
ZABBIX_ACTIVE | perf_counter_en[«MemoryPage Faults/sec»] |
| Memory | Memory pages per second |
This measures the rate at which pages are read from or written to disk to resolve hard page faults. If the value is greater than 1,000, as a result of excessive paging, there may be a memory leak. |
ZABBIX_ACTIVE | perf_counter_en[«MemoryPages/sec»] |
| Memory | Memory pool non-paged |
This measures the size, in bytes, of the non-paged pool. This is an area of system memory for objects that cannot be written to disk but instead must remain in physical memory as long as they are allocated. There is a possible memory leak if the value is greater than 175MB (or 100MB with the /3GB switch). A typical Event ID 2019 is recorded in the system event log. |
ZABBIX_ACTIVE | perf_counter_en[«MemoryPool Nonpaged Bytes»] |
| Monitoring agent | Version of Zabbix agent running |
— |
ZABBIX_ACTIVE | agent.version
Preprocessing: — DISCARD_UNCHANGED_HEARTBEAT: |
| Monitoring agent | Host name of Zabbix agent running |
— |
ZABBIX_ACTIVE | agent.hostname
Preprocessing: — DISCARD_UNCHANGED_HEARTBEAT: |
| Monitoring agent | Active agent availability |
Availability of active checks on the host. The value of this item corresponds to availability icons in the host list. Possible value: 0 — unknown 1 — available 2 — not available |
INTERNAL | zabbix[host,active_agent,available] |
| Network interfaces | Interface {#IFNAME}({#IFALIAS}): Bits received |
Incoming traffic on the network interface. |
ZABBIX_ACTIVE | net.if.in[«{#IFGUID}»]
Preprocessing: — CHANGE_PER_SECOND — MULTIPLIER: |
| Network interfaces | Interface {#IFNAME}({#IFALIAS}): Bits sent |
Outgoing traffic on the network interface. |
ZABBIX_ACTIVE | net.if.out[«{#IFGUID}»]
Preprocessing: — CHANGE_PER_SECOND — MULTIPLIER: |
| Network interfaces | Interface {#IFNAME}({#IFALIAS}): Inbound packets discarded |
The number of incoming packets dropped on the network interface. |
ZABBIX_ACTIVE | net.if.in[«{#IFGUID}»,dropped]
Preprocessing: — CHANGE_PER_SECOND |
| Network interfaces | Interface {#IFNAME}({#IFALIAS}): Outbound packets discarded |
The number of outgoing packets dropped on the network interface. |
ZABBIX_ACTIVE | net.if.out[«{#IFGUID}»,dropped]
Preprocessing: — CHANGE_PER_SECOND |
| Network interfaces | Interface {#IFNAME}({#IFALIAS}): Inbound packets with errors |
The number of incoming packets with errors on the network interface. |
ZABBIX_ACTIVE | net.if.in[«{#IFGUID}»,errors]
Preprocessing: — CHANGE_PER_SECOND |
| Network interfaces | Interface {#IFNAME}({#IFALIAS}): Outbound packets with errors |
The number of outgoing packets with errors on the network interface. |
ZABBIX_ACTIVE | net.if.out[«{#IFGUID}»,errors]
Preprocessing: — CHANGE_PER_SECOND |
| Network interfaces | Interface {#IFNAME}({#IFALIAS}): Speed |
Estimated bandwidth of the network interface if any. |
DEPENDENT | net.if.speed[«{#IFGUID}»]
Preprocessing: — JSONPATH: ⛔️ON_FAIL: — JAVASCRIPT: — DISCARD_UNCHANGED_HEARTBEAT: |
| Network interfaces | Interface {#IFNAME}({#IFALIAS}): Interface type |
The type of the network interface. |
DEPENDENT | net.if.type[«{#IFGUID}»]
Preprocessing: — JSONPATH: — DISCARD_UNCHANGED_HEARTBEAT: |
| Network interfaces | Interface {#IFNAME}({#IFALIAS}): Operational status |
The operational status of the network interface. |
DEPENDENT | net.if.status[«{#IFGUID}»]
Preprocessing: — JSONPATH: — DISCARD_UNCHANGED_HEARTBEAT: |
| Services | State of service «{#SERVICE.NAME}» ({#SERVICE.DISPLAYNAME}) |
— |
ZABBIX_ACTIVE | service.info[«{#SERVICE.NAME}»,state] |
| Status | Uptime |
The system uptime expressed in the following format:»N days, hh:mm:ss». |
ZABBIX_ACTIVE | system.uptime |
| Status | Zabbix agent ping |
The agent always returns 1 for this item. It could be used in combination with nodata() for availability check. |
ZABBIX_ACTIVE | agent.ping |
| Storage | {#DEVNAME}: Disk read rate |
Rate of read operations on the disk. |
ZABBIX_ACTIVE | perf_counter_en[«PhysicalDisk({#DEVNAME})Disk Reads/sec»,60] |
| Storage | {#DEVNAME}: Disk write rate |
Rate of write operations on the disk. |
ZABBIX_ACTIVE | perf_counter_en[«PhysicalDisk({#DEVNAME})Disk Writes/sec»,60] |
| Storage | {#DEVNAME}: Disk average queue size (avgqu-sz) |
The current average disk queue; the number of requests outstanding on the disk while the performance data is being collected. |
ZABBIX_ACTIVE | perf_counter_en[«PhysicalDisk({#DEVNAME})Current Disk Queue Length»,60] |
| Storage | {#DEVNAME}: Disk utilization by idle time |
This item is the percentage of elapsed time that the selected disk drive was busy servicing read or writes requests based on idle time. |
ZABBIX_ACTIVE | perf_counter_en[«PhysicalDisk({#DEVNAME})% Idle Time»,60]
Preprocessing: — JAVASCRIPT: |
| Storage | {#DEVNAME}: Disk read request avg waiting time |
The average time for read requests issued to the device to be served. This includes the time spent by the requests in queue and the time spent servicing them. |
ZABBIX_ACTIVE | perf_counter_en[«PhysicalDisk({#DEVNAME})Avg. Disk sec/Read»,60] |
| Storage | {#DEVNAME}: Disk write request avg waiting time |
The average time for write requests issued to the device to be served. This includes the time spent by the requests in queue and the time spent servicing them. |
ZABBIX_ACTIVE | perf_counter_en[«PhysicalDisk({#DEVNAME})Avg. Disk sec/Write»,60] |
| Storage | {#DEVNAME}: Average disk read queue length |
Average disk read queue, the number of requests outstanding on the disk at the time the performance data is collected. |
ZABBIX_ACTIVE | perf_counter_en[«PhysicalDisk({#DEVNAME})Avg. Disk Read Queue Length»,60] |
| Storage | {#DEVNAME}: Average disk write queue length |
Average disk write queue, the number of requests outstanding on the disk at the time the performance data is collected. |
ZABBIX_ACTIVE | perf_counter_en[«PhysicalDisk({#DEVNAME})Avg. Disk Write Queue Length»,60] |
| Zabbix raw items | Get filesystems |
The |
ZABBIX_ACTIVE | vfs.fs.get |
| Zabbix raw items | Network interfaces WMI get |
Raw data of win32_networkadapter. |
ZABBIX_ACTIVE | wmi.getall[rootcimv2,»select Name,Description,NetConnectionID,Speed,AdapterTypeId,NetConnectionStatus,GUID from win32_networkadapter where PhysicalAdapter=True and NetConnectionStatus>0″]
Preprocessing: — DISCARD_UNCHANGED_HEARTBEAT: |
| Zabbix raw items | {#FSLABEL}({#FSNAME}): Get filesystem data |
— |
DEPENDENT | vfs.fs.dependent[{#FSNAME},data]
Preprocessing: — JSONPATH: |
Triggers
| Name | Description | Expression | Severity | Dependencies and additional info |
|---|---|---|---|---|
| High CPU utilization |
The CPU utilization is too high. The system might be slow to respond. |
min(/Windows by Zabbix agent active/system.cpu.util,5m)>{$CPU.UTIL.CRIT} |
WARNING | |
| CPU interrupt time is too high |
«The CPU Interrupt Time in the last 5 minutes exceeds {$CPU.INTERRUPT.CRIT.MAX}%.» The Processor Information% Interrupt Time is the time the processor spends receiving and servicing hardware interrupts during sample intervals. This value is an indirect indicator of the activity of devices that generate interrupts, such as the system clock, the mouse, disk drivers, data communication lines, network interface cards and other peripheral devices. This is an easy way to identify a potential hardware failure. This should never be higher than 20%. |
min(/Windows by Zabbix agent active/perf_counter_en["Processor Information(_total)% Interrupt Time"],5m)>{$CPU.INTERRUPT.CRIT.MAX} |
WARNING |
Depends on: — High CPU utilization |
| CPU privileged time is too high |
The CPU privileged time in the last 5 minutes exceeds {$CPU.PRIV.CRIT.MAX}%. |
min(/Windows by Zabbix agent active/perf_counter_en["Processor Information(_total)% Privileged Time"],5m)>{$CPU.PRIV.CRIT.MAX} |
WARNING |
Depends on: — CPU interrupt time is too high — High CPU utilization |
| CPU queue length is too high |
The CPU Queue Length in the last 5 minutes exceeds {$CPU.QUEUE.CRIT.MAX}. According to actual observations, PQL should not exceed the number of cores * 2. To fine-tune the conditions, use the macro {$CPU.QUEUE.CRIT.MAX }. |
min(/Windows by Zabbix agent active/perf_counter_en["SystemProcessor Queue Length"],5m) - last(/Windows by Zabbix agent active/wmi.get[root/cimv2,"Select NumberOfLogicalProcessors from Win32_ComputerSystem"]) * 2 > {$CPU.QUEUE.CRIT.MAX} |
WARNING |
Depends on: — High CPU utilization |
| {#FSLABEL}({#FSNAME}): Disk space is critically low |
Two conditions should match: First, space utilization should be above {$VFS.FS.PUSED.MAX.CRIT:»{#FSNAME}»}. Second condition should be one of the following: — The disk free space is less than {$VFS.FS.FREE.MIN.CRIT:»{#FSNAME}»}. — The disk will be full in less than 24 hours. |
last(/Windows by Zabbix agent active/vfs.fs.dependent.size[{#FSNAME},pused])>{$VFS.FS.PUSED.MAX.CRIT:"{#FSNAME}"} and ((last(/Windows by Zabbix agent active/vfs.fs.dependent.size[{#FSNAME},total])-last(/Windows by Zabbix agent active/vfs.fs.dependent.size[{#FSNAME},used]))<{$VFS.FS.FREE.MIN.CRIT:"{#FSNAME}"} or timeleft(/Windows by Zabbix agent active/vfs.fs.dependent.size[{#FSNAME},pused],1h,100)<1d) |
AVERAGE |
Manual close: YES |
| {#FSLABEL}({#FSNAME}): Disk space is low |
Two conditions should match: First, space utilization should be above {$VFS.FS.PUSED.MAX.WARN:»{#FSNAME}»}. Second condition should be one of the following: — The disk free space is less than {$VFS.FS.FREE.MIN.WARN:»{#FSNAME}»}. — The disk will be full in less than 24 hours. |
last(/Windows by Zabbix agent active/vfs.fs.dependent.size[{#FSNAME},pused])>{$VFS.FS.PUSED.MAX.WARN:"{#FSNAME}"} and ((last(/Windows by Zabbix agent active/vfs.fs.dependent.size[{#FSNAME},total])-last(/Windows by Zabbix agent active/vfs.fs.dependent.size[{#FSNAME},used]))<{$VFS.FS.FREE.MIN.WARN:"{#FSNAME}"} or timeleft(/Windows by Zabbix agent active/vfs.fs.dependent.size[{#FSNAME},pused],1h,100)<1d) |
WARNING |
Manual close: YES Depends on: — {#FSLABEL}({#FSNAME}): Disk space is critically low |
| System time is out of sync |
The host system time is different from the Zabbix server time. |
fuzzytime(/Windows by Zabbix agent active/system.localtime,{$SYSTEM.FUZZYTIME.MAX})=0 |
WARNING |
Manual close: YES |
| System name has changed |
System name has changed. Ack to close. |
change(/Windows by Zabbix agent active/system.hostname) and length(last(/Windows by Zabbix agent active/system.hostname))>0 |
INFO |
Manual close: YES |
| Operating system description has changed |
The description of the operating system has changed. Possible reasons are that the system has been updated or replaced. Ack to close the problem manually. |
change(/Windows by Zabbix agent active/system.sw.os) and length(last(/Windows by Zabbix agent active/system.sw.os))>0 |
INFO |
Manual close: YES Depends on: — System name has changed |
| High memory utilization |
The system is running out of free memory. |
min(/Windows by Zabbix agent active/vm.memory.util,5m)>{$MEMORY.UTIL.MAX} |
AVERAGE | |
| High swap space usage |
This trigger is ignored, if there is no swap configured |
max(/Windows by Zabbix agent active/system.swap.pfree,5m)<{$SWAP.PFREE.MIN.WARN} and last(/Windows by Zabbix agent active/system.swap.size[,total])>0 |
WARNING |
Depends on: — High memory utilization |
| Number of free system page table entries is too low |
The Memory Free System Page Table Entries is less than {$MEM.PAGE_TABLE_CRIT.MIN} for 5 minutes. If the number is less than 5,000, there may well be a memory leak. |
max(/Windows by Zabbix agent active/perf_counter_en["MemoryFree System Page Table Entries"],5m)<{$MEM.PAGE_TABLE_CRIT.MIN} |
WARNING |
Depends on: — High memory utilization |
| The Memory Pages/sec is too high |
The Memory Pages/sec in the last 5 minutes exceeds {$MEM.PAGE_SEC.CRIT.MAX}. If the value is greater than 1,000, as a result of excessive paging, there may be a memory leak. |
min(/Windows by Zabbix agent active/perf_counter_en["MemoryPages/sec"],5m)>{$MEM.PAGE_SEC.CRIT.MAX} |
WARNING |
Depends on: — High memory utilization |
| Zabbix agent: active checks are not available |
Active checks are considered unavailable. Agent is not sending heartbeat for prolonged time. |
min(/Windows by Zabbix agent active/zabbix[host,active_agent,available],{$AGENT.TIMEOUT})=2 |
HIGH | |
| Interface {#IFNAME}({#IFALIAS}): High bandwidth usage |
The network interface utilization is close to its estimated maximum bandwidth. |
(avg(/Windows by Zabbix agent active/net.if.in["{#IFGUID}"],15m)>({$IF.UTIL.MAX:"{#IFNAME}"}/100)*last(/Windows by Zabbix agent active/net.if.speed["{#IFGUID}"]) or avg(/Windows by Zabbix agent active/net.if.out["{#IFGUID}"],15m)>({$IF.UTIL.MAX:"{#IFNAME}"}/100)*last(/Windows by Zabbix agent active/net.if.speed["{#IFGUID}"])) and last(/Windows by Zabbix agent active/net.if.speed["{#IFGUID}"])>0
Recovery expression:
|
WARNING |
Manual close: YES Depends on: — Interface {#IFNAME}({#IFALIAS}): Link down |
| Interface {#IFNAME}({#IFALIAS}): High error rate |
Recovers when below 80% of {$IF.ERRORS.WARN:»{#IFNAME}»} threshold |
min(/Windows by Zabbix agent active/net.if.in["{#IFGUID}",errors],5m)>{$IF.ERRORS.WARN:"{#IFNAME}"} or min(/Windows by Zabbix agent active/net.if.out["{#IFGUID}",errors],5m)>{$IF.ERRORS.WARN:"{#IFNAME}"}
Recovery expression:
|
WARNING |
Manual close: YES Depends on: — Interface {#IFNAME}({#IFALIAS}): Link down |
| Interface {#IFNAME}({#IFALIAS}): Ethernet has changed to lower speed than it was before |
This Ethernet connection has transitioned down from its known maximum speed. This might be a sign of autonegotiation issues. Ack to close. |
change(/Windows by Zabbix agent active/net.if.speed["{#IFGUID}"])<0 and last(/Windows by Zabbix agent active/net.if.speed["{#IFGUID}"])>0 and last(/Windows by Zabbix agent active/net.if.status["{#IFGUID}"])=2 |
INFO |
Manual close: YES Depends on: — Interface {#IFNAME}({#IFALIAS}): Link down |
| Interface {#IFNAME}({#IFALIAS}): Link down |
This trigger expression works as follows: 1. Can be triggered if operations status is down. 2. {$IFCONTROL:»{#IFNAME}»}=1 — user can redefine Context macro to value — 0. That marks this interface as not important. No new trigger will be fired if this interface is down. 3. {TEMPLATE_NAME:METRIC.diff()}=1) — trigger fires only if operational status is different from Connected(2). WARNING: if closed manually — won’t fire again on next poll, because of .diff. |
{$IFCONTROL:"{#IFNAME}"}=1 and last(/Windows by Zabbix agent active/net.if.status["{#IFGUID}"])<>2 and (last(/Windows by Zabbix agent active/net.if.status["{#IFGUID}"],#1)<>last(/Windows by Zabbix agent active/net.if.status["{#IFGUID}"],#2))
Recovery expression:
|
AVERAGE |
Manual close: YES |
| «{#SERVICE.NAME}» ({#SERVICE.DISPLAYNAME}) is not running |
The service has a state other than «Running» for the last three times. |
min(/Windows by Zabbix agent active/service.info["{#SERVICE.NAME}",state],#3)<>0 |
AVERAGE | |
| Host has been restarted |
The device uptime is less than 10 minutes. |
last(/Windows by Zabbix agent active/system.uptime)<10m |
WARNING |
Manual close: YES |
| Zabbix agent is not available |
For active agents, nodata() with agent.ping is used with {$AGENT.NODATA_TIMEOUT} as time threshold. |
nodata(/Windows by Zabbix agent active/agent.ping,{$AGENT.NODATA_TIMEOUT})=1 |
AVERAGE |
Manual close: YES |
| {#DEVNAME}: Disk is overloaded |
The disk appears to be under heavy load |
min(/Windows by Zabbix agent active/perf_counter_en["PhysicalDisk({#DEVNAME})% Idle Time",60],15m)>{$VFS.DEV.UTIL.MAX.WARN} |
WARNING |
Manual close: YES Depends on: — {#DEVNAME}: Disk read request responses are too high — {#DEVNAME}: Disk write request responses are too high |
| {#DEVNAME}: Disk read request responses are too high |
This trigger might indicate disk {#DEVNAME} saturation. |
min(/Windows by Zabbix agent active/perf_counter_en["PhysicalDisk({#DEVNAME})Avg. Disk sec/Read",60],15m) > {$VFS.DEV.READ.AWAIT.WARN:"{#DEVNAME}"} |
WARNING |
Manual close: YES |
| {#DEVNAME}: Disk write request responses are too high |
This trigger might indicate disk {#DEVNAME} saturation. |
min(/Windows by Zabbix agent active/perf_counter_en["PhysicalDisk({#DEVNAME})Avg. Disk sec/Write",60],15m) > {$VFS.DEV.WRITE.AWAIT.WARN:"{#DEVNAME}"} |
WARNING |
Manual close: YES |
Feedback
Please report any issues with the template at https://support.zabbix.com.
You can also provide feedback, discuss the template, or ask for help at ZABBIX forums.
Содержание
- Мониторим ядра CPU в Zabbix и создаем произвольные счетчики в Low-level discovery
- Name already in use
- zabbix / templates / os / windows_agent_active / README.md
Мониторим ядра CPU в Zabbix и создаем произвольные счетчики в Low-level discovery
Не так давно тут проходила статья про LLD. Мне она показалась скучной т.к. описывает примерно то же, что есть и в документации. Я решил пойти дальше и с помощью LLD мониторить те параметры, которые раньше нельзя было мониторить автоматически, либо это было достаточно сложно. Разберем работу LLD на примере логических процессоров в Windows: 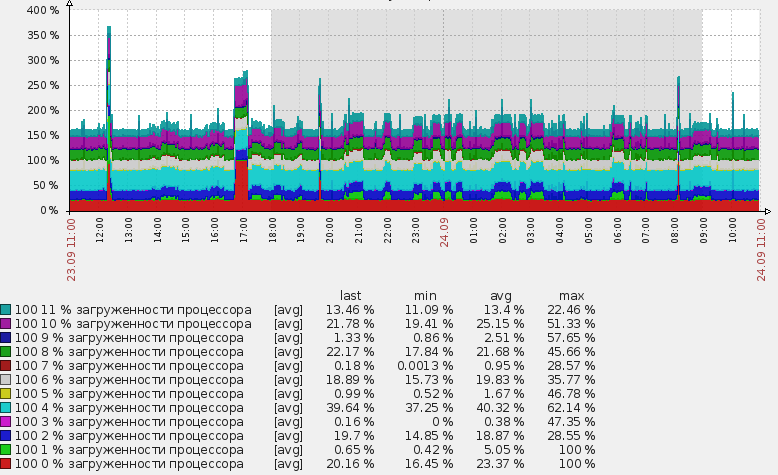
Изначально интересовал расширенный монтиринг помимо ядрер CPU и нагрузка на физические диски. До того как обнаружение было введено, эти задачи частично решались ручным добавлением. Я добавлял условные диски в файл конфигурации zabbix_agent и вообще по-разному извращался. В результате это было очень неудобно, добавлялось много неприятной ручной работы и вообще неправильно в общем как-то было 🙂
В итоге получается схема, которая автоматически определяет ядра в системе, а также физические диски, установленные в системе и добавляет необходимые элементы сбора данных. Для того, чтобы узнать как это реализовать у себя, добро пожаловать под кат. Я попытаюсь более-менее подробно расписать работу на примере CPU и то как сделать тоже самое, но для физических дисков.
Тип отправляемых данных
Для начала стоит отослать к документации, где расписывается что такое LLD и с чем его едят. Помимо стандартных шаблонов нас будет интересовать 4-ый раздел с описание JSON формата обнаружения. То есть мы будем создавать свой собственный метод обнаружения. По сути все сводится к вызову скрипта, который формирует в нужном формате нужные данные.
Создаем скрипт.
Для скрипта я выбрал powershell. Его я знаю немного лучше других скриптовых языков, да и учитывая, что все будет крутиться во круг WMI, сделать его можно было бы и на VBS.
Итак, скрипт.
Задача скрипта состоит в том, чтобы определить число логических процессоров с помощью WMI и вывести в консоль эти данные в формате JSON. Передавать мы будем переменную с именем , а также ее значения. Формат вывода будет примерно таким, в зависимости от количества логических процессоров:
Скрипт формирования данных
Сам скрипт выглядит так:
Сейчас мы получаем, что при запуске скрипта он узнает сколько ядер и формирует пакет для отправки.
Что же мы делаем дальше? Нужно создать Discovery rule.
Добавялем низкоуровневое обнаружение в настройках zabbix сервера
Для этого заходим в нужный шаблон, который добавлен к интересующим нас хостам, в раздел Discovery и нажимаем кнопку Create discovery rule. 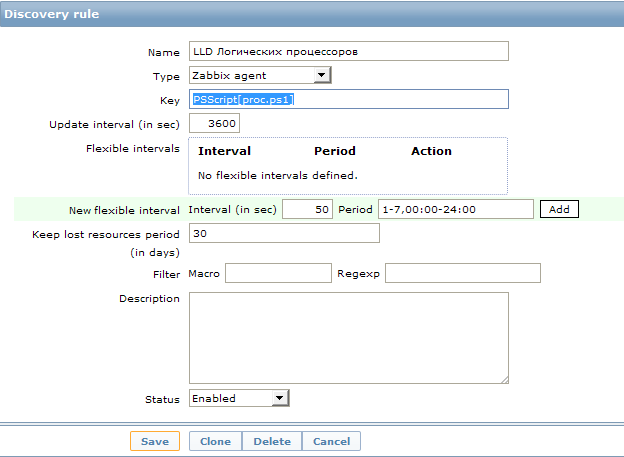
Тут мы видим непонятное значение поля key: PSScript[proc.ps1]. Это UserParameter. Этот пункт создан для удобства, теперь в каждом новом объекте мы можем просто вписывать параметр в виде имени PS скрипта и он будет искать его в заранее оговоренном месте. Сам параметр прописывается в файле конфигурации клиента (обычно называется zabbix_agentd.conf) и выглядит так:
Мы создали новое правило обнаружения с пользовательским сбором данных. Запрос на изменение информации задан как 1 час. Пожалуй, для таких статических данных, как количество процессоров, это слишком часто :), но каждый волен поставить свое значение. Для первоначального сбора данных и отладки лучше это значение уменьшить до совсем небольших значений, чтобы не ждать часами выполнение скрипта.
Настройка прототипов данных
Хорошо. Данные о количестве процессоров мы начали собирать. Но в результате нам нужны не эти данные, а новый item в мониторинге. Именно item может собирать данные, а не наш скрипт, наш скрипт служит только для обнаружения самих элементов для сбора данных.
А для того что бы создать новый элемент сбора данных, полученный на основании LLD, в том же разделе Discovery мы создаем новый прототип. Для этого заходим в item prototypes и нажимаем create item prototype. Я создал вот такой элемент сбора: 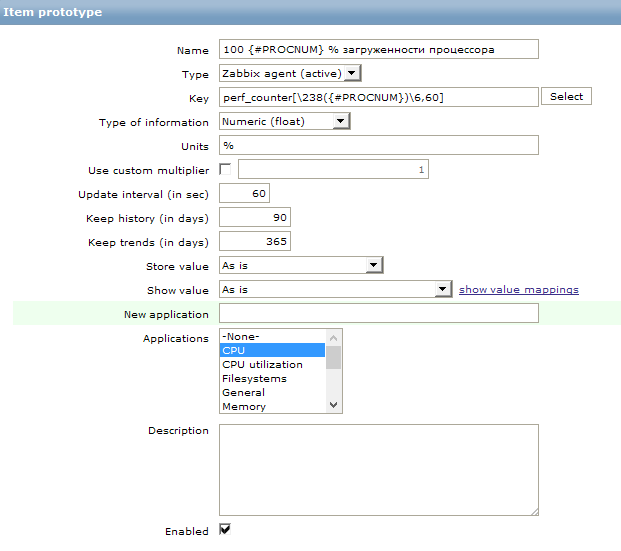
Для сбора данных используется стандартный счетчик производительности. В zabbix для сбора этих данных есть ключ perf_counter. Вместо номера логического ядра мы вставляем полученное значение в виде переменной из раздела Discovery.
Теперь все готово. Или почти все…
С этого момента, когда скрипт discovery обнаружит логические процессоры, для этого хоста будут созданы элементы сбора данных созданных точно для этого количества процессоров.
И теперь если мы зайдем в items для хоста, низкоуровневое обнаружение для которого уже отработало, то мы увидим, что появились новые элементы: 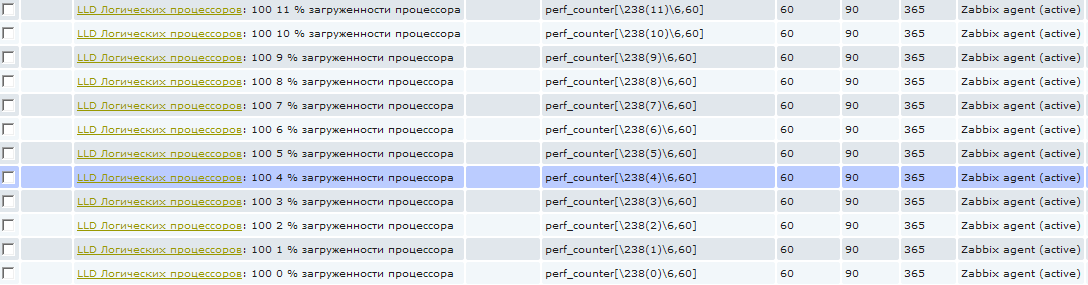
Эти элементы нельзя удалить стандартным способом, т.к. они созданы автоматически, они выделены особенным префиксом с названием правила низкоуровневого обнаружения. На скриншоте кажется, что написана какая-то фигня в имени :), на самом деле все просто, я использую трехзначный код в каждом имени для сортировки. То есть 100 это только лишь сортировочный номер. Следующая цифра от 0 до 11 это номер логического процессора. А дальше уже «% загруженности процессора». А то сначала может показаться, что это 0% загруженности процессора и я пытаюсь это значение собрать 🙂
Единственный недостаток всего этого метода в том, что график, такой как в заголовке этого поста, нельзя создать с помощью механизма низкоуровневого обнаружения. То есть мы можем, конечно, создать не только item, но и graph объект для каждого логического процессора, но создать один суммарный график автоматически со всеми обнаруженными логическими процессорами не получится. По крайней мере я не видел как это можно было бы сделать, на форуме zabbix мне также не смогли подсказать. Это, конечно, не особенно серьезный недостаток, но если у вас 200 хостов, это может стать проблемой :). Ведь график для каждого хоста нужно будет создавать вручную.
Мониторим производительность каждого физического диска в системе
В вышеприведённом способе лучше разобраться и тогда это открывает достаточно широкие возможности для мониторинга объектов в системе, количество которых либо отличается от хоста к хосту либо их количество во все изменяется во время работы.
Например, часто случается, что нужно определить, не происходил ли недостаток в ресурсах физического диска, установленного в сервере. Чаще всего эти данные сложно уловить в реалтайме и хочется иметь их собранными постфактум. Для этого я ввел аналогичное обнаружение и для физических дисков для сбора обширной статистики по ним. И, в отличии от процессоров, элементов сбора данных я создал их с избытком. 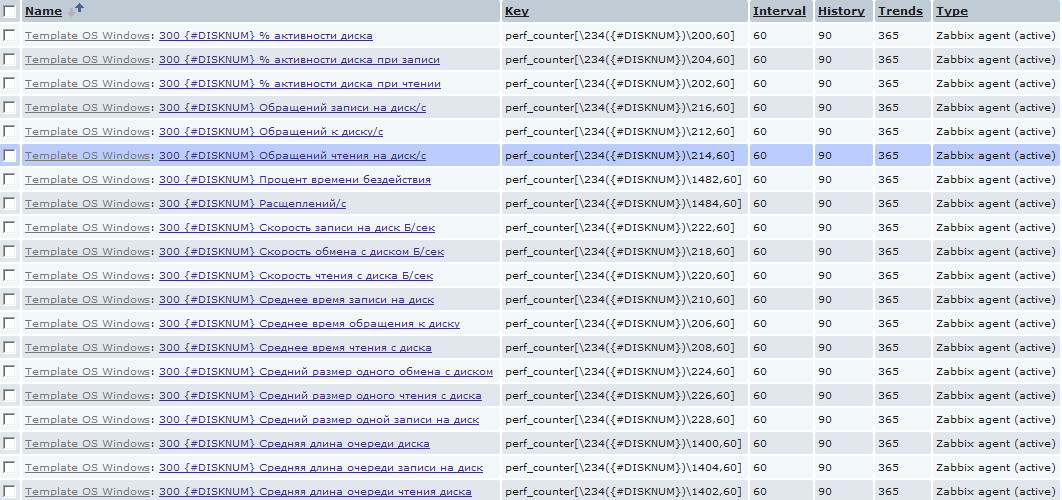
Тут, конечно, надо быть внимательным и если mysql у вас стоит на каком-нибудь стареньком забитом компе, то подобное количество достаточно быстро унесет вашу базу данных в небеса. Т.к. в приведенном примере для каждого хоста создается для каждого физического диска 20 новых элементов, которые будут создавать одного новое значение в минуту. В масштабе пары десятков серверов с кучами разных дисков это выливается в более-менее весомое количество данных. Но тут каждый волен выбирать свой путь самурая 🙂
Скрипт для LLD физических дисков выглядит так:
Добавляем новое правило обнаружения по аналогии с CPU. Точно также мы создаем нужные элементы в discovery.
Вообще, конечно, этот механизм дает довольно большие возможности по определению различных элементов для мониторинга. Таким же способом можно, например, добавить мониторинг сетевых интерфейсов, процессов в системе, служб и любых других элементов, имя которых и количество заранее неизвестно.
Надеюсь эта статья кому-нибудь поможет разобраться с LLD. С удовольствием отвечу на возникшие вопросы.
Источник
Name already in use
zabbix / templates / os / windows_agent_active / README.md
- Go to file T
- Go to line L
- Copy path
- Copy permalink
Copy raw contents
Copy raw contents
Windows by Zabbix agent active
New official Windows template. Requires agent of Zabbix 4.4 and newer.
This template has been tested on:
- Windows, version 7 and newer.
- Windows Server, version 2008 R2 and newer.
For Zabbix version: 6.4 and higher.
Install Zabbix agent on Windows OS according to Zabbix documentation.
No specific Zabbix configuration is required.
No data timeout for active agents. Consider to keep it relatively high.
Timeout after which agent is considered unavailable.
The critical threshold of the % Interrupt Time counter.
The threshold of the % Privileged Time counter.
The threshold of the Processor Queue Length counter.
The critical threshold of the CPU utilization in %.
The warning threshold of the Memory Pages/sec counter.
The warning threshold of the Free System Page Table Entries counter.
The warning threshold of the Memory util item.
This macro is used in Network interface discovery. Can be overridden on the host or linked template level.
This macro is used in Network interface discovery. Can be overridden on the host or linked template level.
This macro is used in Network interface discovery. Can be overridden on the host or linked template level.
This macro is used in Network interface discovery. Can be overridden on the host or linked template level.
This macro is used in Network interface discovery. Can be overridden on the host or linked template level.
This macro is used in Network interface discovery. Can be overridden on the host or linked template level.
This macro is used in Service discovery. Can be overridden on the host or linked template level.
This macro is used in Service discovery. Can be overridden on the host or linked template level.
This macro is used in Service discovery. Can be overridden on the host or linked template level.
This macro is used in Service discovery. Can be overridden on the host or linked template level.
The warning threshold of the minimum free swap.
The threshold for difference of system time in seconds.
This macro is used in physical disks discovery. Can be overridden on the host or linked template level.
This macro is used in physical disks discovery. Can be overridden on the host or linked template level.
Disk read average response time (in s) before the trigger would fire.
The warning threshold of disk time utilization in percent.
Disk write average response time (in s) before the trigger would fire.
The critical threshold of the filesystem utilization.
The warning threshold of the filesystem utilization.
This macro is used in filesystems discovery. Can be overridden on the host or linked template level.
This macro is used in filesystems discovery. Can be overridden on the host or linked template level.
This macro is used in filesystems discovery. Can be overridden on the host or linked template level.
This macro is used in filesystems discovery. Can be overridden on the host or linked template level.
This macro is used in filesystems discovery. Can be overridden on the host or linked template level.
This macro is used in filesystems discovery. Can be overridden on the host or linked template level.
The critical threshold of the filesystem utilization in percent.
The warning threshold of the filesystem utilization in percent.
There are no template links in this template.
Discovery of file systems of different types.
| Name | Description | Type | Key and additional info | ||||||||||||||||||||||||||||||||||||||||||||||||||||||||||||||||||||||||||||||||||||||||||||||||||||||||||||||||||||||||||||||||||||||||||||||||||||||||||||||||||||||||||||||||||||||||||||||||||||||||||||||||||||||||||||||||||||||||||||||||||||||||||||||||||||||||||||||||||||||||||||||
|---|---|---|---|---|---|---|---|---|---|---|---|---|---|---|---|---|---|---|---|---|---|---|---|---|---|---|---|---|---|---|---|---|---|---|---|---|---|---|---|---|---|---|---|---|---|---|---|---|---|---|---|---|---|---|---|---|---|---|---|---|---|---|---|---|---|---|---|---|---|---|---|---|---|---|---|---|---|---|---|---|---|---|---|---|---|---|---|---|---|---|---|---|---|---|---|---|---|---|---|---|---|---|---|---|---|---|---|---|---|---|---|---|---|---|---|---|---|---|---|---|---|---|---|---|---|---|---|---|---|---|---|---|---|---|---|---|---|---|---|---|---|---|---|---|---|---|---|---|---|---|---|---|---|---|---|---|---|---|---|---|---|---|---|---|---|---|---|---|---|---|---|---|---|---|---|---|---|---|---|---|---|---|---|---|---|---|---|---|---|---|---|---|---|---|---|---|---|---|---|---|---|---|---|---|---|---|---|---|---|---|---|---|---|---|---|---|---|---|---|---|---|---|---|---|---|---|---|---|---|---|---|---|---|---|---|---|---|---|---|---|---|---|---|---|---|---|---|---|---|---|---|---|---|---|---|---|---|---|---|---|---|---|---|---|---|---|---|---|---|---|---|---|---|---|---|---|---|---|---|---|---|---|---|---|---|---|---|---|---|
| Mounted filesystem discovery | DEPENDENT | vfs.fs.dependent.discovery
Filter: Discovery of installed network interfaces. |
DEPENDENT | net.if.discovery
Preprocessing: — JAVASCRIPT: The text is too long. Please see the template. Filter: Discovery of installed physical disks. |
ZABBIX_ACTIVE | perf_instance_en.discovery[PhysicalDisk]
Preprocessing: Filter: Discovery of Windows services of different types as defined in template’s macros. |
ZABBIX_ACTIVE | service.discovery
Filter: The CPU utilization expressed in %. The Processor Information% Interrupt Time is the time the processor spends receiving and servicing hardware interrupts during sample intervals. This value is an indirect indicator of the activity of devices that generate interrupts, such as the system clock, the mouse, disk drivers, data communication lines, network interface cards and other peripheral devices. This is an easy way to identify a potential hardware failure. This should never be higher than 20%. Context Switches/sec is the combined rate at which all processors on the computer are switched from one thread to another. Context switches occur when a running thread voluntarily relinquishes the processor, is preempted by a higher priority ready thread, or switches between user-mode and privileged (kernel) mode to use an Executive or subsystem service. It is the sum of ThreadContext Switches/sec for all threads running on all processors in the computer and is measured in numbers of switches. There are context switch counters on the System and Thread objects. This counter displays the difference between the values observed in the last two samples, divided by the duration of the sample interval. The Processor Information% Privileged Time counter shows the percent of time that the processor is spent executing in Kernel (or Privileged) mode. Privileged mode includes services interrupts inside Interrupt Service Routines (ISRs), executing Deferred Procedure Calls (DPCs), Device Driver calls and other kernel-mode functions of the Windows® Operating System. Processor DPC time is the time that a single processor spent receiving and servicing deferred procedure calls (DPCs). DPCs are interrupts that run at a lower priority than standard interrupts. % DPC Time is a component of % Privileged Time because DPCs are executed in privileged mode. If a high % DPC Time is sustained, there may be a processor bottleneck or an application or hardware related issue that can significantly diminish overall system performance. The Processor Information% User Time counter shows the percent of time that the processor(s) is spent executing The number of logical processors available on the computer. The Processor Queue Length shows the number of threads that are observed as delayed in the processor Ready Queue and are waiting to be executed. Used storage expressed in Bytes. Space utilization in % for The host name of the system. The number of threads used by all running processes. The architecture of the operating system. The total memory expressed in Bytes. Memory utilization in %. Cache Bytes is the sum of the MemorySystem Cache Resident Bytes, MemorySystem Driver Resident Bytes, MemorySystem Code Resident Bytes, and MemoryPool Paged Resident Bytes counters. This counter displays the last observed value only; it is not an average. The free space of the swap volume/file expressed in bytes. The free space of the swap volume/file expressed in %. The total space of the swap volume/file expressed in bytes. This indicates the number of page table entries not currently in use by the system. If the number is less than 5,000, there may well be a memory leak or you running out of memory. Page Faults/sec is the average number of pages faulted per second. It is measured in number of pages faulted per second because only one page is faulted in each fault operation, hence this is also equal to the number of page fault operations. This counter includes both hard faults (those that require disk access) and soft faults (where the faulted page is found elsewhere in physical memory.) Most processors can handle large numbers of soft faults without significant consequence. However, hard faults, which require disk access, can cause significant delays. This measures the rate at which pages are read from or written to disk to resolve hard page faults. If the value is greater than 1,000, as a result of excessive paging, there may be a memory leak. This measures the size, in bytes, of the non-paged pool. This is an area of system memory for objects that cannot be written to disk but instead must remain in physical memory as long as they are allocated. There is a possible memory leak if the value is greater than 175MB (or 100MB with the /3GB switch). A typical Event ID 2019 is recorded in the system event log. Availability of active checks on the host. The value of this item corresponds to availability icons in the host list. 2 — not available Incoming traffic on the network interface. Outgoing traffic on the network interface. The number of incoming packets dropped on the network interface. The number of outgoing packets dropped on the network interface. The number of incoming packets with errors on the network interface. The number of outgoing packets with errors on the network interface. Estimated bandwidth of the network interface if any. The type of the network interface. The operational status of the network interface. The system uptime expressed in the following format:»N days, hh:mm:ss». The agent always returns 1 for this item. It could be used in combination with nodata() for availability check. Rate of read operations on the disk. Rate of write operations on the disk. The current average disk queue; the number of requests outstanding on the disk while the performance data is being collected. This item is the percentage of elapsed time that the selected disk drive was busy servicing read or writes requests based on idle time. The average time for read requests issued to the device to be served. This includes the time spent by the requests in queue and the time spent servicing them. The average time for write requests issued to the device to be served. This includes the time spent by the requests in queue and the time spent servicing them. Average disk read queue, the number of requests outstanding on the disk at the time the performance data is collected. Average disk write queue, the number of requests outstanding on the disk at the time the performance data is collected. The vfs.fs.get key acquires raw information set about the file systems. Later to be extracted by preprocessing in dependent items. Raw data of win32_networkadapter.
|
Содержание
- Zabbix Documentation 5.4
- Sidebar
- Table of Contents
- 3 Пассивные и активные проверки агента
- Обзор
- Пассивные проверки
- Активные проверки
- Windows cpu by zabbix agent active xml
Zabbix Documentation 5.4
Table of Contents
3 Пассивные и активные проверки агента
Обзор
Этот раздел описывает детали пассивных и активных проверок, которые выполняются Zabbix агентом.
Zabbix использует протокол на основе JSON для взаимодействия с Zabbix агентом.
Для получения более подробных сведений об определении длины заголовка и данных, пожалуйста, обратитесь к деталям протокола.
Пассивные проверки
Пассивной проверкой является простой запрос данных. Zabbix сервер или прокси запрашивает какие-либо данные (к примеру, Загрузку CPU) и Zabbix агент отправляет обратно результат серверу.
Запрос сервера
Ответ агента
Часть в квадратных скобках выше опциональна и отправляется только по неподдерживаемым элементам данных.
Для неподдерживаемых элементов данных:
Активные проверки
Активные проверки требуют более сложной обработки. Агент должен сначала получить с сервера список элементов данных для независимой обработки.
Сервера, которые отдают активные проверки, перечислены в параметре “ServerActive” файла конфигурации агента. Частота запросов проверок настраивается параметром ‘RefreshActiveChecks’ в том же файле конфигурации. Однако, если обновление активных проверок завершится с ошибкой, запрос повторится через, жестко задано в коде, 60 секунд.
Затем агент периодически отправляет новые значения на сервер(а).
Получение списка элементов данных
Запрос агента
Ответ сервера
Сервер должен ответить положительно. У каждого полученного элемента данных обязательно должны быть указаны параметры key, delay, lastlogsize и mtime, независимо от того элемент данных является журнальным или нет.
Отправка собранных данных
Отправка агента
Виртуальный ID назначается каждому значению. Значением ID является простой счётчик с инкрементом, уникальный в пределах одной сессии передачи данных (идентифицируется при помощи токена сессии передачи данных). Этот ID используется, чтобы отбрасывать дубликаты значений, которые могут быть отправлены в средах с плохой связью.
Источник
Windows cpu by zabbix agent active xml
Windows CPU by Zabbix agent active
For Zabbix version: 5.4 and higher
Refer to the vendor documentation.
No specific Zabbix configuration is required.
The critical threshold of the % Interrupt Time counter.
The threshold of the % Privileged Time counter.
The threshold of the Processor Queue Length counter.
The critical threshold of the CPU utilization in %.
There are no template links in this template.
CPU utilization in %
The Processor Information% Interrupt Time is the time the processor spends receiving and servicing
hardware interrupts during sample intervals. This value is an indirect indicator of the activity of
devices that generate interrupts, such as the system clock, the mouse, disk drivers, data communication
lines, network interface cards and other peripheral devices. This is an easy way to identify a potential
hardware failure. This should never be higher than 20%.
Context Switches/sec is the combined rate at which all processors on the computer are switched from one thread to another.
Context switches occur when a running thread voluntarily relinquishes the processor, is preempted by a higher priority ready thread, or switches between user-mode and privileged (kernel) mode to use an Executive or subsystem service.
It is the sum of ThreadContext Switches/sec for all threads running on all processors in the computer and is measured in numbers of switches.
There are context switch counters on the System and Thread objects. This counter displays the difference between the values observed in the last two samples, divided by the duration of the sample interval.
The Processor Information% Privileged Time counter shows the percent of time that the processor is spent
executing in Kernel (or Privileged) mode. Privileged mode includes services interrupts inside Interrupt
Service Routines (ISRs), executing Deferred Procedure Calls (DPCs), Device Driver calls and other kernel-mode
functions of the Windows® Operating System.
Processor DPC time is the time that a single processor spent receiving and servicing deferred procedure
calls (DPCs). DPCs are interrupts that run at a lower priority than standard interrupts. % DPC Time is a
component of % Privileged Time because DPCs are executed in privileged mode. If a high % DPC Time is
sustained, there may be a processor bottleneck or an application or hardware related issue that can
significantly diminish overall system performance.
The Processor Information% User Time counter shows the percent of time that the processor(s) is spent executing
The number of logical processors available on the computer.
The Processor Queue Length shows the number of threads that are observed as delayed in the processor Ready Queue
and are waiting to be executed.
| Group | Name | Description | Type | Key and additional info |
|---|---|---|---|---|
| CPU | CPU utilization | ZABBIX_ACTIVE | perf_counter_en[«Processor Information(_total)% Interrupt Time»] | |
| CPU | Context switches per second | ZABBIX_ACTIVE | perf_counter_en[«SystemContext Switches/sec»] | |
| CPU | CPU privileged time | ZABBIX_ACTIVE | perf_counter_en[«Processor Information(_total)% Privileged Time»] | |
| CPU | CPU DPC time | ZABBIX_ACTIVE | perf_counter_en[«Processor Information(_total)% DPC Time»] | |
| CPU | CPU user time | ZABBIX_ACTIVE | perf_counter_en[«Processor Information(_total)% User Time»] | |
| CPU | Number of cores | ZABBIX_ACTIVE | wmi.get[root/cimv2,»Select NumberOfLogicalProcessors from Win32_ComputerSystem»] | |
| CPU | CPU queue length | ZABBIX_ACTIVE | perf_counter_en[«SystemProcessor Queue Length»] |
CPU utilization is too high. The system might be slow to respond.
«The CPU Interrupt Time in the last 5 minutes exceeds <$CPU.INTERRUPT.CRIT.MAX>%.»
The Processor Information% Interrupt Time is the time the processor spends receiving and servicing
hardware interrupts during sample intervals. This value is an indirect indicator of the activity of
devices that generate interrupts, such as the system clock, the mouse, disk drivers, data communication
lines, network interface cards and other peripheral devices. This is an easy way to identify a potential
hardware failure. This should never be higher than 20%.
Depends on:
— High CPU utilization (over <$CPU.UTIL.CRIT>% for 5m)
The CPU privileged time in the last 5 minutes exceeds <$CPU.PRIV.CRIT.MAX>%.
Depends on:
— CPU interrupt time is too high (over <$CPU.INTERRUPT.CRIT.MAX>% for 5m)
— High CPU utilization (over <$CPU.UTIL.CRIT>% for 5m)
The CPU Queue Length in the last 5 minutes exceeds <$CPU.QUEUE.CRIT.MAX>. According to actual observations, PQL should not exceed the number of cores * 2. To fine-tune the conditions, use the macro <$CPU.QUEUE.CRIT.MAX >.
Depends on:
— High CPU utilization (over <$CPU.UTIL.CRIT>% for 5m)
Please report any issues with the template at https://support.zabbix.com
Windows memory by Zabbix agent active
For Zabbix version: 5.4 and higher
Refer to the vendor documentation.
No specific Zabbix configuration is required.
The warning threshold of the Memory Pages/sec counter.
The warning threshold of the Free System Page Table Entries counter.
The warning threshold of the Memory util item.
The warning threshold of the minimum free swap.
There are no template links in this template.
| Name | Description | Expression | Severity | Dependencies and additional info |
|---|---|---|---|---|
| High CPU utilization (over <$CPU.UTIL.CRIT>% for 5m) | min(/Windows CPU by Zabbix agent active/system.cpu.util,5m)> | WARNING | ||
| CPU interrupt time is too high (over <$CPU.INTERRUPT.CRIT.MAX>% for 5m) | min(/Windows CPU by Zabbix agent active/perf_counter_en[«Processor Information(_total)% Interrupt Time»],5m)> | WARNING | min(/Windows CPU by Zabbix agent active/perf_counter_en[«Processor Information(_total)% Privileged Time»],5m)> | WARNING |
Used memory in Bytes
Total memory in Bytes
Memory utilization in %
Cache Bytes is the sum of the MemorySystem Cache Resident Bytes, MemorySystem Driver Resident Bytes,
MemorySystem Code Resident Bytes, and MemoryPool Paged Resident Bytes counters. This counter displays
the last observed value only; it is not an average.
The free space of swap volume/file in bytes.
The total space of swap volume/file in bytes.
This indicates the number of page table entries not currently in use by the system. If the number is less
than 5,000, there may well be a memory leak or you running out of memory.
Page Faults/sec is the average number of pages faulted per second. It is measured in number of pages
faulted per second because only one page is faulted in each fault operation, hence this is also equal
to the number of page fault operations. This counter includes both hard faults (those that require
disk access) and soft faults (where the faulted page is found elsewhere in physical memory.) Most
processors can handle large numbers of soft faults without significant consequence. However, hard faults,
which require disk access, can cause significant delays.
This measures the rate at which pages are read from or written to disk to resolve hard page faults.
If the value is greater than 1,000, as a result of excessive paging, there may be a memory leak.
This measures the size, in bytes, of the non-paged pool. This is an area of system memory for objects
that cannot be written to disk but instead must remain in physical memory as long as they are allocated.
There is a possible memory leak if the value is greater than 175MB (or 100MB with the /3GB switch).
A typical Event ID 2019 is recorded in the system event log.
| Group | Name | Description | Type | Key and additional info | |||
|---|---|---|---|---|---|---|---|
| Memory | Used memory | CALCULATED | vm.memory.util
Expression: last(//vm.memory.size[used]) / last(//vm.memory.size[total]) * 100 |
||||
| Memory | Cache bytes | ZABBIX_ACTIVE | perf_counter_en[«MemoryCache Bytes»] | ||||
| Memory | Free swap space | CALCULATED | system.swap.free
Expression: The free space of swap volume/file in percent. |
DEPENDENT | system.swap.pfree
Preprocessing: The used space of swap volume/file in percent. |
ZABBIX_ACTIVE | perf_counter_en[«Paging file(_Total)% Usage»] |
| Memory | Total swap space | ZABBIX_ACTIVE | system.swap.size[,total] | ||||
| Memory | Free system page table entries | ZABBIX_ACTIVE | perf_counter_en[«MemoryFree System Page Table Entries»] | ||||
| Memory | Memory page faults per second | ZABBIX_ACTIVE | perf_counter_en[«MemoryPage Faults/sec»] | ||||
| Memory | Memory pages per second | ZABBIX_ACTIVE | perf_counter_en[«MemoryPages/sec»] | ||||
| Memory | Memory pool non-paged | ZABBIX_ACTIVE | perf_counter_en[«MemoryPool Nonpaged Bytes»] |
The system is running out of free memory.
This trigger is ignored, if there is no swap configured
Depends on:
— High memory utilization (><$MEMORY.UTIL.MAX>% for 5m)
The Memory Free System Page Table Entries is less than <$MEM.PAGE_TABLE_CRIT.MIN>for 5 minutes. If the number is less than 5,000, there may well be a memory leak.
Depends on:
— High memory utilization (><$MEMORY.UTIL.MAX>% for 5m)
The Memory Pages/sec in the last 5 minutes exceeds <$MEM.PAGE_SEC.CRIT.MAX>. If the value is greater than 1,000, as a result of excessive paging, there may be a memory leak.
Depends on:
— High memory utilization (><$MEMORY.UTIL.MAX>% for 5m)
Please report any issues with the template at https://support.zabbix.com
Windows filesystems by Zabbix agent active
For Zabbix version: 6.0 and higher
Refer to the vendor documentation.
No specific Zabbix configuration is required.
This macro is used in filesystems discovery. Can be overridden on the host or linked template level.
This macro is used in filesystems discovery. Can be overridden on the host or linked template level.
This macro is used in filesystems discovery. Can be overridden on the host or linked template level.
This macro is used in filesystems discovery. Can be overridden on the host or linked template level.
This macro is used in filesystems discovery. Can be overridden on the host or linked template level.
This macro is used in filesystems discovery. Can be overridden on the host or linked template level.
The critical threshold of the filesystem utilization in percent.
The warning threshold of the filesystem utilization in percent.
There are no template links in this template.
| Name | Description | Expression | Severity | Dependencies and additional info |
|---|---|---|---|---|
| High memory utilization (><$MEMORY.UTIL.MAX>% for 5m) | min(/Windows memory by Zabbix agent active/vm.memory.util,5m)> | AVERAGE | ||
| High swap space usage (less than <$SWAP.PFREE.MIN.WARN>% free) | max(/Windows memory by Zabbix agent active/perf_counter_en[«MemoryFree System Page Table Entries»],5m) | WARNING | min(/Windows memory by Zabbix agent active/perf_counter_en[«MemoryPages/sec»],5m)> | WARNING |
Discovery of file systems of different types.
| Name | Description | Type | Key and additional info | ||||||||||||||||||||||||||||||||||||||||||||||||||||||||||||||||||||||||||||||||||||||||||||||||||||||||||||||||||||||||||||||||||||||||||||||||||||||||||||||||||||||||||||||||||||||||||
|---|---|---|---|---|---|---|---|---|---|---|---|---|---|---|---|---|---|---|---|---|---|---|---|---|---|---|---|---|---|---|---|---|---|---|---|---|---|---|---|---|---|---|---|---|---|---|---|---|---|---|---|---|---|---|---|---|---|---|---|---|---|---|---|---|---|---|---|---|---|---|---|---|---|---|---|---|---|---|---|---|---|---|---|---|---|---|---|---|---|---|---|---|---|---|---|---|---|---|---|---|---|---|---|---|---|---|---|---|---|---|---|---|---|---|---|---|---|---|---|---|---|---|---|---|---|---|---|---|---|---|---|---|---|---|---|---|---|---|---|---|---|---|---|---|---|---|---|---|---|---|---|---|---|---|---|---|---|---|---|---|---|---|---|---|---|---|---|---|---|---|---|---|---|---|---|---|---|---|---|---|---|---|---|---|---|---|---|---|---|
| Mounted filesystem discovery | ZABBIX_ACTIVE | vfs.fs.discovery
Filter: Used storage in Bytes Total space in Bytes Space utilization in % for
Two conditions should match: First, space utilization should be above <$VFS.FS.PUSED.MAX.CRIT:»<#FSNAME>«>. Second condition should be one of the following: — The disk free space is less than 5G. — The disk will be full in less than 24 hours. Two conditions should match: First, space utilization should be above <$VFS.FS.PUSED.MAX.WARN:»<#FSNAME>«>. Second condition should be one of the following: — The disk free space is less than 10G. — The disk will be full in less than 24 hours. Depends on: Please report any issues with the template at https://support.zabbix.com Windows physical disks by Zabbix agent active For Zabbix version: 5.4 and higher Refer to the vendor documentation. No specific Zabbix configuration is required. This macro is used in physical disks discovery. Can be overridden on the host or linked template level. This macro is used in physical disks discovery. Can be overridden on the host or linked template level. Disk read average response time (in s) before the trigger would fire. The warning threshold of disk time utilization in percent. Disk write average response time (in s) before the trigger would fire. There are no template links in this template.
Discovery of installed physical disks.
|
![]() The Windows Zabbix Agent provides a native interface to the Windows Performance Counters. and Event Log. This means that with minimal overhead, and no additional shells out to Powerscript or the command line, you can collect any of the metrics available from PerfMon or Event Viewer.
The Windows Zabbix Agent provides a native interface to the Windows Performance Counters. and Event Log. This means that with minimal overhead, and no additional shells out to Powerscript or the command line, you can collect any of the metrics available from PerfMon or Event Viewer.
Windows Event Log
To monitor the Windows Event log, use the eventlog[] item keys. This takes the syntax:
eventlog[name,<regexp>,<severity>,<source>,<eventid>,<maxlines>,<mode>]
I would always recommend using Event Viewer on the host to determine which event log names and exact codes you want to pull before trying to craft the query parameters.
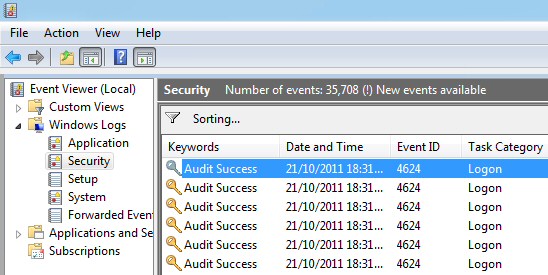
As an example, let’s capture all the interactive login events happening on the host which are logged in the “Security” event log. On a host that has a Zabbix Agent on Windows, create an item with the type “Zabbix agent (active)”:
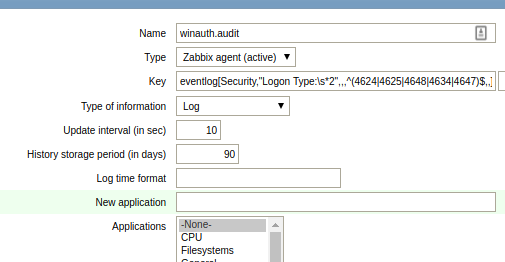
Name: winauth.audit
Type: Zabbix agent (active)
Key: eventlog[Security,"Logon Type:s*2",,,^(4624|4625|4648|4634|4647)$,,]
Type of information: Log
Update interval: 30
These 46xx codes are documented by Microsoft, and the logon type=2 signifies interactive logon.
Now going to Monitoring > Latest data after an interactive login should show you the event log entry within 30 seconds. This will show both successful as well as login failures.
Windows Performance Counters
The PerfMon tool comes standard on Windows hosts and can be used to capture and display live metrics as they are collected by the system.
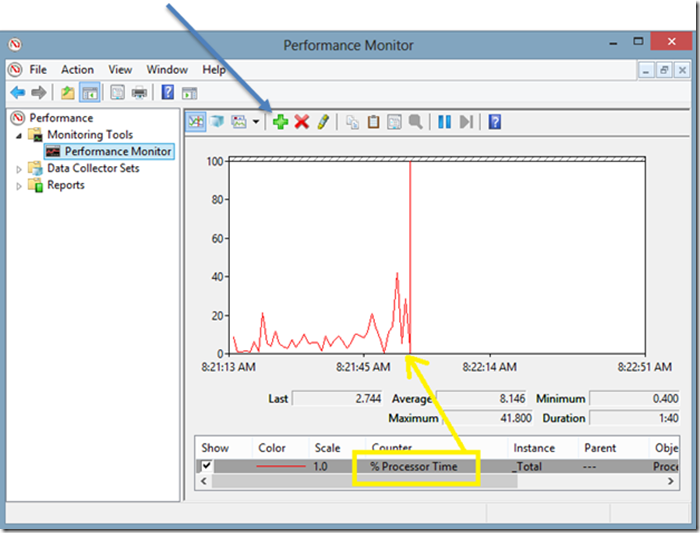
Collecting these same metrics using the Zabbix agent can be done using the perf_counter key. The syntax is:
perf_counter[counter,<interval>]
The easiest way to discover the full path to these counters is to use PerfMon to first find and examine the keys. But you can also list all the full paths from the command line using “typeperf -qx”.
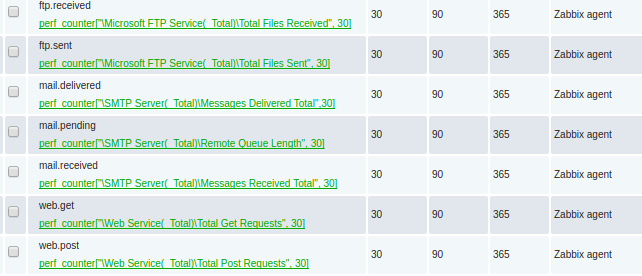
In this example, I’m going to monitor the keys for:
- Microsoft IIS total GET and PUSH operations
- Microsoft FTP Server total files sent and received
- Microsoft SMTP server total mail received, delivered, and pending
Which are represented as the Zabbix key values below:
perf_counter["Web Service(_Total)Total Get Requests",30]
perf_counter["Web Service(_Total)Total Post Requests",30]

perf_counter["Microsoft FTP Service(_Total)Total Files Sent",30]
perf_counter["Microsoft FTP Service(_Total)Total Files Received",30]

perf_counter["SMTP Server(_Total)Remote Queue Length",30]
perf_counter["SMTP Server(_Total)Messages Received Total",30]
perf_counter["SMTP Server(_Total)Messages Delivered Total",30]
This looks like the following when viewed in the Latest Data:
Each of these items created should be type=numeric(float) with an interval every 60 seconds.
REFERENCES
https://zabbix.org/wiki/Get_Zabbix
https://msdn.microsoft.com/en-us/library/ms804624.aspx (Web Service Object)
https://www.zabbix.com/documentation/3.0/manual/appendix/config/zabbix_agentd_win (agent conf, PerfCounter is sythesized avg value of sys perf meaning it needs float)
https://www.zabbix.com/documentation/2.4/manual/appendix/config/zabbix_agentd_win?s[]=perfcounter
https://www.zabbix.com/documentation/3.2/manual/config/items/itemtypes/zabbix_agent/win_keys (special item keys for Zabbix Windows agents)
https://blogs.technet.microsoft.com/brad_rutkowski/2007/09/22/using-typeperf-to-get-performance-data-on-the-command-prompt/
https://docs.microsoft.com/en-us/previous-versions/windows/it-pro/windows-server-2008-R2-and-2008/dd941621(v%3dws.10) (4634 4646 audit logoff)
https://docs.microsoft.com/en-us/previous-versions/windows/it-pro/windows-server-2008-R2-and-2008/dd941635(v%3dws.10) (4624,4625,4648 audit logon)
https://social.microsoft.com/Forums/en-US/712230b0-2d99-4cda-a374-1211117bf2a8/create-a-custom-security-log-event?forum=Offtopic (cannot write to security log, permissions)
NOTES
$ svn co svn://svn.zabbix.com/branches/2.4 (checkout source code)
eventcreate /l System /t INFORMATION /id 99 /d “just a test” (ids < 1000)
Write–EventLog –LogName Application –EntryType Error –Source MSSQLSERVER –EventId 1479 –Message “Test error event – ignore” (cannot write to SECURITY due to permissions)
Monitoring postfix queue on linux:
EnableRemoteCommands=1
UserParameter=mail.pending[*],/usr/sbin/postqueue -p | egrep -c “^[0-9A-F]{10}[^*]”
UserParameter=mail.active[*],/usr/sbin/postqueue -p | egrep -c “^[0-9A-F]{10}[*]”
typeperf -qx
typeperf -qx “SMTP Server”
typeperf -qx “Web Service”
typeperf -qx “Microsoft FTP Server” (“FTP Service” on older IIS6)
После создания элемента мониторинга создайте новый триггер, вы можете проверить, полезен ли триггер в конструкторе выражений
Выражение: {Загрузка ЦП Windows в шаблоне: perf_counter [ Processor (_Total) % времени процессора] .avg (5m)}> 80
После создания триггера добавьте график для просмотра графика использования процессора
После того, как добавление прошло успешно, вы можете просмотреть графическую таблицу CPU, и данные указывают на успешный мониторинг!
▼Примечание. Этот шаблон ввода-вывода собирает данные ввода-вывода всех физических жестких дисков всего сервера.
Например: сервер имеет твердотельный жесткий диск, механический жесткий диск, он твердотельный жесткий диск и данные механического жесткого диска отображаются вместе
При мониторинге сервера базы данных лучше всего рассматривать твердотельный диск и механический жесткий диск отдельно, используя разные пороги срабатывания.
Поскольку все жесткие диски на машине сложены вместе, очень трудно отличить триггер от твердотельного диска и механического жесткого диска
Адрес загрузки шаблона: https://files.cnblogs.com/files/Sungeek/Windows%E7%9B%91%E6%8E%A7%E7%A3%81%E7%9B%98IO.xml

4. Мониторинг Windows — изменение порога срабатывания диска
Выберите Конфигурация —> Шаблон —> (Шаблон ОС Linux / Шаблон ОС Windows)
Я здесь для мониторинга Windows, поэтому измените шаблон Windows, если вы отслеживаете Linux, вы можете изменить шаблон Linux
По умолчанию обновляется один раз в час, и изменяется до 600 секунд, то есть обновляется каждые 10 минут. Через 10 минут вы можете видеть значения мониторинга сетевой карты и диска!


Выберите конфигурацию —> шаблон —> (Шаблон ОС Linux / Шаблон ОС Windows) —> Обнаружение подключенной файловой системы —> Тип триггера
Я уже модифицировал его здесь. Если нет изменений или нет элемента триггера, вы можете нажать в правом верхнем углу (создать прототип триггера)
Имя: на диске {#FSNAME} свободное место на диске менее 50 ГБ.
Выражение: {Шаблон ОС Windows: vfs.fs.size [{# FSNAME}, бесплатно] .last (0)} <50000000000


Выберите конфигурацию —> шаблон —> (Шаблон ОС Linux / Шаблон ОС Windows) —> Обнаружение подключенной файловой системы —> Тип элемента мониторинга
Моя сторона была изменена. Если нет изменений или этот элемент мониторинга недоступен, вы можете нажать в правом верхнем углу (создать прототип элемента мониторинга)
Название: Свободное место на диске на $ 1
Выражение: vfs.fs.size [{# FSNAME}, бесплатно]
Единица измерения: B
Интервал обновления: 1 м или 60 с

5. Мониторинг правил автоматического обнаружения Windows-сетевой карты
Описание проблемы: Это шаблон Windows по умолчанию, который содержит сетевую карту сервера автообнаружения, но он автоматически найдет много других сетевых карт и другую графику.
Решение: Бесполезно удалять соответствующий графический объект напрямую, поскольку правило автоматического обнаружения будет снова автоматически обнаружено, поэтому вам необходимо изменить правило
1. Внутри правил автообнаружения —-> Обнаружение службы Windows (это можно отключить)
2. Управление —> Общее —> Регулярные выражения —> Сетевые интерфейсы для обнаружения (добавьте параметры ниже, чтобы сетевая карта не была автоматически обнаружена с этими параметрами)
1        »Microsoft [Результат неверный]
2        »Тередо [Результат ложный]
3        »Qos [результат ложный]
4        »ВПП [Результат неверный]
5        »RAS [Результат ложный]
6        »WAN [результат ложный]
7    »    ^Nu[0-9.]*$ [Результат ложный]
8    »    ^[Ss] ystem $ [Результат ложный]
9    »    ^[Ll]o[0-9.]*$ [Результат ложный]
10    »    ^NULL[0-9.]*$ [Результат ложный]
11    »    ^(In)?[Ll]oop[Bb]ack[0-9._]*$ [Результат ложный]
12    »    ^Программный интерфейс Loopback [результат ложный]
13        »Сетевой трафик в Broadcom NetXtreme Gigabit Ethernet [Результат неверен]


6. Настройте функцию почтовой тревоги на сервере
Я использую корпоративную электронную почту Tencent
Как показано на рисунке ниже, Management —> Alarm Media Type —> Email
Следует отметить, что в качестве имени пользователя следует указать свою служебную электронную почту, пароль ввести пароль
Сначала я подумал, что это имя электронной почты, поэтому я не мог его отправить, я мог использовать свой почтовый ящик QQ
SMTP-сервер: smtp.exmail.qq.com
Порт: 465
SMTP электронная почта: [email protected]
Имя пользователя: [email protected]

Конфигурация —> Действие —> Триггер
Создать триггер для отправки оповещений по электронной почте

Операция:
Заголовок по умолчанию: сбой {TRIGGER.STATUS}, сервер: {HOSTNAME1}: сбой {TRIGGER.NAME}!
Содержание сообщения:
Хост тревоги: {HOSTNAME1}
Время будильника: {EVENT.DATE} {EVENT.TIME}
Уровень тревоги: {TRIGGER.NAME}
Элемент тревоги: {TRIGGER.KEY1}
Подробности вопроса: {ITEM.NAME}: {ITEM.VALUE}
Текущий статус: {TRIGGER.STATUS}: {ITEM.VALUE1}
Идентификатор события: {ENET.ID}
Операция восстановления:
Заголовок по умолчанию: Восстановить {TRIGGER.STATUS}, Сервер: {HOSTNAME1}: {TRIGGER.NAME} восстановлен!
Содержание сообщения:
Хост тревоги: {HOSTNAME1}
Время будильника: {EVENT.DATE} {EVENT.TIME}
Уровень тревоги: {TRIGGER.NAME}
Элемент тревоги: {TRIGGER.KEY1}
Подробности вопроса: {ITEM.NAME}: {ITEM.VALUE}
Текущий статус: {TRIGGER.STATUS}: {ITEM.VALUE1}
Идентификатор события: {ENET.ID}
Подтвердите операцию:
Название по умолчанию: Подтверждено: {TRIGGER.NAME}
Содержание сообщения:
{USER.FULLNAME} подтвердил проблему {ACK.DATE} {ACK.TIME} следующее сообщение:
{ACK.MESSAGE}
Текущее состояние проблемы: {EVENT.STATUS}

Наконец, настройте среду тревоги, то есть, чтобы активировать условие тревоги, вам нужно отправить электронное письмо, чтобы узнать, какой почтовый ящик
Нажмите на маленький аватар, затем введите основную информацию пользователя, выберите медиа-сигнал тревоги, чтобы установить
Вы можете выбрать уровень серьезности самостоятельно. После того, как настройка включена, функция будильника установлена!


Будем использовать активного Zabbix-агента для слежения за температурой процессора.
Уверен, что важность мониторинга температуры процессора объяснять не нужно.
Замечание 1.
Способ установки Python 2.7 описан тут: https://www.mihanik.net/tihaja-ustanovka-python-2-7/
Замечание 2.
Способ становки Zabbix-агента (клиента) описан тут: https://www.mihanik.net/ustanovka-zabbix-klienta/
1. Собираем данные по температуре при помощи скрипта.
Всё, что касается измерения температуры процессора (процессоров) будет располагаться в каталоге C:ZabbixscriptsOHMR
Скрипт написан на Python 2.7, он собирает данные по температуре процессора (процессоров) и формирует 2 файла:
- C:zabbixscriptsOHMRcpu0.txt – температура первого процессора
- C:zabbixscriptsOHMRcpu1.txt – температура второго процессора.
Замечание 1.
Если второго процессора в компьютере нет, то в файле cpu1.txt будет всегда нулевая температура.
Замечание 2.
Для получения температуры процессора будет использоваться OpenHardwareMonitor (консольная его версия). Страницу проекта можно найти тут: https://github.com/openhardwaremonitor/openhardwaremonitor . Дело в том, что при помощи WMI действительную температуру процессора не узнать. Чтобы узнать текущую температуру нужно прочитать данные из регистров процессора, чтобы прочитать данные из регистров процессора, нужно работать из нулевого кольца защиты, а чтобы попасть в нулевое кольцо, нужно писать драйвер… Вот OpenHardwareMonitor и делает за нас всю эту черновую работу. Нам остаётся только проанализировать то, что он нам выдаст.
Сам скрипт сохранён под именем C:zabbixscriptsOHMROHMR.py.
Текст скрипта:
# -*- coding: utf-8 -*-

import os
import sys
import ctypes

#
# Функция проверки наличия прав администратора
# Вход: нет
# Выход: true - есть права администратора,
#        false - нет прав администратора
#
def is_admin():
    try:
        return ctypes.windll.shell32.IsUserAnAdmin()
    except:
        return False

################################################################################
#   Начало программы
################################################################################
def main(argv=None):

   # Проверяем наличие прав админа.
   if not is_admin ():
      sys.exit ('Not enough permissions to run the script !!!')

   # Устанавливаем кодировку по умолчанию.
   reload(sys)
   sys.setdefaultencoding('utf8')

   # Устанавливаем имена файлов, где будет храниться температура процесcоров
   cpu0 = 'C:/zabbix/scripts/OHMR/cpu0.txt'
   cpu1 = 'C:/zabbix/scripts/OHMR/cpu1.txt'

   # Получаем результат работы OHMR
   OHMR = []
   OHMR = os.popen("C:zabbixscriptsOHMROpenHardwareMonitorReport.exe").read().splitlines()

   # Высчитываем температуру 0-го и, возможно, 1-го процесора

   n0 = 0
   sum0 = 0

   n1 = 0
   sum1 = 0

   for i in OHMR:
      if (':' in i) and ('(/intelcpu/0/temperature/' in i):
         t = i.split()
         n0 = n0 + 1
         sum0 = sum0 + int(t[8])

      if (':' in i) and ('(/intelcpu/1/temperature/' in i):
         t = i.split()
         n1 = n1 + 1
         sum1 = sum1 + int(t[8])

   if n0>0:
      sum0 = sum0 / n0

   if n1>0:
      sum1 = sum1 / n1

   # Сохраняем температуру 0-го процессора в файл
   f = open(cpu0,'w')
   try:
      f.write(str(sum0))
   except Exception:
      pass
   finally:
      f.close()

   # Сохраняем температуру 1-го процессора в файл
   f = open(cpu1,'w')
   try:
      f.write(str(sum1))
   except Exception:
      pass
   finally:
      f.close()

if __name__ == "__main__":
    sys.exit(main())
2. Устанавливаем скрипт в системе.
Скрипт лучше запускать каждые 5-10 минут. Я обычно это делаю каждые 10 минут – не слишком часто, но и не слишком редко.
Запланировать выполнение скрипта можно при помощи планировщика Windows. Задание планировщика можно создать вручную, а можно и при помощи bat-файла.
Я обычно это делаю при помощи “батника”, имя своему батнику я дал INSTALL_OHMR_py.bat .
Текст скрипта:
@echo off

Rem Предполагаем, что на Windows XP скрипт запускается администратором.
Rem Для более старших систем это неверно.

rem Получаем версию ОС
ver | find "5.1."

rem Windows XP ?
If %errorlevel%==0  (
	rem Пропускаем проверку админских прав
	GOTO SKIPADMIN
 )

SET HasAdminRights=0

FOR /F %%i IN ('WHOAMI /PRIV /NH') DO (
	IF "%%i"=="SeTakeOwnershipPrivilege" SET HasAdminRights=1
)

IF NOT %HasAdminRights%==1 (
	ECHO .
	ECHO Not enough permissions to run the script !!!
	ECHO .
	GOTO END
)

:SKIPADMIN

rem Получаем версию ОС
rem Windows XP ?

ver | find "5.1."

If %errorlevel%==0  (
rem Windows XP
	SCHTASKS /Create /RU "NT AUTHORITYSYSTEM" /SC HOURLY /ST 00:00:00 /TN "OHMR0" /TR "python "C:zabbixscriptsOHMROHMR.py""
	SCHTASKS /Create /RU "NT AUTHORITYSYSTEM" /SC HOURLY /ST 00:10:00 /TN "OHMR1" /TR "python "C:zabbixscriptsOHMROHMR.py""
	SCHTASKS /Create /RU "NT AUTHORITYSYSTEM" /SC HOURLY /ST 00:20:00 /TN "OHMR2" /TR "python "C:zabbixscriptsOHMROHMR.py""
	SCHTASKS /Create /RU "NT AUTHORITYSYSTEM" /SC HOURLY /ST 00:30:00 /TN "OHMR3" /TR "python "C:zabbixscriptsOHMROHMR.py""
	SCHTASKS /Create /RU "NT AUTHORITYSYSTEM" /SC HOURLY /ST 00:40:00 /TN "OHMR4" /TR "python "C:zabbixscriptsOHMROHMR.py""
	SCHTASKS /Create /RU "NT AUTHORITYSYSTEM" /SC HOURLY /ST 00:50:00 /TN "OHMR5" /TR "python "C:zabbixscriptsOHMROHMR.py""
 ) else (
rem НЕ Windows XP
	SCHTASKS /Create /RU "NT AUTHORITYSYSTEM" /SC DAILY /ST 00:00 /RI 10 /DU 24:00 /TN "OHMR" /TR "python "C:zabbixscriptsOHMROHMR.py"" /RL HIGHEST /F
 )

del /f /q C:zabbixscriptsOHMRcpu0.txt
del /f /q C:zabbixscriptsOHMRcpu1.txt

python C:zabbixscriptsOHMROHMR.py

:END

EXIT /B
3. Формируем шаблон в Zabbix.
В Zabbix при этом добавляем несложный шаблон.
Сначала приведу описание шаблона в картинках.
Создаём шаблон с именем : Active Computer – Python – CPU Temperature…

Группа элементов данных: CPU

Элементы данных:
- CPU0 Temperature – vfs.file.contents[C:zabbixscriptsOHMRcpu0.txt]
- CPU1 Temperature – vfs.file.contents[C:zabbixscriptsOHMRcpu1.txt]


Триггеры:
- Информация {HOST.NAME}. Температура процессора выше 50 градусов {Active Computer – Python – CPU Temperature:vfs.file.contents[C:zabbixscriptsOHMRcpu1.txt].last()}>=50 and {Active Computer – Python – CPU Temperature:vfs.file.contents[C:zabbixscriptsOHMRcpu1.txt].last()}<60
- Информация {HOST.NAME}. Температура процессора выше 50 градусов {Active Computer – Python – CPU Temperature:vfs.file.contents[C:zabbixscriptsOHMRcpu0.txt].last()}>=50 and {Active Computer – Python – CPU Temperature:vfs.file.contents[C:zabbixscriptsOHMRcpu0.txt].last()}<60
- Предупреждение {HOST.NAME}. Температура процессора выше 60 градусов {Active Computer – Python – CPU Temperature:vfs.file.contents[C:zabbixscriptsOHMRcpu1.txt].last()}>=60 and {Active Computer – Python – CPU Temperature:vfs.file.contents[C:zabbixscriptsOHMRcpu1.txt].last()}<70
- Предупреждение {HOST.NAME}. Температура процессора выше 60 градусов {Active Computer – Python – CPU Temperature:vfs.file.contents[C:zabbixscriptsOHMRcpu0.txt].last()}>=60 and {Active Computer – Python – CPU Temperature:vfs.file.contents[C:zabbixscriptsOHMRcpu0.txt].last()}<70
- Средняя {HOST.NAME}. Температура процессора выше 70 градусов {Active Computer – Python – CPU Temperature:vfs.file.contents[C:zabbixscriptsOHMRcpu1.txt].last()}>=70 and {Active Computer – Python – CPU Temperature:vfs.file.contents[C:zabbixscriptsOHMRcpu1.txt].last()}<80
- Средняя {HOST.NAME}. Температура процессора выше 70 градусов {Active Computer – Python – CPU Temperature:vfs.file.contents[C:zabbixscriptsOHMRcpu0.txt].last()}>=70 and {Active Computer – Python – CPU Temperature:vfs.file.contents[C:zabbixscriptsOHMRcpu0.txt].last()}<80
- Высокая {HOST.NAME}. Температура процессора выше 80 градусов {Active Computer – Python – CPU Temperature:vfs.file.contents[C:zabbixscriptsOHMRcpu1.txt].last()}>=80
- Высокая {HOST.NAME}. Температура процессора выше 80 градусов {Active Computer – Python – CPU Temperature:vfs.file.contents[C:zabbixscriptsOHMRcpu0.txt].last()}>=80


И для большей наглядности добавим графики…

А вот и готовый для импорта заархивированный файл с описанным выше шаблоном: Active Computer – Python – CPU Temperature.xml
Описанные ранее скрипты можно найти в моём репозитории: https://github.com/mihanik2000/ZabbixActiveAgent/tree/master/zabbix/scripts/OHMR
4. Сбор данных.
Осталось назначить созданный шаблон соответствующему узлу сети и ждать начала поступления данных.


Всё!
I’m trying to monitor CPU utilization of windows 7 32bit PC (C2D E8400) using zabbix.
I tried both «perf_counter[Processor Information(_Total)% Processor Time]» and «system.cpu.util[,system,avg5]». After some time status of these items reverted itself to «Unsupported».
Is this problem on agent side, or at server? How to fix it? Ideally I want to see percentages load per each core.
UPD: topic and description updated.
UPD2: these counters work, but their value are float, and not decimal as I thought.
asked Jan 5, 2011 at 15:04
![]()
1
CPU load (what you have) is not the same as CPU utilization (what you’re trying to get). Load is a measurement of the average number of processes waiting on the processor(s), whilst utilization is the amount of time the processor was doing work during a given time snapshot. You probably want to look at the counter:
perf_counter[Processor(_Total)% Processor Time]
It’s been a while since I’ve used zabbix, so syntax might have changed.
answered Jan 5, 2011 at 17:03
![]()
Jon AnglissJon Angliss
1,79210 silver badges8 bronze badges
4
I just added the items and triggers for:
 system.cpu.util[,,avg1]

 system.cpu.util[,,avg5]

 system.cpu.util[,,avg15]
It is working in Zabbix Agent 2.0.4 and Windows 2008. Because have differences between CPU Load and CPU Utilization.
![]()
Daniel t.
9,1411 gold badge32 silver badges36 bronze badges
answered Feb 28, 2013 at 18:38
![]()