| title | description | keywords | ms.date | |||
|---|---|---|---|---|---|---|
|
Download Debugging Tools for Windows — WinDbg |
This page provides downloads for the Windows Debugging tools, such as WinDbg. |
|
03/10/2022 |
Download Debugging Tools for Windows
The Windows Debugger (WinDbg) can be used to debug kernel-mode and user-mode code, analyze crash dumps, and examine the CPU registers while the code executes.
To get started with Windows debugging, see Getting Started with Windows Debugging.
 Download WinDbg Preview
WinDbg Preview is a new version of WinDbg with more modern visuals, faster windows, and a full-fledged scripting experience. It is built with the extensible object-orientated debugger data model front and center. WinDbg Preview is using the same underlying engine as WinDbg today, so all the commands, extensions, and workflows still work as they did before.
-
Download WinDbg Preview from the Microsoft Store: WinDbg Preview.
-
Learn more about installation and configuration in WinDbg Preview — Installation.
Debugging Tools for Windows (WinDbg)
Get Debugging Tools for Windows (WinDbg) from the SDK: Windows SDK. Use the download link on the Windows SDK page, as the Debugging Tools for Windows are not available as part of Visual Studio.
If you just need the Debugging Tools for Windows, and not the Windows Driver Kit (WDK) for Windows, you can install the debugging tools as a standalone component from the Windows Software Development Kit (SDK).
In the SDK installation wizard, select Debugging Tools for Windows, and deselect all other components.

Adding the Debugging Tools for Windows if the SDK is already installed
If the Windows SDK is already installed, open Settings, navigate to Apps & features, select Windows Software Development Kit, and then select Modify to change the installation to add Debugging Tools for Windows.
Looking for the debugging tools for earlier versions of Windows?
To download the debugger tools for previous versions of Windows, you need to download the Windows SDK for the version you are debugging from the
Windows SDK and emulator archive. In the installation wizard of the SDK, select Debugging Tools for Windows, and deselect all other components.
Learn more about the debuggers
Learn more about WinDbg and other debuggers in Debugging Tools for Windows (WinDbg, KD, CDB, NTSD).
Looking for related downloads?
-
Download the Windows Driver Kit (WDK)
-
Windows Symbol Packages
-
Windows Hardware Lab Kit
-
Download and install the Windows Assessment and Deployment Kit (Windows ADK)
-
Windows Insider — Windows Preview builds
Table of Contents
- Introduction to Troubleshooting Windows Server 2012 Printing
- Tools for Troubleshooting Printing Issues
- Logging Options
- PrintService Event Log Channel
- Device Configuration Event Log
- Gathering Relevant Logs
- Troubleshooting the Print Subsystem
- Overview
- Installing and Configuring the Debugging Tools
- Installing and Configuring Application Verifier
- Windows Debuggers
- CDB and NTSD
- WinDbg
- KD
- Application Verifier
- AppVerifier Configuration
- Spooler Configuration
- Terminate on error
- Debug break on error
- Print Spooler Vectored Exception Handler
- Regedit Script
- AppVerifier Output
- Running Tests and Analyzing Results
- Print Verifier Messages
- Collecting Data from Print Verifier Stops
- Determine the Reason for the Stop
- Create a Dump File
- Troubleshooting Windows Server 2012 Printing Features
- Troubleshooting Branch Office Direct Printing
- Event Log Information
Introduction to Troubleshooting Windows Server 2012 Printing
Please feel free to update, add to, or add additional Troubleshooting articles to compliment this introductory article. Your troubleshooting insight and experiences are valuable to the community!
Troubleshooting Printing issues in Windows Server 2012 follows the same basic process as was used in Windows Server 2008 R2:
- Identify and then document the type of problem. Is the problem an inability to print any documents or only certain types of documents? Is the problem only seen with a specific application or when printing a specific document? Is the problem seen with only
a V3 driver or only with a V4 driver? - Gather information about errors logged or displayed to the user or admin. Gather screenshots from both the Print Server and the Client if possible.
- Enable logging and event channels for the Print Spooler and any other feature specific logs or event channels. If a new feature in Windows Server 2012 has a feature specific log then it will be discussed in the following sections.
- Reproduce the problem and gather relevant logs and troubleshooting data. In many cases, you will need to gather logs from both the Server and the Client.
- Troubleshoot the problem based on a review of the data and make relevant changes.
- Test to make sure the issue is resolved.
Tools for Troubleshooting Printing Issues
The following tools are commonly used to troubleshoot Printing issues in Windows. Each tool will be discussed in greater detail along with configuration steps for each specific troubleshooting scenario.
- Event Viewer
- Windows Debugging Tools
- Application Verifier
↑
Back to top
Logging Options
When you troubleshoot a printing issue, you should enable the log for the PrintService event channel.
PrintService Event Log Channel
The PrintService Event Log channel includes both an Admin and an Operational log. The Admin log is enabled by default, but the Operational log is not.
To enable the Operational Log, do the following:
1. Open Event Viewer
2. Expand Application and Services LogsMicrosoftWindowsPrintService.
3. Right-click Operational and choose Enable Log.
|
Note: |
The PrintService Operational Log will log a great number of events on a busy print server and should only be enabled for troubleshooting purposes. Disable the log once troubleshooting is completed. You can |
↑
Back to top
Device Configuration Event Log
The Device Configuration Event log is enabled by default and is helpful when diagnosing printer driver problems. The event log is located at the following path:
Applications and Services LogsMicrosoftWindowsKernel-PnPDevice Configuration
Gathering Relevant Logs
The following logs are helpful in diagnosing any printing related issue:
Table 1: Relevant Logs
|
Log |
Location |
|
Setupapi.app.log |
%windir%infsetupapi.app.log |
|
Setupapi.dev.log |
%windir%infsetupapi.dev.log |
|
Setupapi.dev.log overflow |
%windir%infsetupapi.dev.log.YYYYMMDD_HHMMSS.log |
|
Setupapi.dev.log overflow |
%windir%infsetupapi.setup.log |
|
Windows Update Log |
%windir%WindowsUpdate.log |
|
Device Config Event Log |
%windir%System32winevtLogsMicrosoft-Windows-Kernel-PnP%4Configuration.evtx |
↑
Back to top
Troubleshooting the Print Subsystem
Overview
The Windows® print subsystem supports a wide variety of printer drivers, and although Windows Server 2012 introduces a new printer driver model, many Windows Server 2012 print servers will still use a large number of V3 drivers. Although this flexibility
provides customers with a wide range of product options, the complexity and diversity of these options make it a challenge for system administrators and information technology (IT) professionals to debug a problematic configuration or identify the components
that might be responsible for system instability.
This section describes the test and troubleshooting tools that can test the Windows print system that are available from Microsoft to system administrators and IT support staff. It also describes the procedures for testing and analyzing the information that
these tools produce. You can use these tools and procedures to troubleshoot problems in deployed servers and to test printer and print server configurations before they are deployed.
The following are the general steps to test and troubleshoot the print subsystem:
- Download and install the tools. Download and install Debugging Tools for Windows and Application Verifier (AppVerifier) on the computer that you want to test. For links to these downloads, see “Resources” at the end of this paper.
- Configure the debugger. Configure the debugger and, if necessary, a remote debugging console to examine the problem and record information for later analysis by Microsoft Product Support engineers.
- Configure AppVerifier.
Configure AppVerifier and Print Verifier for the type of test or tests that you want to perform.
- Run the tests. Print the documents that cause the error or test the component or configuration.
- Record and analyze the results. Record the results that AppVerifier produces. At this point, you can send this information to Microsoft Product Support engineers or analyze the information and continue troubleshooting.
- Correct the problem and repeat the tests.
After you have found and corrected the problem, repeat the tests to make sure that those problems were not masking another problem.
↑
Back to top
Installing and Configuring the Debugging Tools
The debugging tools from Microsoft—such as the Windows debugger and AppVerifier—can help you analyze a problem. They also collect information that is detailed enough to help a Microsoft Product Support engineer troubleshoot the problem. AppVerifier manages
the tests that can help you locate and identify problems in applications and system components, such as the print spooler, printer queues, and printer drivers.
To install the Debugging Tools for Windows, do the following:
- Download the Windows Driver Kit for Windows Server 2012 and run the wdksetup.exe installer.
- Install Debugging Tools and Application Verifier, rest of WDK is optional.
Installing and Configuring Application Verifier
For information about installing and using AppVerifier, see
Testing Applications with AppVerifier(http://technet.microsoft.com/library/bb457063.aspx) and the WinHEC PowerPoint presentation
Print Driver Development Tools and Print Verifier http://download.microsoft.com/download/5/E/6/5E66B27B-988B-4F50-AF3A-C2FF1E62180F/CON-T608_WH08.pptx)TBD
↑
Back to top
Windows Debuggers
The Windows debuggers let you see inside applications and drivers and collect more detailed information about the application.
Debugging Tools for Windows includes several source-level debuggers: Console Debugger (CDB), Microsoft NT Symbolic Debugger (NTSD), Windows Debugger (WinDbg), and Kernel Debugger (KD).
CDB and NTSD
CDB is a character-based console program that enables low-level analysis of the user-mode memory and program code in Windows applications. NTSD is a variation of CDB that is identical to CDB in every way except that NTSD spawns a new text window when it
is started whereas CDB inherits the command window from which it was invoked. Both CDB and NTSD are console applications that can debug user-mode programs.
NTSD is available in Debugging Tools for Windows and can also be found in the system32 directory of Windows. Because the version of NTSD in system32 is more limited than the version in Debugging Tools for Windows, you should use only the version of NTSD
or CDB that was installed by Debugging Tools for Windows. The version of NTSD in the system32 directory has the following limitations:
- It cannot be used for remote debugging through the debugger.
- It might not match the information found in this document.
WinDbg
WinDbg is a Windows-based debugging tool that can debug both user mode and kernel mode. WinDbg provides source-level debugging for the Windows kernel, kernel-mode drivers, system services, user-mode applications, and user-mode drivers. WinDbg could be used
to debug the print subsystem, but the NTSD commands that are described in this document might not work the same way in WinDbg.
KD
KD is a character-based console program that enables in-depth analysis of kernel-mode activity on all NT-based operating systems. KD supports multiprocessor debugging and can be used to debug kernel-mode programs and drivers and to monitor the behavior of
the operating system. This debugger is not necessary for debugging the print subsystem because the print subsystem components run in user mode.
Application Verifier
AppVerifier is a run-time verification and test tool that monitors programs for compatibility, stability, and security issues. If you suspect that the print subsystem has a problem, you can also use the Print Verifier feature of AppVerifier to examine the
print subsystem in greater detail. The Print Verifier feature is described later in this document.
AppVerifier Configuration
For Windows Server® 2003 SP1 and later versions of Windows, you can configure AppVerifier to help monitor and detect problems in the print spooler. Print Verifier is a feature of AppVerifier that provides additional monitoring of the print subsystem. By
enabling the Print tests in AppVerifier, you can test how applications call the print APIs and detect problems in applications and printer drivers. Configure AppVerifier and the Print Verifier feature to monitor the print subsystem by entering the following
command in a command window:
appverif -enable heaps exceptions locks handles PrintAPI PrintDriver -for spoolsv.exe printfilterpipelinesvc.exe printisolationhost.exe
After configuring the AppVerifier, you might be required to restart the computer for the settings to take effect. At the very least, you must restart the print spooler service.
|
Do Not: |
Only use the AppVerifier on the spooler process to troubleshoot a problem, do not enable these options if you are not troubleshooting a printer subsystem problem. Once the problem has been resolved, configure the AppVerifier to stop monitoring |
The following screenshots show the spooler process correctly configured using the AppVerifier GUI:
Figure 1: AppVerifier Config 1

Figure 2
: AppVerifier Config 2

↑
Back to top
Spooler Configuration
The spooler includes additional debugging features that you can configure in the system registry. Use regedit.exe to make these changes manually, or use the regedit scripts that are found later in this document.
|
Warning: |
Use extreme caution when modifying the registry directly. Modifying some areas of the system registry can cause serious problems with the operating system. Make sure that you back up the registry and know how to restore it before you |
The following section describes how to configure the spooler debugging features in Windows Server 2012.
In Windows Server 2012, the spooler supports the following debugging features:
-
Terminate on error
To explicitly control whether the system terminates the spooler when it encounters an error in the spooler, create a subkey named
TerminateOnFatalException under the following registry key:
HKEY_LOCAL_MACHINESYSTEMCurrentControlSetControlPrint
Assign a REG_DWORD value to this subkey to enable (if nonzero) or disable (if zero) terminating on an error. By default (if the value is missing from the registry key or the registry key is missing), terminating on an error is enabled.
If this feature is disabled, the spooler’s exception handler allows the exception to pass to the next available handler, which is Service Control Manager (SCM). The SCM writes a Service Stop Operations event (event ID 7037) to the WindowsSystem log.
-
Debug break on error
To enable the system to break into the debugger when it encounters an error in the spooler, create a subkey that is named
BreakOnFatalException under the following registry key:
HKEY_LOCAL_MACHINESYSTEMCurrentControlSetControlPrint
Assign a REG_DWORD value to this subkey to enable (if nonzero) or disable (if 0) breaking on an error. By default (if the value is missing from the registry key or the registry key is missing), breaking on an error is disabled.
The TerminateOnFatalException and BreakOnFatalException keys affect error handling that occurs in the spooler, in the print filter pipeline, and in all printer driver isolation (“sandbox”) host processes. When one of these modules fails, the spooler reports
the error to Windows Error Reporting (WER), which logs the error. A later section of this document describes how to view the log.
Print Spooler Vectored Exception Handler
The Print Spooler process contains an internal that is designed to handle the following exceptions:
Before Windows 7 :
EXCEPTION_ACCESS_VIOLATION
EXCEPTION_INT_DIVIDE_BY_ZERO
EXCEPTION_DATATYPE_MISALIGNMENT
Added in Windows 7 :
EXCEPTION_POSSIBLE_DEADLOCK
EXCEPTION_ILLEGAL_INSTRUCTION
EXCEPTION_BREAKPOINT
EXCEPTION_STACK_OVERFLOW
STATUS_INSTRUCTION_MISALIGNMENT
STATUS_PRIVILEGED_INSTRUCTION
STATUS_HANDLE_NOT_CLOSABLE
STATUS_ASSERTION_FAILURE
STATUS_GUARD_PAGE_VIOLATION
Regedit Script
Instead of manually creating the registry keys to configure the spooler for debugging, you can create a registry script to create the registry keys. Load the script into the registry by using regedit.exe. The following text is a registry script that can
be saved as a text file and used to configure the spooler for debugging in Windows 7. To create this file, run Notepad and copy the following text into Notepad:
REGEDIT4
;;
;; Regedit script to enable Print Verifier debugging in
;; the print spooler in Windows Server 2012.
;;
[HKEY_LOCAL_MACHINESYSTEMCurrentControlSetControlPrint]
«TerminateOnFatalException»=dword:00000001
«BreakOnFatalException»=dword:00000001
The first line in the Notepad document must be the line that contains REGEDIT4. On the
File menu, click Save As and, in the Save As dialog box, save the document by selecting
All Files in the Save as type combo box and enter
EnablePrintVer.reg in the File name box. The .reg file extension is required to associate this file with regedit.exe. In Windows Explorer, run EnablePrintVer.reg to add the values to the registry and configure the spooler for AppVerifier
troubleshooting.
To remove these settings after you are finished troubleshooting the system, the following text can be saved as a text file and used by Regedit to clear the two registry entries. To create this file, run Notepad and copy the following text into Notepad:
REGEDIT4
;;
;; Regedit script to remove the Print Verifier debugging
;; settings for the print spooler in Windows Server 2012.
;;
[-HKEY_LOCAL_MACHINESYSTEMCurrentControlSetControlPrint
TerminateOnFatalException]
[-HKEY_LOCAL_MACHINESYSTEMCurrentControlSetControlPrint
BreakOnFatalException]
The first line in the Notepad document must be the line that contains REGEDIT4. On the
File menu, click Save As and, in the Save As dialog box, save the document by selecting
All Files in the Save as type combo box and enter
DisablePrintVer.reg in the File name box. As with the previous file, the .reg file extension is required. In Windows Explorer, run DisablePrintVer.reg to remove the values from the registry and return the spooler to normal operation.
AppVerifier Output
If the spooler fails while AppVerifier is running, AppVerifier writes information about the failure to one or more log files. The following section discusses the log file that AppVerifier creates in Windows Server 2012.
When a spooler failure occurs in Windows Server 2012, AppVerifier always reports the failure to WER, which writes information about the failure to a log file that you can view through the Event Viewer system tool. To view the log file, do the following:
- From the Start Screen, search for Event Viewer and run it.
- In the left pane of the Event Viewer window, click Windows Logs, and then click
Application.
After you complete these steps, a list of application events from the log file appears in the center pane of the Event Viewer window. Scroll through the list to find information about the spooler failure.
↑
Back to top
Running Tests and Analyzing Results
After you have configured the software, run the test or print the document that is causing the error or that tests the new configuration. When AppVerifier detects an error, it breaks into the debugger and displays a stop code with a message that indicates
the nature of the problem.
Print Verifier Messages
The Print Verifier tests many different aspects of the components in the print subsystem such as how those components are used by the spooler and applications and how they use system resources. Print Verifier tests both the print APIs that an application
uses and the resources that printer drivers use.
The Help file in AppVerifier contains more detailed information about the Print Verifier messages.
Collecting Data from Print Verifier Stops
When AppVerifier breaks into the debugger, you should first determine why the program stopped and then use the debugger to create a dump file. The dump file records the state of the system and the application at the time of the error.
If you want to continue to investigate the problem further by using the debugger, you should create a log file and keep detailed notes of your investigation. The log file will serve as a convenient reference when you review your investigation and can also
provide valuable information to the Microsoft Product Support engineers.
Determine the Reason for the Stop
Before debugging the program, you must first determine whether AppVerifier or another program caused the program to stop in the debugger. Check the following conditions to make sure that you are investigating a problem in the print subsystem that AppVerifier
detected.
- Has the program stopped at a user-mode breakpoint?
When a program stops at a user-mode breakpoint in the debugger, the console screen should display the following command prompt:
0:000>
The actual numbers that precede the greater-than sign (>) might be different because they indicate the process thread ID that is being debugged.
If the command prompt looks something like:
0:kd>
then the break is from the kernel debugger and the problem is outside the scope of this document.
- Was AppVerifier configured to test for heap errors in Spoolsv.exe?
Make sure that AppVerifier has the Heaps test enabled under the Basics test category in the
Tests window for the spoolsv.exe application.
- Were all other programs under test configured for heap errors?
Make sure that, at a minimum, the Heaps test is enabled under the Basics test category in the
Tests window of AppVerifier for all applications that are being tested. For more thorough testing. you can also enable the Exceptions, Locks, Handles, PrintDriver, and PrintAPI tests. When you test XPSDrv printer drivers, include printfilterpipelinesvc.exe
in the Applications list.
- Did the debugger contain an AppVerifier message?
AppVerifier writes information to the debugger console after it detects an error but before it stops the program in the debugger. If no AppVerifier information appears in the debugger, there is still a problem to investigate; it is not merely a problem that
AppVerifier found.
The following example shows an AppVerifier stop. The content of this message is determined by the nature of the problem that AppVerifier detected. AppVerifier help contains more detailed information about the Verifier Stop codes:
===========================================================
VERIFIER STOP 0000060F: pid 0xA20: unexpected exception raised while probing memory
C0000005 : Exception code.
0013E868 : Exception record. Use .exr to display it.
0013E884 : Context record. Use .cxr to display it.
134AB000 : Memory address
This verifier stop is continuable.
After debugging it use ‘go’ to continue.
Break instruction exception — code 80000003 (first chance)
ntdll!DbgBreakPoint:
77eaf2bc cc int 3
Create a Dump File
The first step in the debugging session is to preserve the context of the system and the program at the time it broke into the debugger. A user minidump file contains the available memory address space and records this information so that another person
can analyze the problem after the system has been restarted. The dump file lets the problem be researched further at a later time and on a different machine, if necessary.
Saving the dump file by using the .dump command and selecting a descriptive file name for the dump file. Using the /ma option in the dump command line creates a minidump that contains memory data, handle data, unloaded module information, basic memory information,
and thread time information. The following example illustrates a dump command that creates an output file:
c:3_24_2004_11h_am.DMP.
The file name in this example was chosen to indicate the date and time that the dump file was created:
0:001> .dump /ma c:3_24_2004_11h_am.DMP
Creating c:3_24_2004_11h_am.DMP — mini user dump
Dump successfully written
0:001>
This log file contains the minimum information that you need to collect for a Microsoft Product Support engineer to analyze the problem. In some cases, you might also want to add the /ba option to the dump command to save the symbols and the image files
along with the dump file in a .cab file. This creates a larger and more complete file that contains all the information that is necessary to analyze the problem on a machine that does not have access to the symbols. The following example illustrates this option
added to the command that was used in the previous example:
0:001> .dump /ma /ba c:3_24_2004_11h_am.DMP
Creating c:3_24_2004_11h_am.CAB — mini user dump
Dump successfully written
0:001>
Once the dump files have been generated, send them to Microsoft Product Support for analysis.
↑
Back to top
Troubleshooting Windows Server 2012 Printing Features
Troubleshooting Branch Office Direct Printing
Branch Office Direct Printing can only be enabled by an administrator and it must be configured on the Server print queue. There is no way to configure Branch Office Direct Printing from a client.
If BODP is enabled on a print queue, the following registry key will be set:
HKLMSystemCurrentControlSetControlPrintPrinters<Printer>PrinterDriverData
VALUE: EnableBranchOfficePrinting
TYPE: REG_DWORD
A value of 1 indicates enabled and if the value does not exist or is set to 0 then BODP is disabled.
The Print Management Console will show that BODP is enabled on a queue when accessing the properties of a Printer. If
Disable Branch Office Direct Printing is displayed then BODP is ENABLED:
Figure 35: Branch Office Direct Printing Enabled
Additionally, as noted in the Architecture section above, Branch Office Direct Printing is disabled if any of the following conditions are true:
- The enhanced point and print driver is used on the print queue
- The driver in use does not support Client Side Rendering
- The port used on the server is not a Standard TCP/IP port or WSD Port
- An administrator has manually enabled Server Side Rendering on the queue by disabling Client Side Rendering
- The keep printed jobs setting is enabled on the queue
- Printer pooling is enabled on the given queue
For more information about Branch Office Direct Printing, see
Branch Office Direct Printing technical details (http://technet.microsoft.com/library/jj134152).
Event Log Information
For information about Print events logged in the Event Log, an article will be posted in the TechNet Wiki in the near future.
В момент критического сбоя операционная система Windows прерывает работу и показывает синий экран смерти (BSOD). Содержимое оперативной памяти и вся информация о возникшей ошибке записывается в файл подкачки. При следующей загрузке Windows создается аварийный дамп c отладочной информацией на основе сохраненных данных. В системном журнале событий создается запись о критической ошибке.
Внимание! Аварийный дамп не создается, если отказала дисковая подсистема или критическая ошибка возникла на начальной стадии загрузки Windows.
Содержание:
- Типы аварийных дампов памяти Windows
- Как включить создание дампа памяти в Windows?
- Установка WinDBG в Windows
- Настройка ассоциации .dmp файлов с WinDBG
- Настройка сервера отладочных символов в WinDBG
- Анализ аварийного дампа памяти в WinDBG
Типы аварийных дампов памяти Windows
На примере актуальной операционной системы Windows 10 (Windows Server 2016) рассмотрим основные типы дампов памяти, которые может создавать система:
- Мини дамп памяти (Small memory dump) (256 КБ). Этот тип файла включает минимальный объем информации. Он содержит только сообщение об ошибке BSOD, информацию о драйверах, процессах, которые были активны в момент сбоя, а также какой процесс или поток ядра вызвал сбой.
- Дамп памяти ядра (Kernel memory dump). Как правило, небольшой по размеру — одна треть объема физической памяти. Дамп памяти ядра является более подробным, чем мини дамп. Он содержит информацию о драйверах и программах в режиме ядра, включает память, выделенную ядру Windows и аппаратному уровню абстракции (HAL), а также память, выделенную драйверам и другим программам в режиме ядра.
- Полный дамп памяти (Complete memory dump). Самый большой по объему и требует памяти, равной оперативной памяти вашей системы плюс 1MB, необходимый Windows для создания этого файла.
- Автоматический дамп памяти (Automatic memory dump). Соответствует дампу памяти ядра с точки зрения информации. Отличается только тем, сколько места он использует для создания файла дампа. Этот тип файлов не существовал в Windows 7. Он был добавлен в Windows 8.
- Активный дамп памяти (Active memory dump). Этот тип отсеивает элементы, которые не могут определить причину сбоя системы. Это было добавлено в Windows 10 и особенно полезно, если вы используете виртуальную машину, или если ваша система является хостом Hyper-V.
Как включить создание дампа памяти в Windows?
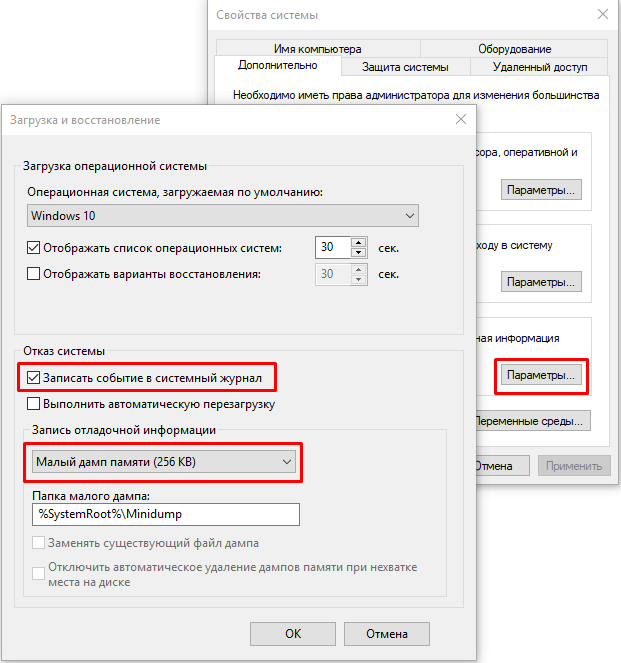
С помощью Win+Pause откройте окно с параметрами системы, выберите «Дополнительные параметры системы» (Advanced system settings). Во вкладке «Дополнительно» (Advanced), раздел «Загрузка и восстановление» (Startup and Recovery) нажмите кнопку «Параметры» (Settings). В открывшемся окне настройте действия при отказе системы. Поставьте галку в чек-боксе «Записать события в системный журнал» (Write an event to the system log), выберите тип дампа, который должен создаваться при сбое системы. Если в чек-боксе «Заменять существующий файл дампа» (Overwrite any existing file) поставить галку, то файл будет перезаписываться при каждом сбое. Лучше эту галку снять, тогда у вас будет больше информации для анализа. Отключите также автоматическую перезагрузку системы (Automatically restart).
В большинстве случаев для анализа причины BSOD вам будет достаточно малого дампа памяти.
Теперь при возникновении BSOD вы сможете проанализировать файл дампа и найти причину сбоев. Мини дамп по умолчанию сохраняется в папке %systemroot%minidump. Для анализа файла дампа рекомендую воспользоваться программой WinDBG (Microsoft Kernel Debugger).
Установка WinDBG в Windows
Утилита WinDBG входит в «Пакет SDK для Windows 10» (Windows 10 SDK). Скачать можно здесь.
Файл называется winsdksetup.exe, размер 1,3 МБ.
WinDBG для Windows7 и более ранних систем включен в состав пакета «Microsoft Windows SDK for Windows 7 and .NET Framework 4». Скачать можно здесь.
Запустите установку и выберите, что именно нужно сделать – установить пакет на этот компьютер или загрузить для установки на другие компьютеры. Установим пакет на локальный компьютер.
Можете установить весь пакет, но для установки только инструмента отладки выберите Debugging Tools for Windows.
После установки ярлыки WinDBG можно найти в стартовом меню.
Настройка ассоциации .dmp файлов с WinDBG
Для того, чтобы открывать файлы дампов простым кликом, сопоставьте расширение .dmp с утилитой WinDBG.
- Откройте командную строку от имени администратора и выполните команды для 64-разрядной системы:
cd C:Program Files (x86)Windows Kits10Debuggersx64
windbg.exe –IA
для 32-разрядной системы:
C:Program Files (x86)Windows Kits10Debuggersx86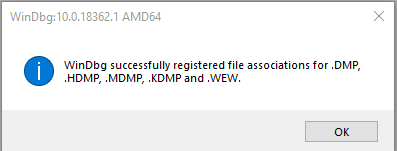
windbg.exe –IA - В результате типы файлов: .DMP, .HDMP, .MDMP, .KDMP, .WEW – будут сопоставлены с WinDBG.
Настройка сервера отладочных символов в WinDBG
Отладочные символы (debug-символы или symbol files) – это блоки данных, генерируемые в процессе компиляции программы совместно с исполняемым файлом. В таких блоках данных содержится информация о именах переменных, вызываемых функциях, библиотеках и т.д. Эти данные не нужны при выполнении программы, но полезные при ее отладке. Компоненты Microsoft компилируются с символами, распространяемыми через Microsoft Symbol Server.
Настройте WinDBG на использование Microsoft Symbol Server:
- Откройте WinDBG;
- Перейдите в меню File –> Symbol File Path;
- Пропишите строку, содержащую URL для загрузки символов отладки с сайта Microsoft и папку для сохранения кэша:
SRV*E:Sym_WinDBG*http://msdl.microsoft.com/download/symbols
В примере кэш загружается в папку E:Sym_WinDBG, можете указать любую. - Не забывайте сохранить изменения в меню File –> Save WorkSpace;
WinDBG произведет поиск символов в локальной папке и, если не обнаружит в ней необходимых символов, то самостоятельно загрузит символы с указанного сайта. Если вы хотите добавить собственную папку с символами, то можно сделать это так:
SRV*E:Sym_WinDBG*http://msdl.microsoft.com/download/symbols;c:Symbols
Если подключение к интернету отсутствует, то загрузите предварительно пакет символов с ресурса Windows Symbol Packages.
Анализ аварийного дампа памяти в WinDBG
Отладчик WinDBG открывает файл дампа и загружает необходимые символы для отладки из локальной папки или из интернета. Во время этого процесса вы не можете использовать WinDBG. Внизу окна (в командной строке отладчика) появляется надпись Debugee not connected.
Команды вводятся в командную строку, расположенную внизу окна.
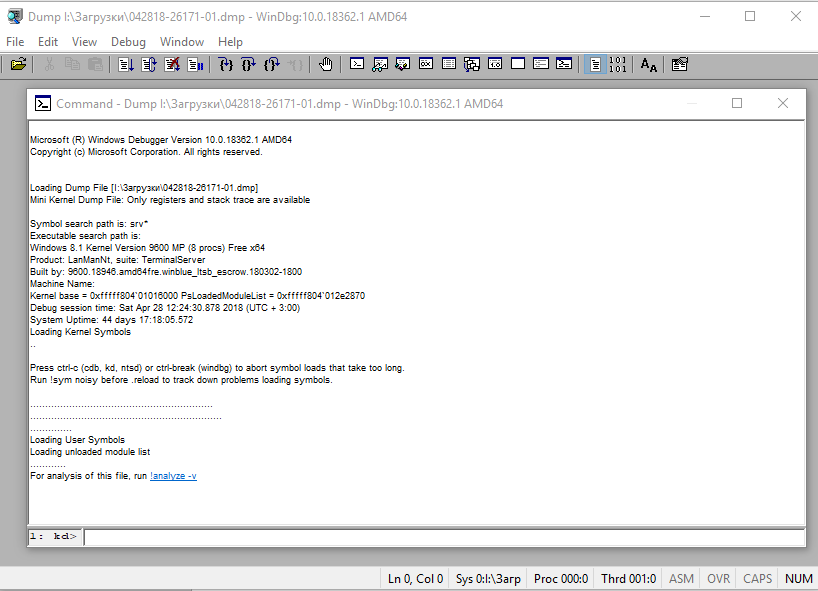
Самое главное, на что нужно обратить внимание – это код ошибки, который всегда указывается в шестнадцатеричном значении и имеет вид 0xXXXXXXXX (указываются в одном из вариантов — STOP: 0x0000007B, 02.07.2019 0008F, 0x8F). В нашем примере код ошибки 0х139.
Полный справочник ошибок можно посмотреть здесь.
Отладчик предлагает выполнить команду !analyze -v, достаточно навести указатель мыши на ссылку и кликнуть. Для чего нужна эта команда?
- Она выполняет предварительный анализ дампа памяти и предоставляет подробную информацию для начала анализа.
- Эта команда отобразит STOP-код и символическое имя ошибки.
- Она показывает стек вызовов команд, которые привели к аварийному завершению.
- Кроме того, здесь отображаются неисправности IP-адреса, процессов и регистров.
- Команда может предоставить готовые рекомендации по решению проблемы.
Основные моменты, на которые вы должны обратить внимание при анализе после выполнения команды !analyze –v (листинг неполный).
1: kd>
!analyze -v
*****************************************************************************
* *
* Bugcheck Analysis *
* *
*****************************************************************************
Символическое имя STOP-ошибки (BugCheck)
KERNEL_SECURITY_CHECK_FAILURE (139)
Описание ошибки (Компонент ядра повредил критическую структуру данных. Это повреждение потенциально может позволить злоумышленнику получить контроль над этой машиной):
A kernel component has corrupted a critical data structure. The corruption could potentially allow a malicious user to gain control of this machine.
Аргументы ошибки:
Arguments:
Arg1: 0000000000000003, A LIST_ENTRY has been corrupted (i.e. double remove).
Arg2: ffffd0003a20d5d0, Address of the trap frame for the exception that caused the bugcheck
Arg3: ffffd0003a20d528, Address of the exception record for the exception that caused the bugcheck
Arg4: 0000000000000000, Reserved
Debugging Details:
------------------
Счетчик показывает сколько раз система упала с аналогичной ошибкой:
CUSTOMER_CRASH_COUNT: 1
Основная категория текущего сбоя:
DEFAULT_BUCKET_ID: FAIL_FAST_CORRUPT_LIST_ENTRY
Код STOP-ошибки в сокращенном формате:
BUGCHECK_STR: 0x139
Процесс, во время исполнения которого произошел сбой (не обязательно причина ошибки, просто в момент сбоя в памяти выполнялся этот процесс):
PROCESS_NAME: sqlservr.exe
CURRENT_IRQL: 2
Расшифровка кода ошибки: В этом приложении система обнаружила переполнение буфера стека, что может позволить злоумышленнику получить контроль над этим приложением.
ERROR_CODE: (NTSTATUS) 0xc0000409 - The system detected an overrun of a stack-based buffer in this application. This overrun could potentially allow a malicious user to gain control of this application.
EXCEPTION_CODE: (NTSTATUS) 0xc0000409 - The system detected an overrun of a stack-based buffer in this application. This overrun could potentially allow a malicious user to gain control of this application.
Последний вызов в стеке:
LAST_CONTROL_TRANSFER: from fffff8040117d6a9 to fffff8040116b0a0
Стек вызовов в момент сбоя:
STACK_TEXT:
ffffd000`3a20d2a8 fffff804`0117d6a9 : 00000000`00000139 00000000`00000003 ffffd000`3a20d5d0 ffffd000`3a20d528 : nt!KeBugCheckEx
ffffd000`3a20d2b0 fffff804`0117da50 : ffffe000`f3ab9080 ffffe000`fc37e001 ffffd000`3a20d5d0 fffff804`0116e2a2 : nt!KiBugCheckDispatch+0x69
ffffd000`3a20d3f0 fffff804`0117c150 : 00000000`00000000 00000000`00000000 00000000`00000000 00000000`00000000 : nt!KiFastFailDispatch+0xd0
ffffd000`3a20d5d0 fffff804`01199482 : ffffc000`701ba270 ffffc000`00000001 000000ea`73f68040 fffff804`000006f9 : nt!KiRaiseSecurityCheckFailure+0x3d0
ffffd000`3a20d760 fffff804`014a455d : 00000000`00000001 ffffd000`3a20d941 ffffe000`fcacb000 ffffd000`3a20d951 : nt! ?? ::FNODOBFM::`string'+0x17252
ffffd000`3a20d8c0 fffff804`013a34ac : 00000000`00000004 00000000`00000000 ffffd000`3a20d9d8 ffffe001`0a34c600 : nt!IopSynchronousServiceTail+0x379
ffffd000`3a20d990 fffff804`0117d313 : ffffffff`fffffffe 00000000`00000000 00000000`00000000 000000eb`a0cf1380 : nt!NtWriteFile+0x694
ffffd000`3a20da90 00007ffb`475307da : 00000000`00000000 00000000`00000000 00000000`00000000 00000000`00000000 : nt!KiSystemServiceCopyEnd+0x13
000000ee`f25ed2b8 00000000`00000000 : 00000000`00000000 00000000`00000000 00000000`00000000 00000000`00000000 : 0x00007ffb`475307da
Участок кода, где возникла ошибка:
FOLLOWUP_IP:
nt!KiFastFailDispatch+d0
fffff804`0117da50 c644242000 mov byte ptr [rsp+20h],0
FAULT_INSTR_CODE: 202444c6
SYMBOL_STACK_INDEX: 2
SYMBOL_NAME: nt!KiFastFailDispatch+d0
FOLLOWUP_NAME: MachineOwner
Имя модуля в таблице объектов ядра. Если анализатору удалось обнаружить проблемный драйвер, имя отображается в полях MODULE_NAME и IMAGE_NAME:
MODULE_NAME: nt
IMAGE_NAME: ntkrnlmp.exe
Если кликнете по ссылке модуля (nt), то увидите подробную информацию о пути и других свойствах модуля. Находите указанный файл, и изучаете его свойства.
1: kd>
lmvm nt
Browse full module list
Loaded symbol image file: ntkrnlmp.exe
Mapped memory image file: C:ProgramDatadbgsymntoskrnl.exe5A9A2147787000ntoskrnl.exe
Image path: ntkrnlmp.exe
Image name: ntkrnlmp.exe
InternalName: ntkrnlmp.exe
OriginalFilename: ntkrnlmp.exe
ProductVersion: 6.3.9600.18946
FileVersion: 6.3.9600.18946 (winblue_ltsb_escrow.180302-1800)
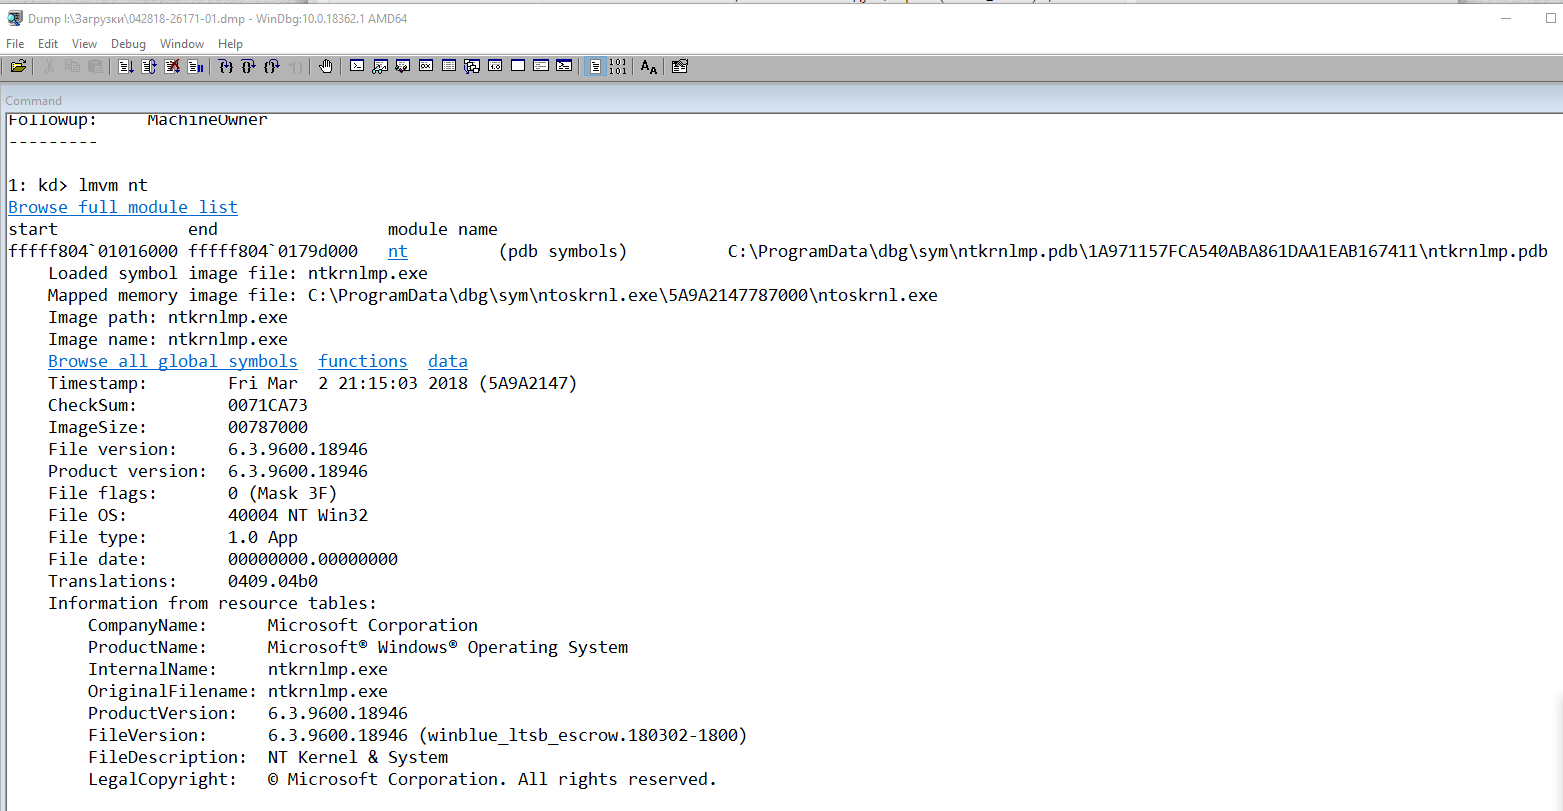
В приведенном примере анализ указал на файл ядра ntkrnlmp.exe. Когда анализ дампа памяти указывает на системный драйвер (например, win32k.sys) или файл ядра (как в нашем примере ntkrnlmp.exe), вероятнее всего данный файл не является причиной проблемы. Очень часто оказывается, что проблема кроется в драйвере устройства, настройках BIOS или в неисправности оборудования.
Если вы увидели, что BSOD возник из-за стороннего драйвера, его имя будет указано в значениях MODULE_NAME и IMAGE_NAME.
Например:
Image path: SystemRootsystem32driverscmudaxp.sys
Image name: cmudaxp.sys
Откройте свойсва файла драйвера и проверьте его версию. В большинстве случаев проблема с драйверами решается их обнвовлением.
Debugging Tools for Windows — Инструменты отладки кода операционных систем Windows. Представляют собой набор свободно распространяемых программ от Microsoft, предназначенных для отладки кода пользовательского режима и режима ядра: приложений, драйверов, служб, модулей ядра. В состав инструментария входят отладчики консольного и GUI- режимов, утилиты для работы с символами, файлами, процессами, утилиты для обеспечения удаленной отладки. Инструментарий содержит в себе утилиты, с помощью которых можно находить причины сбоев в различных компонентах системы. Debugging Tools for Windows с определенного момента недоступны для скачивания в форме автономного дистрибутива и входят в состав Windows SDK (Windows Software Development Kit). Набор инструментальных средств Windows SDK, в свою очередь, доступен в виде части программы подписки MSDN или же может быть свободно загружен в качестве отдельного дистрибутива с сайта msdn.microsoft.com. По заявлению разработчиков, последняя и самая актуальная версия Debugging Tools for Windows содержится именно в Windows SDK.
Debugging Tools for Windows обновляются и выкладываются в публичный доступ достаточно часто и процесс этот никак не зависит от выпуска операционных систем. Поэтому, периодически проверяйте наличие новых версий.
Давайте теперь посмотрим, что же, в частности, позволяют нам средства Debugging Tools for Microsoft Windows:
- Отлаживать локальные приложения, службы (сервисы), драйвера и ядро;
- Отлаживать по сети удаленные приложения, службы (сервисы), драйвера и ядро;
- Отлаживать работающие приложения в режиме реального времени;
- Анализировать файлы дампов памяти приложений, ядра и системы в целом;
- Работать с системами на базе архитектур x86/x64/Itanium;
- Отлаживать программы пользовательского режима и режима ядра;
Доступны следующие версии Debugging Tools for Windows: 32-bit x86, Intel Itanium, 64-bit x64. Нам потребуются две из них: x86 либо x64.
Доступны несколько способов установки Debugging Tools for Windows, в данной же статье мы будем рассматривать лишь основные из них:
- Установка посредством web-инсталлятора.
- Установка Debugging Tools for Windows с ISO-образа Windows SDK.
- Установка Debugging Tools for Windows непосредственно из пакетов dbg_amd64.msi/dbg_x86.msi.
Остается неясен еще во какой момент, зачем мне инсталлировать отладочный инструментарий на компьютер? Зачастую ведь сталкиваешься с ситуацией, когда вмешательство в рабочую среду крайне нежелательно! И уж тем более что инсталляция нового продукта, то есть внесение изменений в реестр/файлы системы, может быть совершенно недопустима. Примерами могут служить критически-важные сервера. Почему бы разработчикам не продумать вариант с портабельными (portable) версиями приложений, не требующих установки?
От версии к версии процесс установки пакета Debugging Tools for Windows претерпевает некоторые изменения. Давайте теперь перейдем непосредственно к процессу установки и рассмотрим способы, которыми можно установить инструментарий.
Установка Debugging Tools for Windows при помощи web-инсталлятора
Переходим на страницу Архив Windows SDK и находим раздел под названием Windows 10 и ниже пункт «Windows 10 SDK (10586) и эмулятор устройства с Windows 10 Mobile (Майкрософт) (версия 10586.11)».

Щелкаем по пункту УСТАНОВИТЬ ПАКЕТ SDK. После щелчка скачиваем и запускаем файл sdksetup.exe, который и инициирует процесс онлайн-установки Windows SDK. На начальном этапе инсталятор проверит наличие в системе установленного пакета .NET Framework последней версии (в данный момент это 4.5). Если пакет отсутствует, что будет предложена установка и по окончании выполнена перезагрузка станции. Сразу после перезагрузки, на этапе авторизации пользователя, стартует процесс инсталляции уже непосредственно Windows SDK.

Зачастую, при выборе всех без исключения компонентов пакета, в процессе установки могут возникнуть ошибки. В этом случае рекомендуется устанавливать компоненты выборочно, минимально необходимый набор.
После завершения инсталляции Debugging Tools for Windows расположение файлов отладки при данном методе инсталляции у нас будет следующим:
- 64-битные версии: C:Program Files (x86)Windows Kitsx.xDebuggersx64
- 32-битные версии: C:Program Files (x86)Windows Kitsx.xDebuggersx86
* где x.x — определенная версия комплекта разработки;
Заметили, что версии 8 и выше, пути инсталляции заметно отличаются от классических для всех предыдущих версий средств отладки?
Огромным плюсом данного способа установки Debigging Tools for Windows является установка версий отладочных средств сразу всех архитектур.
Установка Debugging Tools for Windows с ISO-образа Windows SDK
Данный метод подразумевает установку Debugging Tools for Windows с использованием полного инсталляционного образа Windows SDK (Software Developers Kit). До определенного времени, скачать образ ISO для соответствующей системы можно было на странице Архив Windows SDK. Однако, в данный момент, получить ISO-образ SDK можно через запуск web-инсталлятора sdksetup.exe, и выбора пункта Download the Windows Software Development Kit в стартовом окне инсталлятора:
Как было выяснено, предыдущий метод установки при помощи веб-инсталлятора достаточно капризен и зачастую завершается ошибкой. На чистых системах устанавливается без проблем, однако на достаточно уже нагруженных возникают многочисленные проблемы. Если у Вас именно такой случай, то воспользуйтесь данным методом.
Соответственно, на странице необходимо подобрать требуемый дистрибутив, для меня (да и думаю для многих) в данный момент это «Пакет Windows SDK для Windows 7 и .NET Framework 4» и чуть ниже нажать на ссылку «Получить ISO-образ DVD-диска».
При работе с сайтом msdn.microsoft.com советую воспользоваться браузером Internet Explorer, поскольку были замечены случаи неработоспособности конкурирующих продуктов!
Далее у нас имеется выбор между тремя вариантами образа:
| Имя | Назначение |
|---|---|
| GRMSDK_EN_DVD.iso | Образ SDK для систем с архитектурой x86 (32-битных). |
| GRMSDKIAI_EN_DVD.iso | Образ SDK для систем с архитектурой ia64. |
| GRMSDKX_EN_DVD.iso | Образ SDK для систем с архитектурой x64 (64-битных). |
Соответственно, необходимо выбрать исключительно по необходимости. Обычно разрядность Debugging Tools for Windows совпадает с разрядностью системы. У меня исследуемые системы, в основном, 64-битные, поэтому я в большинстве случаев скачиваю образ для 64-битной системы GRMSDKX_EN_DVD.iso.
Затем, после скачивания образа, нам необходимо с имеющимся ISO-образом как-то работать. Традиционным способом является, конечно же, запись компакт-диска, но ведь это достаточно долгий и иногда затратный метод. Предлагаю воспользоваться бесплатными утилитами по созданию в системе виртуальных дисковых устройств. Лично я для этой цели предпочитаю пользоваться программой DEAMON Tools Lite. У кого-то могут быть и другие предпочтения, более прямые или легковесные утилиты, на вкус и цвет, как говорится.. После инсталляции DAEMON Tools Lite, я просто щелкаю два раза на файл образа GRMSDKX_EN_DVD.iso и в системе у меня появляется новый виртуальный компакт диск:

Уже затем двойным щелчком активирую автозагрузку и запускаю инсталляцию Windows SDK:

Когда подходит очередь выбирать устанавливаемые компоненты из списка, то отключаем абсолютно все опции кроме помеченных на скриншоте. Это поможет избежать ненужных нам сейчас ошибок.

Все именно так, на скриншоте отмечено две опции: «Windows Performance Toolkit» и «Debugging Tools for Windows». Выбирайте обе, потому как Windows Performance Toolkit Вам непременно пригодится в работе! Далее, после нажатия кнопки «Next» инсталляция продолжается в обычном режиме. И в конце вы увидите надпись «Installation Complete».
По окончании инсталляции рабочие директории комплекта Debugging Tools for Windows будут следующими:
- Для версии x86: C:Program Files (x86)Debugging Tools for Windows (x86)
- Для версии x64: C:Program FilesDebugging Tools for Windows (x64)
На этом установку Debugging Tools for Windows можно считать оконченной.
Установка Debugging Tools for Windows через .msi файл
В случае возникновения проблем при инсталляции Debugging Tools for Windows двумя предыдущими способами, у нас в запасе остается еще один, самый надежный и проверенный временем, выручавший, так сказать, не раз. Когда-то, до интеграции в Windows SDK, Debugging Tools for Windows были доступны в виде отдельного инсталлятора .msi, который и сейчас можно найти, однако уже в недрах дистрибутива Windows SDK. Поскольку у нас на руках имеется уже ISO-образ Windows SDK, то мы можем не монтировать его в систему, а просто открыть при помощи всем уже хорошо знакомого архиватора WinRAR, ну или любого другого продукта, работающего с содержимым ISO-дисков.

После открытия образа нам необходимо пройти в каталог «Setup», находящийся в корне и далее выбрать одну из директорий:
- Для установки 64-битной версии: SetupWinSDKDebuggingTools_amd64 и распаковать из этого каталога файл
dbg_amd64.msi. - Для установка 32-битной версии: SetupWinSDKDebuggingTools и распаковать из этого каталога файл
dbg_x86.msi.
Далее, запускаем распакованный только что .msi файл и стартуем установку Debugging Tools for Windows.

По окончании инсталляции рабочие директории комплекта Debugging Tools for Windows будут следующими:
- Для версии x86: C:Program Files (x86)Debugging Tools for Windows (x86)
- Для версии x64: C:Program FilesDebugging Tools for Windows (x64)
На этом установку Debugging Tools for Windows можно считать выполненной.
Дополнительные сведения
Не знаю с чем это связано, быть может с моей невнимательностью, но после инсталляции Отладочных средств для Windows, инсталлятор не прописывает в системную переменную пути Path путь к каталогу с отладчиком. Это накладывает определенные ограничения на запуск различных отладочных задач напрямую из консоли. Поэтому, в случае отсутствия пути, я самостоятельно прописываю в окне Переменные среды путь к отладочным средствам:
- C:Program Files (x86)Windows Kits10Debuggersx86
- C:Program Files (x86)Windows Kits10Debuggersx64
* В вашем случае пути могут отличаться как по причине использования ОС другой разрядности, так и по причине использования SDK другой версии.
Утилиты пакета Debugging Tools for Windows могут работать в качестве переносных приложений, достаточно просто скопировать с рабочей системы каталог Microsoft Windows Performance Toolkit и использовать его в качестве портабельной версии на рабочем сервере. Но не забывайте учитывать разрядность системы!! Если Вы даже произвели полную инсталляцию пакета на критически-важную систему, то работать можно начинать прямо после инсталляции, перезагрузка не требуется.
Состав Debugging Tools for Windows
И теперь напоследок приведем состав Debugging Tools for Windows:
| Файл | Назначение |
|---|---|
| adplus.doc | Документация по утилите ADPlus. |
| adplus.exe | Консольное приложение, которое автоматизирует работу отладчика cdb для создания дампов, лог-файлов для одного или нескольких процессов. |
| agestore.exe | Утилита для удаления устаревших файлов из хранилища, используемого сервером символов или сервером исходников. |
| breakin.exe | Утилита, которая позволяет посылать процессам комбинацию пользовательского останова (break), аналогичное нажатию CTRL+C. |
| cdb.exe | Консольный отладчик пользовательского режима. |
| convertstore.exe | Утилита для конвертирования символов из уровня 2-tier в уровень 3-tier. |
| dbengprx.exe | Рипитер (прокси сервер) для удаленной отладки. |
| dbgrpc.exe | Утилита для отображения информации о состоянии вызова RPC. |
| dbgsrv.exe | Процесс сервера, используемый для удаленной отладки. |
| dbh.exe | Утилита для вывода информации о содержимом файла символов. |
| dumpchk.exe | Утилита проверки дампа. Утилита для быстрой проверки дамп-файла. |
| dumpexam.exe | Утилита для анализа дампа памяти. Результат выводится в %SystemRoot%MEMORY.TXT. |
| gflags.exe | Редактор глобальных флагов системы. Утилита управляет ключами реестра и другими настройками. |
| i386kd.exe | Обертка к kd. Когда то так назывался kd для систем на базе Windows NT/2000 для x86 машин? Вероятно, оставлено из соображений совместимости. |
| ia64kd.exe | Обертка к kd. Когда то так назывался kd для систем на базе Windows NT/2000 для ia64 машин? Вероятно, оставлено из соображений совместимости. |
| kd.exe | Консольный отладчик режима ядра. |
| kdbgctrl.exe | Инструмент управления отладки ядра. Утилита для управление и конфигурирования kernel debugging connection. |
| kdsrv.exe | Сервер соединений для KD. Утилита представляет собой небольшое приложений, которое запускается и ждет удаленных соединений. kd запускается на клиенте и подсоединяется к этому серверу для удаленной отладки. И сервер и клиент должны быть из одной сборки Debugging Tools. |
| kill.exe | Утилита для завершения процессов. |
| list.exe | Утилита для вывода содержимого файла на экран. В комплекте эта миниатюрная утилита оказалась с одной целью — просмотр больших текстовых или лог-файлов. Занимает немного места в памяти, поскольку грузит текст частями. |
| logger.exe | Миниатюрный отладчик, который может работать только с одним процессом. Утилита внедряет logexts.dll в пространство процесса, которая записывает все вызовы функций и другие действия исследуемой программы. |
| logviewer.exe | Утилита для просмотра логов, записанных отладчиком logger.exe. |
| ntsd.exe | Microsoft NT Symbolic Debugger (NTSD). Отладчик, идентичный cdb, за исключением того, что он создает текстовое окно при запуске. Как и cdb, ntsd способен отлаживать и консольные приложения и графические приложения. |
| pdbcopy.exe | Утилита для удаления приватных символов из файла символов, контроля за публичными символами, включенными в файл символов. |
| remote.exe | Утилита для удаленной отладки и удаленного контроля любого консольного отладчика KD, CDB и NTSD. Позволяет запускать все эти консольные отладчики удаленно. |
| rtlist.exe | Удаленный просмотрщик задач. Утилита используется для вывода списка запущенных процессов через процесс сервера DbgSrv. |
| symchk.exe | Утилита для загрузки символов с сервера символов Microsoft и создания локального кеша символов. |
| symstore.exe | Утилита для создания сетевого или локального хранилища символов (2-tier/3-tier). Хранилище символов — специализированная директория на диске, которая строится в соответствии с определенной структурой и содержит символы. В корневой директории символов создается структура подпапок с названиями, идентичными названию компонентов. В свою очередь, в каждой из этих подпапок находятся вложенные подпапки, имеющие специальные наименования, получаемые методом хеширования бинарных файлов. Утилита symstore сканирует папки с компонентами и добавляет новые компоненты в хранилище символов, откуда их может получить любой клиент. Говорится что symstore служит для получения символов из хранилища уровня 0-tier и выкладывания их в хранилище уровня 2-tier/3-tier. |
| tlist.exe | Просмотрщик задач. Утилита для вывода списка всех запущенных процессов. |
| umdh.exe | User-mode dump heap utility. Утилита для анализа куч (heap) выбранного процесса. Позволяет выводить различные параметры для кучи. |
| usbview.exe | Просмотрщик USB. Утилита для просмотра USB устройств, подключенных к компьютеру. |
| vmdemux.exe | Демультиплексор виртуальной машины. Для одного COM-соединения создает несколько именованных каналов. Каналы используются для отладки различных компонентов виртуальной машины |
| windbg.exe | Отладчик режима пользователя и режима ядра с графическим интерфейсом. |
![]() Это маленькая заметка о том, какие шаги необходимо выполнить для получения первичной информации об исполняемом файле, ставшем возможной причиной остановки работы операционной системы Windows — Blue Screen of Death (BSOD). По умолчанию ОС Windows настроена таким образом, что при возникновении ошибки приводящей к полной остановке работы системы, автоматически создаётся аварийный дамп памяти в виде файла MEMORY.DMP. Чтобы получить доступ к информации из этого файла, нам потребуется набор отладочных утилит Debugging tools for Windows из состава Windows Software Development Kit.
Это маленькая заметка о том, какие шаги необходимо выполнить для получения первичной информации об исполняемом файле, ставшем возможной причиной остановки работы операционной системы Windows — Blue Screen of Death (BSOD). По умолчанию ОС Windows настроена таким образом, что при возникновении ошибки приводящей к полной остановке работы системы, автоматически создаётся аварийный дамп памяти в виде файла MEMORY.DMP. Чтобы получить доступ к информации из этого файла, нам потребуется набор отладочных утилит Debugging tools for Windows из состава Windows Software Development Kit.
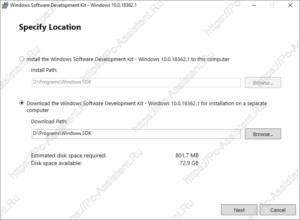
Переходим по ссылке WDK and WinDbg downloads и скачиваем онлайн-инсталлятор/загрузчик Standalone Debugging Tools for Windows (WinDbg) – файл sdksetup.exe. Запускаем инсталлятор и выбираем вариант установки…

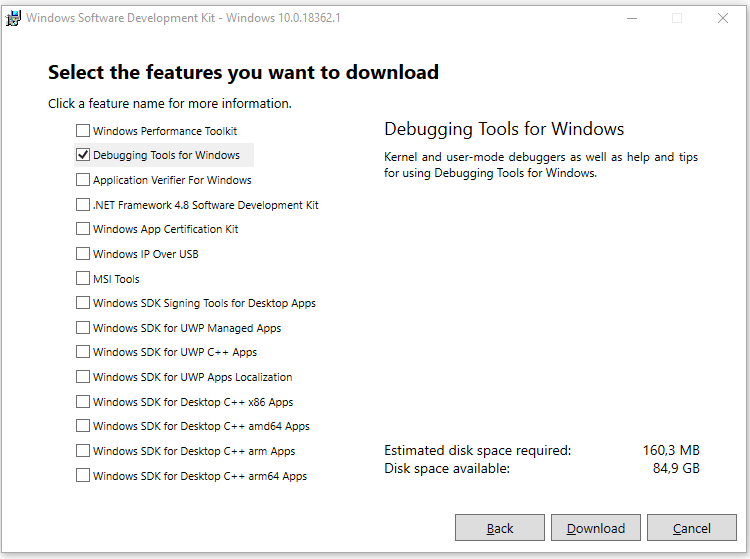
На следующем шаге выбора компонент к установке (Select the features you want to install) отмечаем только то, что нам нужно — Debugging tools for Windows и нажимаем Install

В указанную на первом экране папку из Интернета будет загружен и установлен набор утилит.
После окончания установки находим в меню “Пуск” или на стартовом экране в группе ярлыков Windows Kits утилиту WinDbg и запускаем её с правами администратора

Если по какой-то причине ярлык найти не удалось, то можно запустить исполняемый файл из каталога установки — С:Program Files (x86)Windows Kits8.1Debuggersx64windbg.exe
В главном меню программы WinDbg выбираем пункты File > Symbol File Path. В открывшееся окно вставляем строку определяющую пусть к локальному каталогу символьного кэша и его онлайн-источнику:
SRV*C:Windowssymbol_cache*http://msdl.microsoft.com/download/symbols

Сохраняем настройки, выбрав в главном меню пункты File > Save Workspace
Открываем файл дампа памяти, выбрав в меню File > Open Crash Dump…
Выбираем файл MEMORY.DMP (по умолчанию расположен в каталоге C:Windows) и нажимаем Open

Появится информация о том, какой именно исполняемый модуль стал причиной остановки работы системы. Щёлкнув по гиперссылке !analyze-v можно получить более развернутую информацию о состоянии системы на момент возникновения стоп-ошибки.
Туже самую информацию можно получить и с помощью командной строки используя примерно следующую последовательность команд:
cd /d "C:Program Files (x86)Windows Kits8.1Debuggersx64"
kd -z "D:DOWNLOADSVM05MEMORY.DMP"
.logopen C:Debuglog.txt
.sympath srv*C:Windowssymbol_cache*http://msdl.microsoft.com/download/symbols
В этом примере вся информация о разборе дампа будет выгружена в читаемом виде в файл C:Debuglog.txt
Источники информации:
- KB315263 — Интерпретация содержимого малого дампа памяти, создаваемого Windows для отладки
- Scott Forsyth — Reading a memory.dmp or other .dmp file
Где скачать и как установить Debugging Tools for Windows
Решение написать данный пост появилось из-за того, что разобраться в том, где скачать Debugging Tools for Windows, не так то просто.
Так как следующую статью планируется написать на тему анализа дампов, то необходимо было облегчить для нашего читателя задачу скачивания и установки необходимого для анализа инструментария. В данном случае это только официальный отладчик Debugging Tools for Windows.
Содержание
- 1 Как скачать и установить отладчик WinDbg?
- 1.1 Скачиваем пакет SDK.
- 1.2 Устанавливаем Debugging Tools for Windows из пакета SDK на Windows 10.
Как скачать и установить отладчик WinDbg?
Отладчик Debugging Tools for Windows содержится в пакете SDK (от англ. software development kit). SDK (от англ. software development kit) — набор средств разработки, который позволяет специалистам по программному обеспечению создавать приложения для определённого пакета программ, программного обеспечения базовых средств разработки, аппаратной платформы, компьютерной системы, игровых консолей, операционных систем и прочих платформ.
Источник: WikipediaПри скачивании пакета можно выбрать только нужный вам софт отцепив всё лишнее.
Скачиваем пакет SDK.
Для каждой версии Windows имеется своя версия пакета SDK. Скачать загрузчик для скачивания пакета SDK Windows 10 можно по этой ссылке. Для остальных версий Windows загрузчик можно скачать на странице архивов Microsoft. Самая старая версия ОС здесь — Windows 7.
Про иные способы скачивания пакета можете почитать на этой странице (если конечно владеете английским языком 🙂 )
Устанавливаем Debugging Tools for Windows из пакета SDK на Windows 10.
Нажав на ссылку Скачать программу установки > вы получите файл загрузчика пакета SDK — winsdksetup.exe.
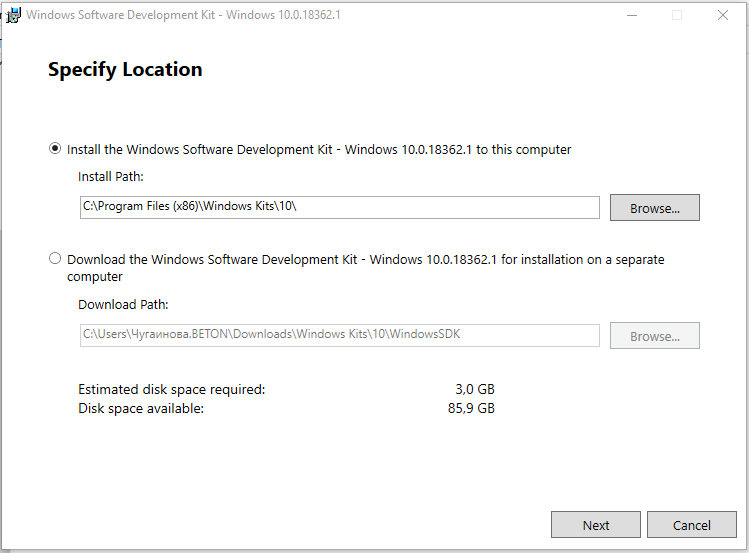
- Запустите файл загрузчика winsdksetup.exe.
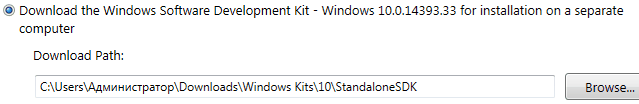
- Загрузчик предложит 2 способа доставки пакета. В первом случае (Install the Windows SDK to this computer — в переводе: Установите Windows SDK на этот компьютер) выбранный софт из пакета SDK сразу устанавливается в систему. Во втором (Download the Windows SDK for installation on a separate computer — в переводе Загрузите Windows SDK для установки на отдельный компьютер) дистрибутивы для установки выбранного софта будут скачаны в указанную вами папку.
 Здесь рекомендую вам выбрать второй вариант, так как скачанный отладчик, можно будет потом установить и на любой другой компьютер. Тут же рекомендую сменить папку куда будет загружен пакет.
 - На следующем шаге вас спросят разрешения отправить анонимную информацию об установке на серверы Microsoft или нет. Здесь выбирать вам
- Далее необходимо выбрать, что вы хотите установить из списка программ. Чтоб не устанавливать лишние программы снимаем все галочки и оставляем только одну Debugging Tools for Windows и жмем кнопку Download.
 Здесь рекомендую вам выбрать второй вариант, так как скачанный отладчик, можно будет потом установить и на любой другой компьютер. Тут же рекомендую сменить папку куда будет загружен пакет.
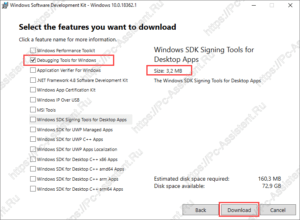
Будет загружена папка Installers, где находим файлы:
► X64 Debuggers And Tools-x86_en-us
► X64 Debuggers And Tools-x64_en-us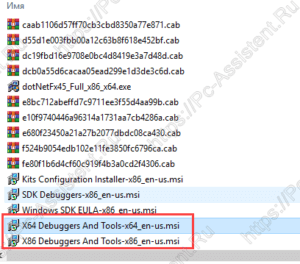
Прежде чем начать установку узнайте разрядность операционной системы и затем уже выберите правильную версию.
Запустив файл установки нужной версии, останется чуток подождать и Debugging Tools for Windows будет установлен. Запустить его можно через кнопку Пуск.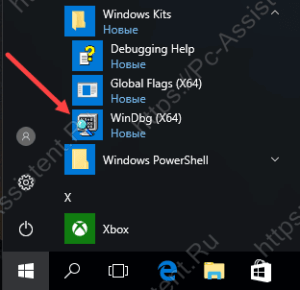
Теперь, когда вы знаете где скачать отладчик, можно смело приступать к анализу файла дампа. Об этом как раз и будет следующая статья на сайте.
Если вам понравилась эта статья, то пожалуйста, оцените её и поделитесь ею со своими друзьями на своей странице в социальной сети.

 (4 оценок, среднее: 4,75 из 5)
![]() Загрузка…
Загрузка…