![]()
When adding hosts with Windows and using the default Template Module Windows services by Zabbix agent template, we get a lot of notifications from services that we do not need. Below I will show you how to apply a filter that will bypass the detection of these services and our Zabbix will not inform us unnecessarily about problems with these services.
To apply a filter, edit the template by going to Configuration > Templates > Template Module Windows services by Zabbix agent > Discovery Rules > Windows services discovery > Filters
We add macro and write in fields:
- in Label Macro write {#SERVICE.NAME}
- expression does not match
- in Regular expression write list of services excluded from monitoring e.g.
^(BITS|TrustedInstaller|DPS|uhssvc|MMCSS|edgeupdate|clr_optimization_*|WbioSrvc|DusmSvc|WpnUserService_w+|OneSyncSvc_w+)$

Sample filter settings for Windows services discovery
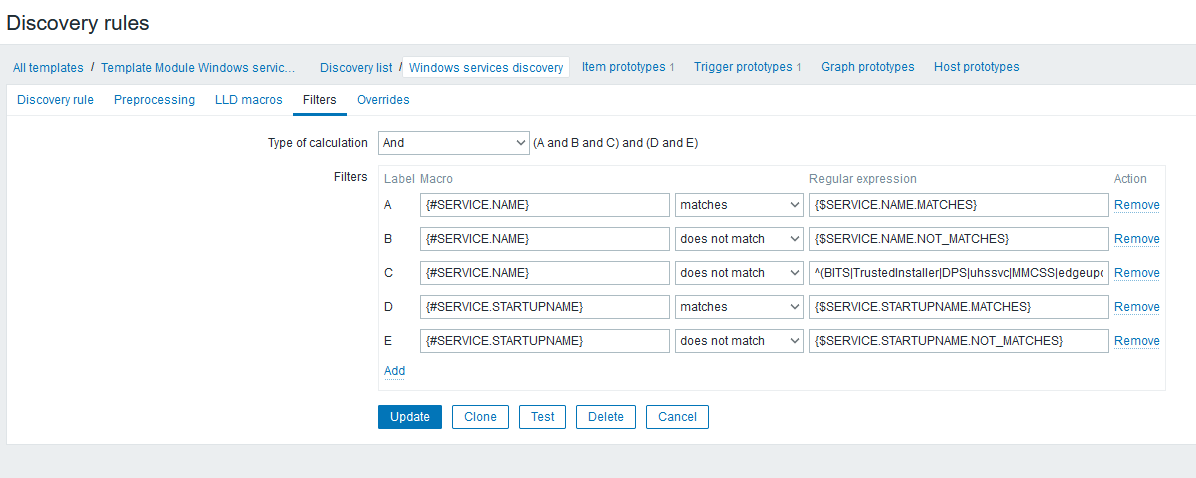
If we want to add further exclusions of services, we add to Regular expression.
If already added hosts report to us notifications from excluded services, you should delete these services in the host configuration or remove and add the monitored host again.
В этой статье мы отключим обнаружение ненужных служб Zabbix, которые после перезагрузки меняют свое название или запускаются по только необходимости.
Ваш Zabbix 5 спамит подобными ошибками?
Service «WpnUser_» (Смарт-карта) is not running (startup type automatic)
Service «OneSync_» (Смарт-карта) is not running (startup type automatic)
Переходим в Настройка — Шаблоны и выбираем Template OS Windows by Zabbix agent.
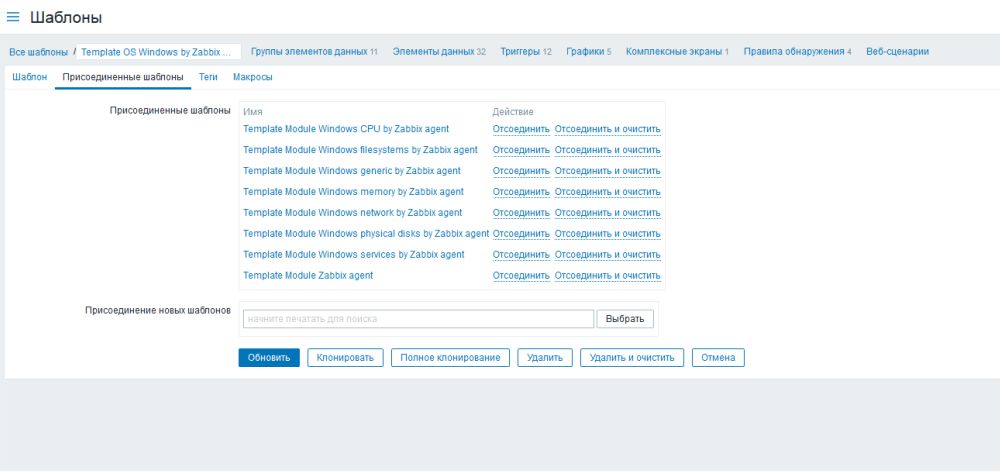
Во вкладке присоединённые шаблоны можно отключить обнаружение служб совсем, отсоединив шаблон «Template Module Windows services by Zabbix agent».
Но мы изменим регулярные выражения, чтобы исключить обнаружение некоторых ненужных нам служб.
Для этого переходим в шаблон «Template Module Windows services by Zabbix agent» и кликаем на вкладку Макросы.
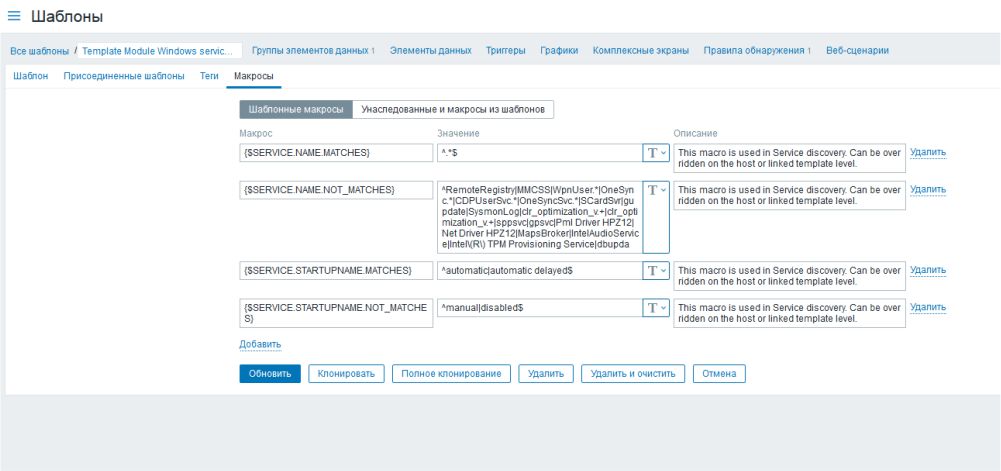
Нам нужно добавить исключения в выражении {$SERVICE.NAME.NOT_MATCHES}
В примере я уберу обнаружение следующих служб:
WpnUser.* служба платформы подключенных пользовательских устройств.
CDPUserSvc.* служба платформы подключенных пользовательских устройств.
OneSyncSvc.* служба синхронизации некоторых узлов Windows.
SCardSvr служба позволяет компьютеру считывать смарт-карты.
Оригинальное регулярное выражение было таким:
^RemoteRegistry|MMCSS|gupdate|SysmonLog|clr_optimization_v.+|clr_optimization_v.+|sppsvc|gpsvc|Pml Driver HPZ12|Net Driver HPZ12|MapsBroker|IntelAudioService|Intel(R) TPM Provisioning Service|dbupdate|DoSvc$
С внесенными исключениями:
^RemoteRegistry|MMCSS|WpnUser.|CDPUserSvc.|OneSyncSvc.|SCardSvr|gupdate|SysmonLog|clr_optimization_v.+|clr_optimization_v.+|sppsvc|gpsvc|Pml Driver HPZ12|Net Driver HPZ12|MapsBroker|IntelAudioService|Intel(R) TPM Provisioning Service|dbupdate|DoSvc$
Теперь удалим узлы сети и добавим заново в нашу систему мониторинга Zabbix, чтобы избавиться от ошибок.
Если узлов много, то можно поменять время сохранения потерянных ресурсов в правилах обнаружения Windows services discovery, например:
Период сохранения потерянных ресурсов: 1h
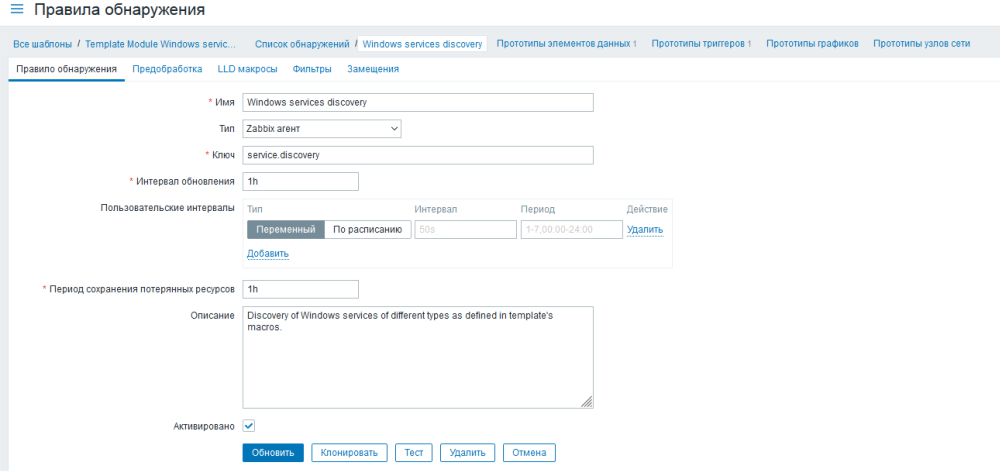
Поддерживаются следующие суффиксы времени: 30s, 1m, 2h, 1d
В более старых версиях Zabbix было достаточно поменять регулярное выражение по пути — Администрирование — Общие — Регулярные выражения:
^(MMCSS|gupdate|SysmonLog|clr_optimization.|DoSvc|sppsvc|MapsBroker|WpnUser.|OneSyncSvc.|gpsvc|BITS|CDPUserSvc.|.KMSELDI|stisvc|UsoSvc|TrustedInstaller|WbioSrvc|tmlisten|ntrts|ntrtscan|CDPSvc|SCardSvr|tiled.)$

Начиная с Windows Server 2016 появились забавные службы, например: Синхронизация узлаNNN, которые после перезагрузки меняли свое название (окончание). Zabbix реагирует на такие изменения сообщениями:
Проблема: Service «OneSyncSvc442d6» (Синхронизация узла442d6) is not running (startup type automatic delayed)
Отключить мониторинг таких служб можно вручную, но после перезагрузки узла мониторинга, ошибка повторится и придется опять ее отключать.
В Zabbix есть настройка регулярных выражений, конкретней нас будет интересовать Windows service names for discovery.
По умолчанию значение Windows service names for discovery:
|
^(MMCSS|gupdate|SysmonLog|clr_optimization_v2.0.50727_32|clr_optimization_v4.0.30319_32)$ |
Обычно проблемы есть у следующих служб:
- MapsBroker
- OneSyncSvc
- BITS
- TrustedInstaller
- WbioSrvc
Получается следующая строчка:
|
^(MMCSS|gupdate|SysmonLog|clr_optimization.*|MapsBroker|OneSync.*|BITS|TrustedInstaller|WbioSrvc)$ |
В случае появления новых служб, их так же можно будет добавить в исключение.
Windows by Zabbix agent active
Overview
New official Windows template. Requires agent of Zabbix 4.4 and newer.
This template has been tested on:
- Windows, version 7 and newer.
- Windows Server, version 2008 R2 and newer.
Requirements
For Zabbix version: 6.4 and higher.
Setup
Install Zabbix agent on Windows OS according to Zabbix documentation.
Configuration
No specific Zabbix configuration is required.
Macros used
| Name | Description | Default |
|---|---|---|
| {$AGENT.NODATA_TIMEOUT} |
No data timeout for active agents. Consider to keep it relatively high. |
30m |
| {$AGENT.TIMEOUT} |
Timeout after which agent is considered unavailable. |
5m |
| {$CPU.INTERRUPT.CRIT.MAX} |
The critical threshold of the % Interrupt Time counter. |
50 |
| {$CPU.PRIV.CRIT.MAX} |
The threshold of the % Privileged Time counter. |
30 |
| {$CPU.QUEUE.CRIT.MAX} |
The threshold of the Processor Queue Length counter. |
3 |
| {$CPU.UTIL.CRIT} |
The critical threshold of the CPU utilization in %. |
90 |
| {$IF.ERRORS.WARN} |
— |
2 |
| {$IF.UTIL.MAX} |
— |
90 |
| {$IFCONTROL} |
— |
1 |
| {$MEM.PAGE_SEC.CRIT.MAX} |
The warning threshold of the Memory Pages/sec counter. |
1000 |
| {$MEM.PAGE_TABLE_CRIT.MIN} |
The warning threshold of the Free System Page Table Entries counter. |
5000 |
| {$MEMORY.UTIL.MAX} |
The warning threshold of the Memory util item. |
90 |
| {$NET.IF.IFALIAS.MATCHES} |
This macro is used in Network interface discovery. Can be overridden on the host or linked template level. |
.* |
| {$NET.IF.IFALIAS.NOT_MATCHES} |
This macro is used in Network interface discovery. Can be overridden on the host or linked template level. |
CHANGE_THIS |
| {$NET.IF.IFDESCR.MATCHES} |
This macro is used in Network interface discovery. Can be overridden on the host or linked template level. |
.* |
| {$NET.IF.IFDESCR.NOT_MATCHES} |
This macro is used in Network interface discovery. Can be overridden on the host or linked template level. |
CHANGE_THIS |
| {$NET.IF.IFNAME.MATCHES} |
This macro is used in Network interface discovery. Can be overridden on the host or linked template level. |
.* |
| {$NET.IF.IFNAME.NOT_MATCHES} |
This macro is used in Network interface discovery. Can be overridden on the host or linked template level. |
`Miniport |
| {$SERVICE.NAME.MATCHES} |
This macro is used in Service discovery. Can be overridden on the host or linked template level. |
^.*$ |
| {$SERVICE.NAME.NOT_MATCHES} |
This macro is used in Service discovery. Can be overridden on the host or linked template level. |
`^(?:RemoteRegistry |
| {$SERVICE.STARTUPNAME.MATCHES} |
This macro is used in Service discovery. Can be overridden on the host or linked template level. |
`^(?:automatic |
| {$SERVICE.STARTUPNAME.NOT_MATCHES} |
This macro is used in Service discovery. Can be overridden on the host or linked template level. |
`^(?:manual |
| {$SWAP.PFREE.MIN.WARN} |
The warning threshold of the minimum free swap. |
20 |
| {$SYSTEM.FUZZYTIME.MAX} |
The threshold for difference of system time in seconds. |
60 |
| {$VFS.DEV.DEVNAME.MATCHES} |
This macro is used in physical disks discovery. Can be overridden on the host or linked template level. |
.* |
| {$VFS.DEV.DEVNAME.NOT_MATCHES} |
This macro is used in physical disks discovery. Can be overridden on the host or linked template level. |
_Total |
| {$VFS.DEV.READ.AWAIT.WARN} |
Disk read average response time (in s) before the trigger would fire. |
0.02 |
| {$VFS.DEV.UTIL.MAX.WARN} |
The warning threshold of disk time utilization in percent. |
95 |
| {$VFS.DEV.WRITE.AWAIT.WARN} |
Disk write average response time (in s) before the trigger would fire. |
0.02 |
| {$VFS.FS.FREE.MIN.CRIT} |
The critical threshold of the filesystem utilization. |
5G |
| {$VFS.FS.FREE.MIN.WARN} |
The warning threshold of the filesystem utilization. |
10G |
| {$VFS.FS.FSDRIVETYPE.MATCHES} |
This macro is used in filesystems discovery. Can be overridden on the host or linked template level. |
fixed |
| {$VFS.FS.FSDRIVETYPE.NOT_MATCHES} |
This macro is used in filesystems discovery. Can be overridden on the host or linked template level. |
^s$ |
| {$VFS.FS.FSNAME.MATCHES} |
This macro is used in filesystems discovery. Can be overridden on the host or linked template level. |
.* |
| {$VFS.FS.FSNAME.NOT_MATCHES} |
This macro is used in filesystems discovery. Can be overridden on the host or linked template level. |
`^(?:/dev |
| {$VFS.FS.FSTYPE.MATCHES} |
This macro is used in filesystems discovery. Can be overridden on the host or linked template level. |
.* |
| {$VFS.FS.FSTYPE.NOT_MATCHES} |
This macro is used in filesystems discovery. Can be overridden on the host or linked template level. |
^s$ |
| {$VFS.FS.PUSED.MAX.CRIT} |
The critical threshold of the filesystem utilization in percent. |
90 |
| {$VFS.FS.PUSED.MAX.WARN} |
The warning threshold of the filesystem utilization in percent. |
80 |
Template links
There are no template links in this template.
Discovery rules
| Name | Description | Type | Key and additional info |
|---|---|---|---|
| Mounted filesystem discovery |
Discovery of file systems of different types. |
DEPENDENT | vfs.fs.dependent.discovery
Filter: AND — {#FSTYPE} MATCHES_REGEX — {#FSTYPE} NOT_MATCHES_REGEX — {#FSNAME} MATCHES_REGEX — {#FSNAME} NOT_MATCHES_REGEX — {#FSDRIVETYPE} MATCHES_REGEX — {#FSDRIVETYPE} NOT_MATCHES_REGEX |
| Network interfaces discovery |
Discovery of installed network interfaces. |
DEPENDENT | net.if.discovery
Preprocessing: — JAVASCRIPT: — DISCARD_UNCHANGED_HEARTBEAT: Filter: AND — {#IFNAME} MATCHES_REGEX — {#IFNAME} NOT_MATCHES_REGEX — {#IFDESCR} MATCHES_REGEX — {#IFDESCR} NOT_MATCHES_REGEX — {#IFALIAS} MATCHES_REGEX — {#IFALIAS} NOT_MATCHES_REGEX |
| Physical disks discovery |
Discovery of installed physical disks. |
ZABBIX_ACTIVE | perf_instance_en.discovery[PhysicalDisk]
Preprocessing: — STR_REPLACE: Filter: AND — {#DEVNAME} MATCHES_REGEX — {#DEVNAME} NOT_MATCHES_REGEX |
| Windows services discovery |
Discovery of Windows services of different types as defined in template’s macros. |
ZABBIX_ACTIVE | service.discovery
Filter: AND — {#SERVICE.NAME} MATCHES_REGEX — {#SERVICE.NAME} NOT_MATCHES_REGEX — {#SERVICE.STARTUPNAME} MATCHES_REGEX — {#SERVICE.STARTUPNAME} NOT_MATCHES_REGEX |
Items collected
| Group | Name | Description | Type | Key and additional info |
|---|---|---|---|---|
| CPU | CPU utilization |
The CPU utilization expressed in %. |
ZABBIX_ACTIVE | system.cpu.util |
| CPU | CPU interrupt time |
The Processor Information% Interrupt Time is the time the processor spends receiving and servicing hardware interrupts during sample intervals. This value is an indirect indicator of the activity of devices that generate interrupts, such as the system clock, the mouse, disk drivers, data communication lines, network interface cards and other peripheral devices. This is an easy way to identify a potential hardware failure. This should never be higher than 20%. |
ZABBIX_ACTIVE | perf_counter_en[«Processor Information(_total)% Interrupt Time»] |
| CPU | Context switches per second |
Context Switches/sec is the combined rate at which all processors on the computer are switched from one thread to another. Context switches occur when a running thread voluntarily relinquishes the processor, is preempted by a higher priority ready thread, or switches between user-mode and privileged (kernel) mode to use an Executive or subsystem service. It is the sum of ThreadContext Switches/sec for all threads running on all processors in the computer and is measured in numbers of switches. There are context switch counters on the System and Thread objects. This counter displays the difference between the values observed in the last two samples, divided by the duration of the sample interval. |
ZABBIX_ACTIVE | perf_counter_en[«SystemContext Switches/sec»] |
| CPU | CPU privileged time |
The Processor Information% Privileged Time counter shows the percent of time that the processor is spent executing in Kernel (or Privileged) mode. Privileged mode includes services interrupts inside Interrupt Service Routines (ISRs), executing Deferred Procedure Calls (DPCs), Device Driver calls and other kernel-mode functions of the Windows® Operating System. |
ZABBIX_ACTIVE | perf_counter_en[«Processor Information(_total)% Privileged Time»] |
| CPU | CPU DPC time |
Processor DPC time is the time that a single processor spent receiving and servicing deferred procedure calls (DPCs). DPCs are interrupts that run at a lower priority than standard interrupts. % DPC Time is a component of % Privileged Time because DPCs are executed in privileged mode. If a high % DPC Time is sustained, there may be a processor bottleneck or an application or hardware related issue that can significantly diminish overall system performance. |
ZABBIX_ACTIVE | perf_counter_en[«Processor Information(_total)% DPC Time»] |
| CPU | CPU user time |
The Processor Information% User Time counter shows the percent of time that the processor(s) is spent executing in User mode. |
ZABBIX_ACTIVE | perf_counter_en[«Processor Information(_total)% User Time»] |
| CPU | Number of cores |
The number of logical processors available on the computer. |
ZABBIX_ACTIVE | wmi.get[root/cimv2,»Select NumberOfLogicalProcessors from Win32_ComputerSystem»] |
| CPU | CPU queue length |
The Processor Queue Length shows the number of threads that are observed as delayed in the processor Ready Queue and are waiting to be executed. |
ZABBIX_ACTIVE | perf_counter_en[«SystemProcessor Queue Length»] |
| Filesystems | {#FSLABEL}({#FSNAME}): Used space |
Used storage expressed in Bytes. |
DEPENDENT | vfs.fs.dependent.size[{#FSNAME},used]
Preprocessing: — JSONPATH: |
| Filesystems | {#FSLABEL}({#FSNAME}): Total space |
The total space expressed in Bytes. |
DEPENDENT | vfs.fs.dependent.size[{#FSNAME},total]
Preprocessing: — JSONPATH: |
| Filesystems | {#FSLABEL}({#FSNAME}): Space utilization |
Space utilization in % for {#FSNAME} |
DEPENDENT | vfs.fs.dependent.size[{#FSNAME},pused]
Preprocessing: — JSONPATH: |
| General | System local time |
The local system time of the host. |
ZABBIX_ACTIVE | system.localtime |
| General | System name |
The host name of the system. |
ZABBIX_ACTIVE | system.hostname
Preprocessing: — DISCARD_UNCHANGED_HEARTBEAT: |
| General | System description |
System description of the host. |
ZABBIX_ACTIVE | system.uname
Preprocessing: — DISCARD_UNCHANGED_HEARTBEAT: |
| General | Number of processes |
The number of processes. |
ZABBIX_ACTIVE | proc.num[] |
| General | Number of threads |
The number of threads used by all running processes. |
ZABBIX_ACTIVE | perf_counter_en[«SystemThreads»] |
| Inventory | Operating system |
— |
ZABBIX_ACTIVE | system.sw.os
Preprocessing: — DISCARD_UNCHANGED_HEARTBEAT: |
| Inventory | Operating system architecture |
The architecture of the operating system. |
ZABBIX_ACTIVE | system.sw.arch
Preprocessing: — DISCARD_UNCHANGED_HEARTBEAT: |
| Memory | Used memory |
Used memory in Bytes. |
ZABBIX_ACTIVE | vm.memory.size[used] |
| Memory | Total memory |
The total memory expressed in Bytes. |
ZABBIX_ACTIVE | vm.memory.size[total] |
| Memory | Memory utilization |
Memory utilization in %. |
CALCULATED | vm.memory.util
Expression:
|
| Memory | Cache bytes |
Cache Bytes is the sum of the MemorySystem Cache Resident Bytes, MemorySystem Driver Resident Bytes, MemorySystem Code Resident Bytes, and MemoryPool Paged Resident Bytes counters. This counter displays the last observed value only; it is not an average. |
ZABBIX_ACTIVE | perf_counter_en[«MemoryCache Bytes»] |
| Memory | Free swap space |
The free space of the swap volume/file expressed in bytes. |
CALCULATED | system.swap.free
Expression:
|
| Memory | Free swap space in % |
The free space of the swap volume/file expressed in %. |
DEPENDENT | system.swap.pfree
Preprocessing: — JAVASCRIPT: |
| Memory | Used swap space in % |
The used space of swap volume/file in percent. |
ZABBIX_ACTIVE | perf_counter_en[«Paging file(_Total)% Usage»] |
| Memory | Total swap space |
The total space of the swap volume/file expressed in bytes. |
ZABBIX_ACTIVE | system.swap.size[,total] |
| Memory | Free system page table entries |
This indicates the number of page table entries not currently in use by the system. If the number is less than 5,000, there may well be a memory leak or you running out of memory. |
ZABBIX_ACTIVE | perf_counter_en[«MemoryFree System Page Table Entries»] |
| Memory | Memory page faults per second |
Page Faults/sec is the average number of pages faulted per second. It is measured in number of pages faulted per second because only one page is faulted in each fault operation, hence this is also equal to the number of page fault operations. This counter includes both hard faults (those that require disk access) and soft faults (where the faulted page is found elsewhere in physical memory.) Most processors can handle large numbers of soft faults without significant consequence. However, hard faults, which require disk access, can cause significant delays. |
ZABBIX_ACTIVE | perf_counter_en[«MemoryPage Faults/sec»] |
| Memory | Memory pages per second |
This measures the rate at which pages are read from or written to disk to resolve hard page faults. If the value is greater than 1,000, as a result of excessive paging, there may be a memory leak. |
ZABBIX_ACTIVE | perf_counter_en[«MemoryPages/sec»] |
| Memory | Memory pool non-paged |
This measures the size, in bytes, of the non-paged pool. This is an area of system memory for objects that cannot be written to disk but instead must remain in physical memory as long as they are allocated. There is a possible memory leak if the value is greater than 175MB (or 100MB with the /3GB switch). A typical Event ID 2019 is recorded in the system event log. |
ZABBIX_ACTIVE | perf_counter_en[«MemoryPool Nonpaged Bytes»] |
| Monitoring agent | Version of Zabbix agent running |
— |
ZABBIX_ACTIVE | agent.version
Preprocessing: — DISCARD_UNCHANGED_HEARTBEAT: |
| Monitoring agent | Host name of Zabbix agent running |
— |
ZABBIX_ACTIVE | agent.hostname
Preprocessing: — DISCARD_UNCHANGED_HEARTBEAT: |
| Monitoring agent | Active agent availability |
Availability of active checks on the host. The value of this item corresponds to availability icons in the host list. Possible value: 0 — unknown 1 — available 2 — not available |
INTERNAL | zabbix[host,active_agent,available] |
| Network interfaces | Interface {#IFNAME}({#IFALIAS}): Bits received |
Incoming traffic on the network interface. |
ZABBIX_ACTIVE | net.if.in[«{#IFGUID}»]
Preprocessing: — CHANGE_PER_SECOND — MULTIPLIER: |
| Network interfaces | Interface {#IFNAME}({#IFALIAS}): Bits sent |
Outgoing traffic on the network interface. |
ZABBIX_ACTIVE | net.if.out[«{#IFGUID}»]
Preprocessing: — CHANGE_PER_SECOND — MULTIPLIER: |
| Network interfaces | Interface {#IFNAME}({#IFALIAS}): Inbound packets discarded |
The number of incoming packets dropped on the network interface. |
ZABBIX_ACTIVE | net.if.in[«{#IFGUID}»,dropped]
Preprocessing: — CHANGE_PER_SECOND |
| Network interfaces | Interface {#IFNAME}({#IFALIAS}): Outbound packets discarded |
The number of outgoing packets dropped on the network interface. |
ZABBIX_ACTIVE | net.if.out[«{#IFGUID}»,dropped]
Preprocessing: — CHANGE_PER_SECOND |
| Network interfaces | Interface {#IFNAME}({#IFALIAS}): Inbound packets with errors |
The number of incoming packets with errors on the network interface. |
ZABBIX_ACTIVE | net.if.in[«{#IFGUID}»,errors]
Preprocessing: — CHANGE_PER_SECOND |
| Network interfaces | Interface {#IFNAME}({#IFALIAS}): Outbound packets with errors |
The number of outgoing packets with errors on the network interface. |
ZABBIX_ACTIVE | net.if.out[«{#IFGUID}»,errors]
Preprocessing: — CHANGE_PER_SECOND |
| Network interfaces | Interface {#IFNAME}({#IFALIAS}): Speed |
Estimated bandwidth of the network interface if any. |
DEPENDENT | net.if.speed[«{#IFGUID}»]
Preprocessing: — JSONPATH: ⛔️ON_FAIL: — JAVASCRIPT: — DISCARD_UNCHANGED_HEARTBEAT: |
| Network interfaces | Interface {#IFNAME}({#IFALIAS}): Interface type |
The type of the network interface. |
DEPENDENT | net.if.type[«{#IFGUID}»]
Preprocessing: — JSONPATH: — DISCARD_UNCHANGED_HEARTBEAT: |
| Network interfaces | Interface {#IFNAME}({#IFALIAS}): Operational status |
The operational status of the network interface. |
DEPENDENT | net.if.status[«{#IFGUID}»]
Preprocessing: — JSONPATH: — DISCARD_UNCHANGED_HEARTBEAT: |
| Services | State of service «{#SERVICE.NAME}» ({#SERVICE.DISPLAYNAME}) |
— |
ZABBIX_ACTIVE | service.info[«{#SERVICE.NAME}»,state] |
| Status | Uptime |
The system uptime expressed in the following format:»N days, hh:mm:ss». |
ZABBIX_ACTIVE | system.uptime |
| Status | Zabbix agent ping |
The agent always returns 1 for this item. It could be used in combination with nodata() for availability check. |
ZABBIX_ACTIVE | agent.ping |
| Storage | {#DEVNAME}: Disk read rate |
Rate of read operations on the disk. |
ZABBIX_ACTIVE | perf_counter_en[«PhysicalDisk({#DEVNAME})Disk Reads/sec»,60] |
| Storage | {#DEVNAME}: Disk write rate |
Rate of write operations on the disk. |
ZABBIX_ACTIVE | perf_counter_en[«PhysicalDisk({#DEVNAME})Disk Writes/sec»,60] |
| Storage | {#DEVNAME}: Disk average queue size (avgqu-sz) |
The current average disk queue; the number of requests outstanding on the disk while the performance data is being collected. |
ZABBIX_ACTIVE | perf_counter_en[«PhysicalDisk({#DEVNAME})Current Disk Queue Length»,60] |
| Storage | {#DEVNAME}: Disk utilization by idle time |
This item is the percentage of elapsed time that the selected disk drive was busy servicing read or writes requests based on idle time. |
ZABBIX_ACTIVE | perf_counter_en[«PhysicalDisk({#DEVNAME})% Idle Time»,60]
Preprocessing: — JAVASCRIPT: |
| Storage | {#DEVNAME}: Disk read request avg waiting time |
The average time for read requests issued to the device to be served. This includes the time spent by the requests in queue and the time spent servicing them. |
ZABBIX_ACTIVE | perf_counter_en[«PhysicalDisk({#DEVNAME})Avg. Disk sec/Read»,60] |
| Storage | {#DEVNAME}: Disk write request avg waiting time |
The average time for write requests issued to the device to be served. This includes the time spent by the requests in queue and the time spent servicing them. |
ZABBIX_ACTIVE | perf_counter_en[«PhysicalDisk({#DEVNAME})Avg. Disk sec/Write»,60] |
| Storage | {#DEVNAME}: Average disk read queue length |
Average disk read queue, the number of requests outstanding on the disk at the time the performance data is collected. |
ZABBIX_ACTIVE | perf_counter_en[«PhysicalDisk({#DEVNAME})Avg. Disk Read Queue Length»,60] |
| Storage | {#DEVNAME}: Average disk write queue length |
Average disk write queue, the number of requests outstanding on the disk at the time the performance data is collected. |
ZABBIX_ACTIVE | perf_counter_en[«PhysicalDisk({#DEVNAME})Avg. Disk Write Queue Length»,60] |
| Zabbix raw items | Get filesystems |
The |
ZABBIX_ACTIVE | vfs.fs.get |
| Zabbix raw items | Network interfaces WMI get |
Raw data of win32_networkadapter. |
ZABBIX_ACTIVE | wmi.getall[rootcimv2,»select Name,Description,NetConnectionID,Speed,AdapterTypeId,NetConnectionStatus,GUID from win32_networkadapter where PhysicalAdapter=True and NetConnectionStatus>0″]
Preprocessing: — DISCARD_UNCHANGED_HEARTBEAT: |
| Zabbix raw items | {#FSLABEL}({#FSNAME}): Get filesystem data |
— |
DEPENDENT | vfs.fs.dependent[{#FSNAME},data]
Preprocessing: — JSONPATH: |
Triggers
| Name | Description | Expression | Severity | Dependencies and additional info |
|---|---|---|---|---|
| High CPU utilization |
The CPU utilization is too high. The system might be slow to respond. |
min(/Windows by Zabbix agent active/system.cpu.util,5m)>{$CPU.UTIL.CRIT} |
WARNING | |
| CPU interrupt time is too high |
«The CPU Interrupt Time in the last 5 minutes exceeds {$CPU.INTERRUPT.CRIT.MAX}%.» The Processor Information% Interrupt Time is the time the processor spends receiving and servicing hardware interrupts during sample intervals. This value is an indirect indicator of the activity of devices that generate interrupts, such as the system clock, the mouse, disk drivers, data communication lines, network interface cards and other peripheral devices. This is an easy way to identify a potential hardware failure. This should never be higher than 20%. |
min(/Windows by Zabbix agent active/perf_counter_en["Processor Information(_total)% Interrupt Time"],5m)>{$CPU.INTERRUPT.CRIT.MAX} |
WARNING |
Depends on: — High CPU utilization |
| CPU privileged time is too high |
The CPU privileged time in the last 5 minutes exceeds {$CPU.PRIV.CRIT.MAX}%. |
min(/Windows by Zabbix agent active/perf_counter_en["Processor Information(_total)% Privileged Time"],5m)>{$CPU.PRIV.CRIT.MAX} |
WARNING |
Depends on: — CPU interrupt time is too high — High CPU utilization |
| CPU queue length is too high |
The CPU Queue Length in the last 5 minutes exceeds {$CPU.QUEUE.CRIT.MAX}. According to actual observations, PQL should not exceed the number of cores * 2. To fine-tune the conditions, use the macro {$CPU.QUEUE.CRIT.MAX }. |
min(/Windows by Zabbix agent active/perf_counter_en["SystemProcessor Queue Length"],5m) - last(/Windows by Zabbix agent active/wmi.get[root/cimv2,"Select NumberOfLogicalProcessors from Win32_ComputerSystem"]) * 2 > {$CPU.QUEUE.CRIT.MAX} |
WARNING |
Depends on: — High CPU utilization |
| {#FSLABEL}({#FSNAME}): Disk space is critically low |
Two conditions should match: First, space utilization should be above {$VFS.FS.PUSED.MAX.CRIT:»{#FSNAME}»}. Second condition should be one of the following: — The disk free space is less than {$VFS.FS.FREE.MIN.CRIT:»{#FSNAME}»}. — The disk will be full in less than 24 hours. |
last(/Windows by Zabbix agent active/vfs.fs.dependent.size[{#FSNAME},pused])>{$VFS.FS.PUSED.MAX.CRIT:"{#FSNAME}"} and ((last(/Windows by Zabbix agent active/vfs.fs.dependent.size[{#FSNAME},total])-last(/Windows by Zabbix agent active/vfs.fs.dependent.size[{#FSNAME},used]))<{$VFS.FS.FREE.MIN.CRIT:"{#FSNAME}"} or timeleft(/Windows by Zabbix agent active/vfs.fs.dependent.size[{#FSNAME},pused],1h,100)<1d) |
AVERAGE |
Manual close: YES |
| {#FSLABEL}({#FSNAME}): Disk space is low |
Two conditions should match: First, space utilization should be above {$VFS.FS.PUSED.MAX.WARN:»{#FSNAME}»}. Second condition should be one of the following: — The disk free space is less than {$VFS.FS.FREE.MIN.WARN:»{#FSNAME}»}. — The disk will be full in less than 24 hours. |
last(/Windows by Zabbix agent active/vfs.fs.dependent.size[{#FSNAME},pused])>{$VFS.FS.PUSED.MAX.WARN:"{#FSNAME}"} and ((last(/Windows by Zabbix agent active/vfs.fs.dependent.size[{#FSNAME},total])-last(/Windows by Zabbix agent active/vfs.fs.dependent.size[{#FSNAME},used]))<{$VFS.FS.FREE.MIN.WARN:"{#FSNAME}"} or timeleft(/Windows by Zabbix agent active/vfs.fs.dependent.size[{#FSNAME},pused],1h,100)<1d) |
WARNING |
Manual close: YES Depends on: — {#FSLABEL}({#FSNAME}): Disk space is critically low |
| System time is out of sync |
The host system time is different from the Zabbix server time. |
fuzzytime(/Windows by Zabbix agent active/system.localtime,{$SYSTEM.FUZZYTIME.MAX})=0 |
WARNING |
Manual close: YES |
| System name has changed |
System name has changed. Ack to close. |
change(/Windows by Zabbix agent active/system.hostname) and length(last(/Windows by Zabbix agent active/system.hostname))>0 |
INFO |
Manual close: YES |
| Operating system description has changed |
The description of the operating system has changed. Possible reasons are that the system has been updated or replaced. Ack to close the problem manually. |
change(/Windows by Zabbix agent active/system.sw.os) and length(last(/Windows by Zabbix agent active/system.sw.os))>0 |
INFO |
Manual close: YES Depends on: — System name has changed |
| High memory utilization |
The system is running out of free memory. |
min(/Windows by Zabbix agent active/vm.memory.util,5m)>{$MEMORY.UTIL.MAX} |
AVERAGE | |
| High swap space usage |
This trigger is ignored, if there is no swap configured |
max(/Windows by Zabbix agent active/system.swap.pfree,5m)<{$SWAP.PFREE.MIN.WARN} and last(/Windows by Zabbix agent active/system.swap.size[,total])>0 |
WARNING |
Depends on: — High memory utilization |
| Number of free system page table entries is too low |
The Memory Free System Page Table Entries is less than {$MEM.PAGE_TABLE_CRIT.MIN} for 5 minutes. If the number is less than 5,000, there may well be a memory leak. |
max(/Windows by Zabbix agent active/perf_counter_en["MemoryFree System Page Table Entries"],5m)<{$MEM.PAGE_TABLE_CRIT.MIN} |
WARNING |
Depends on: — High memory utilization |
| The Memory Pages/sec is too high |
The Memory Pages/sec in the last 5 minutes exceeds {$MEM.PAGE_SEC.CRIT.MAX}. If the value is greater than 1,000, as a result of excessive paging, there may be a memory leak. |
min(/Windows by Zabbix agent active/perf_counter_en["MemoryPages/sec"],5m)>{$MEM.PAGE_SEC.CRIT.MAX} |
WARNING |
Depends on: — High memory utilization |
| Zabbix agent: active checks are not available |
Active checks are considered unavailable. Agent is not sending heartbeat for prolonged time. |
min(/Windows by Zabbix agent active/zabbix[host,active_agent,available],{$AGENT.TIMEOUT})=2 |
HIGH | |
| Interface {#IFNAME}({#IFALIAS}): High bandwidth usage |
The network interface utilization is close to its estimated maximum bandwidth. |
(avg(/Windows by Zabbix agent active/net.if.in["{#IFGUID}"],15m)>({$IF.UTIL.MAX:"{#IFNAME}"}/100)*last(/Windows by Zabbix agent active/net.if.speed["{#IFGUID}"]) or avg(/Windows by Zabbix agent active/net.if.out["{#IFGUID}"],15m)>({$IF.UTIL.MAX:"{#IFNAME}"}/100)*last(/Windows by Zabbix agent active/net.if.speed["{#IFGUID}"])) and last(/Windows by Zabbix agent active/net.if.speed["{#IFGUID}"])>0
Recovery expression:
|
WARNING |
Manual close: YES Depends on: — Interface {#IFNAME}({#IFALIAS}): Link down |
| Interface {#IFNAME}({#IFALIAS}): High error rate |
Recovers when below 80% of {$IF.ERRORS.WARN:»{#IFNAME}»} threshold |
min(/Windows by Zabbix agent active/net.if.in["{#IFGUID}",errors],5m)>{$IF.ERRORS.WARN:"{#IFNAME}"} or min(/Windows by Zabbix agent active/net.if.out["{#IFGUID}",errors],5m)>{$IF.ERRORS.WARN:"{#IFNAME}"}
Recovery expression:
|
WARNING |
Manual close: YES Depends on: — Interface {#IFNAME}({#IFALIAS}): Link down |
| Interface {#IFNAME}({#IFALIAS}): Ethernet has changed to lower speed than it was before |
This Ethernet connection has transitioned down from its known maximum speed. This might be a sign of autonegotiation issues. Ack to close. |
change(/Windows by Zabbix agent active/net.if.speed["{#IFGUID}"])<0 and last(/Windows by Zabbix agent active/net.if.speed["{#IFGUID}"])>0 and last(/Windows by Zabbix agent active/net.if.status["{#IFGUID}"])=2 |
INFO |
Manual close: YES Depends on: — Interface {#IFNAME}({#IFALIAS}): Link down |
| Interface {#IFNAME}({#IFALIAS}): Link down |
This trigger expression works as follows: 1. Can be triggered if operations status is down. 2. {$IFCONTROL:»{#IFNAME}»}=1 — user can redefine Context macro to value — 0. That marks this interface as not important. No new trigger will be fired if this interface is down. 3. {TEMPLATE_NAME:METRIC.diff()}=1) — trigger fires only if operational status is different from Connected(2). WARNING: if closed manually — won’t fire again on next poll, because of .diff. |
{$IFCONTROL:"{#IFNAME}"}=1 and last(/Windows by Zabbix agent active/net.if.status["{#IFGUID}"])<>2 and (last(/Windows by Zabbix agent active/net.if.status["{#IFGUID}"],#1)<>last(/Windows by Zabbix agent active/net.if.status["{#IFGUID}"],#2))
Recovery expression:
|
AVERAGE |
Manual close: YES |
| «{#SERVICE.NAME}» ({#SERVICE.DISPLAYNAME}) is not running |
The service has a state other than «Running» for the last three times. |
min(/Windows by Zabbix agent active/service.info["{#SERVICE.NAME}",state],#3)<>0 |
AVERAGE | |
| Host has been restarted |
The device uptime is less than 10 minutes. |
last(/Windows by Zabbix agent active/system.uptime)<10m |
WARNING |
Manual close: YES |
| Zabbix agent is not available |
For active agents, nodata() with agent.ping is used with {$AGENT.NODATA_TIMEOUT} as time threshold. |
nodata(/Windows by Zabbix agent active/agent.ping,{$AGENT.NODATA_TIMEOUT})=1 |
AVERAGE |
Manual close: YES |
| {#DEVNAME}: Disk is overloaded |
The disk appears to be under heavy load |
min(/Windows by Zabbix agent active/perf_counter_en["PhysicalDisk({#DEVNAME})% Idle Time",60],15m)>{$VFS.DEV.UTIL.MAX.WARN} |
WARNING |
Manual close: YES Depends on: — {#DEVNAME}: Disk read request responses are too high — {#DEVNAME}: Disk write request responses are too high |
| {#DEVNAME}: Disk read request responses are too high |
This trigger might indicate disk {#DEVNAME} saturation. |
min(/Windows by Zabbix agent active/perf_counter_en["PhysicalDisk({#DEVNAME})Avg. Disk sec/Read",60],15m) > {$VFS.DEV.READ.AWAIT.WARN:"{#DEVNAME}"} |
WARNING |
Manual close: YES |
| {#DEVNAME}: Disk write request responses are too high |
This trigger might indicate disk {#DEVNAME} saturation. |
min(/Windows by Zabbix agent active/perf_counter_en["PhysicalDisk({#DEVNAME})Avg. Disk sec/Write",60],15m) > {$VFS.DEV.WRITE.AWAIT.WARN:"{#DEVNAME}"} |
WARNING |
Manual close: YES |
Feedback
Please report any issues with the template at https://support.zabbix.com.
You can also provide feedback, discuss the template, or ask for help at ZABBIX forums.
С появлением в сети Windows 10, правила обнаружения zabbix стали чудить. После перезагрузки Windows 10 начали появляться проблемы на тригирах типа:
WpnUserService_6911069
то есть служба и уникальный номер. Оповещения начали утомлять. Принято решение отключить часть служб от контроля. Будем фильтровать регулярными выражениями те службы, которые не являются критичными и windows их периодически запускает и останавливает.
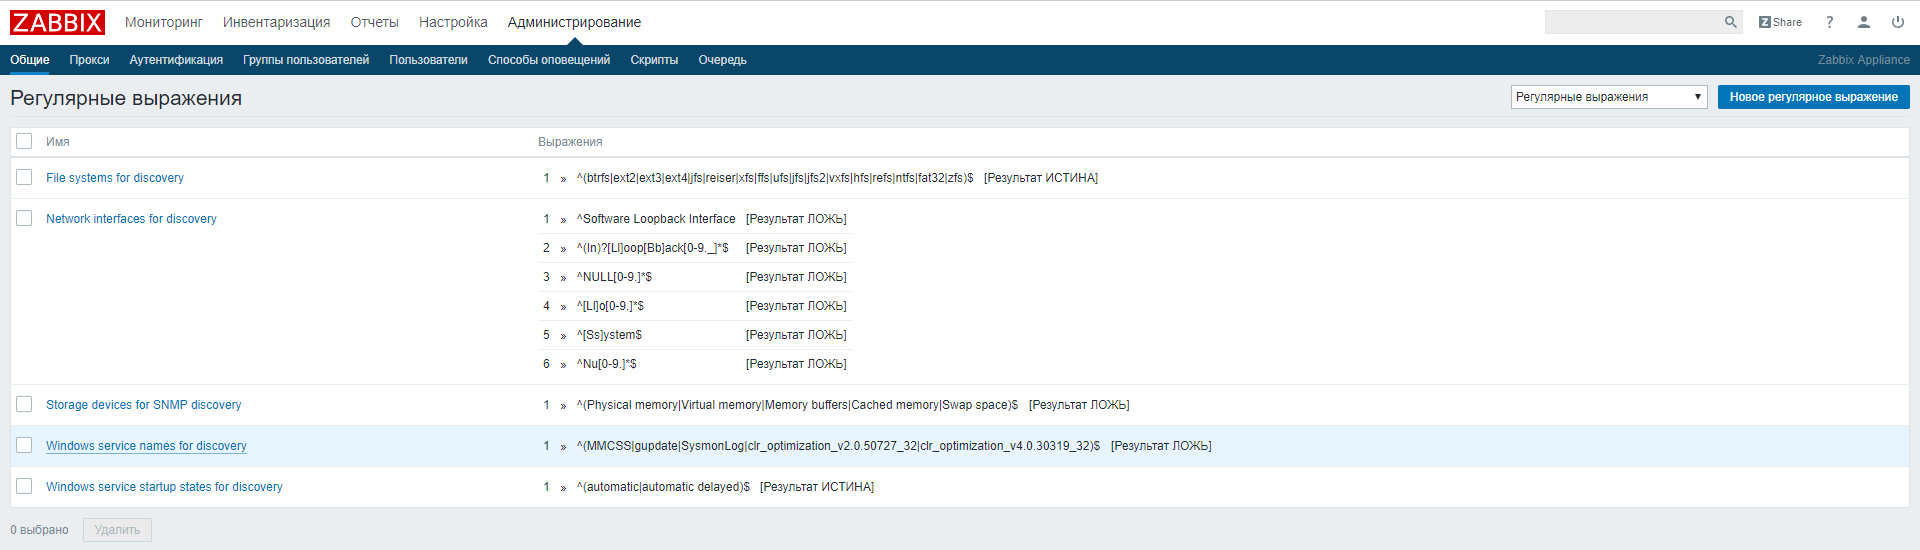
Переходим: Администрирование -> Общие -> Регулярные выражения.
Находим строчку:
Windows service names for discovery
^(MMCSS|gupdate|SysmonLog|clr_optimization_v2.0.50727_32|clr_optimization_v4.0.30319_32)$
[Результат ЛОЖЬ]
Добавляем правила регулярного выражения фильтрации по вкусу, вот мои:
^(MMCSS|gupdate|SysmonLog|clr_optimization.*|DoSvc|sppsvc|MapsBroker|WpnUser.*|OneSync.*|gpsvc|BITS|CDPUserSvc.*|TrustedInstaller)$
Все, наслаждаемся тишиной, больше никаких ложных срабатываний!
This entry was posted on Четверг, 5 марта, 2020 at 10:25 and is filed under Windows, Администрирование. You can follow any responses to this entry through the RSS 2.0 feed.
You can skip to the end and leave a response. Pinging is currently not allowed.